

Key Insights
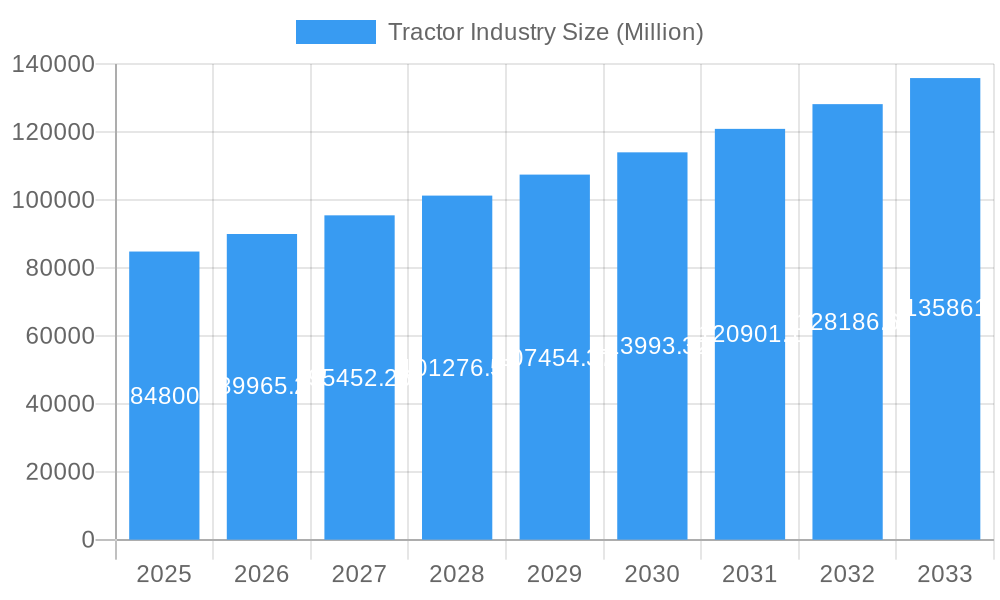
The global tractor market, valued at $84.80 billion in 2025, is projected to experience robust growth, driven by a Compound Annual Growth Rate (CAGR) of 5.90% from 2025 to 2033. This expansion is fueled by several key factors. Increasing agricultural mechanization in developing economies, particularly in Asia-Pacific and parts of South America, is a significant driver. Farmers are increasingly adopting tractors to enhance productivity and efficiency, addressing labor shortages and improving yields. Technological advancements, such as the incorporation of precision farming technologies (GPS, auto-steering), fuel-efficient engines, and advanced implements, are further boosting market growth. Government initiatives promoting agricultural modernization and providing subsidies for tractor purchases in various regions also play a crucial role. The market is segmented by horsepower (below 40 HP, 40-100 HP, above 100 HP) and drive type (two-wheel drive, four-wheel drive/all-wheel drive), reflecting the diverse needs of different farming operations and terrains. Leading manufacturers like Deere & Company, Escorts Limited, and Mahindra & Mahindra are leveraging these trends through product innovation and strategic partnerships to consolidate their market share.
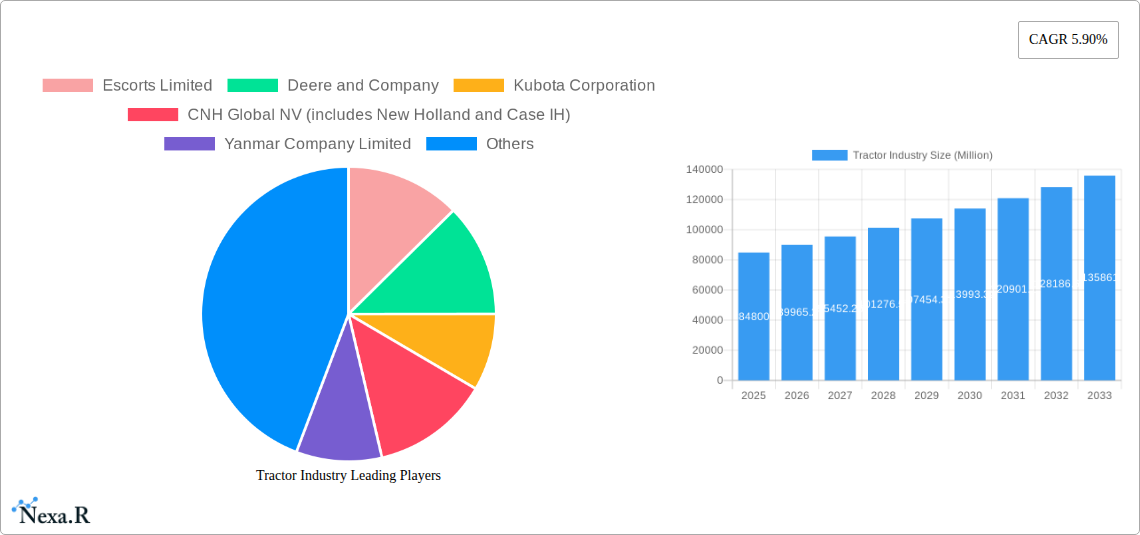
Tractor Industry Market Size (In Billion)
However, the market faces certain challenges. Fluctuations in fuel prices and raw material costs can impact tractor production and pricing. Economic downturns and unfavorable weather patterns can also affect farmer investment in new equipment. Furthermore, stringent emission regulations and the increasing adoption of sustainable farming practices are pushing manufacturers to develop more environmentally friendly tractors, which represents both an opportunity and a challenge. Despite these restraints, the long-term outlook for the tractor market remains positive, driven by the persistent need for efficient and technologically advanced agricultural machinery to meet global food demands. The diverse range of models, catering to various horsepower requirements and terrains, ensures a broad market appeal and sustained growth potential. Regional variations in growth rates will likely be influenced by factors such as economic development, agricultural policies, and the adoption rate of advanced technologies.
Tractor Industry Company Market Share
Tractor Industry Market Report: 2019-2033
This comprehensive report provides an in-depth analysis of the global tractor industry, encompassing market dynamics, growth trends, key players, and future outlook. With a focus on both agricultural and industrial tractor segments, this report offers invaluable insights for industry professionals, investors, and strategic decision-makers. The study period covers 2019-2033, with 2025 as the base year.
Tractor Industry Market Dynamics & Structure
The global tractor market, valued at approximately **USD 75-85 billion in 2024**, is characterized by a moderately concentrated yet dynamic landscape. Leading global manufacturers like Deere & Company, Mahindra & Mahindra, and CNH Industrial command a substantial share. However, the market also thrives on the contributions of a diverse array of regional specialists and niche manufacturers, collectively driving the overall market volume. Key growth catalysts include relentless technological advancements, particularly in the realms of automation, precision farming techniques, and the burgeoning field of electrification. Furthermore, increasingly stringent global emission regulations are actively steering manufacturers towards developing cleaner and more sustainable tractor technologies. The burgeoning demand from developing economies, eager to enhance their agricultural productivity, acts as a significant expansionary force. In parallel, the market is witnessing a notable uptick in strategic Mergers & Acquisitions (M&A) activities. Major industry players are proactively acquiring smaller, innovative companies to broaden their product portfolios, enhance their technological capabilities, and expand their global geographic reach.
- Market Concentration: Moderately concentrated, with the top 5 players estimated to hold approximately 45-55% of the global market share.
- Technological Innovation: A strong emphasis on automation (e.g., autonomous tractors), advanced precision farming technologies (e.g., GPS guidance, variable rate application), electrification, and the exploration of alternative fuel powertrains (e.g., hydrogen, biofuels) are defining the innovation landscape.
- Regulatory Framework: Stringent emission control standards (e.g., EPA Tier 4, EU Stage V) and evolving safety regulations are critical factors influencing product development and market entry strategies.
- Competitive Substitutes: While direct substitutes are limited, alternative agricultural mechanization methods, advancements in crop management technologies, and the increasing adoption of rental or shared equipment models can represent indirect competitive pressures.
- End-User Demographics: The primary customer base consists of commercial farmers and large-scale agricultural businesses. However, there is a growing demand from the construction sector for specialized tractor applications and from various industrial segments requiring heavy-duty machinery.
- M&A Trends: A significant surge in M&A activity has been observed, fueled by strategic imperatives for portfolio expansion, technological integration, and market consolidation. Approximately 15-20 significant M&A deals were recorded globally between 2019 and 2024.
Tractor Industry Growth Trends & Insights
The global tractor market is demonstrating a robust and sustained growth trajectory. This expansion is underpinned by a confluence of factors, including the imperative for increased agricultural output to feed a growing global population, significant investments in infrastructure development, and proactive government initiatives aimed at promoting agricultural mechanization. Historically, the market experienced a Compound Annual Growth Rate (CAGR) of approximately 4.5-5.5% during the period of 2019-2024. Projections indicate a sustained CAGR of around 5.0-6.0% for the forecast period spanning 2025-2033, with the market anticipated to reach an impressive volume of approximately 3.5-4.0 million units by 2033. The accelerated adoption of cutting-edge technologies, such as highly accurate GPS-guided tractors and increasingly sophisticated autonomous operating systems, is revolutionizing operational efficiency and boosting agricultural productivity to unprecedented levels. Furthermore, a discernible shift in consumer preferences towards more fuel-efficient and environmentally conscious tractor models is acting as a significant contributor to market growth. Developing economies, particularly within Asia and Africa, represent substantial growth opportunities, driven by expanding arable land under cultivation and strong governmental support for modernizing agricultural practices.
Dominant Regions, Countries, or Segments in Tractor Industry
The North American and European markets continue to be significant for high horsepower tractors and advanced technologies, while the Asia-Pacific region, particularly India and China, leads in the volume of tractors sold, particularly in the below 100 HP segments. The 40 HP - 100 HP segment dominates overall sales globally, representing xx% of the market.
By Horsepower:
- Below 40 HP: Strong growth in developing economies due to affordability and suitability for small landholdings. xx% market share in 2025.
- 40 HP - 100 HP: Largest segment globally, driven by demand for versatile tractors in diverse agricultural applications. xx% market share in 2025.
- Above 100 HP: High demand in developed countries and large-scale farming operations. xx% market share in 2025.
By Drive Type:
- Two-wheel Drive: Remains popular in smaller farms and less demanding terrains. xx% market share in 2025.
- Four-wheel Drive/All-wheel Drive: Increasing demand driven by need for better traction and efficiency in varied terrains. xx% market share in 2025.
Key Drivers by Region: Government subsidies, favorable economic policies, and robust agricultural infrastructure are primary growth drivers in various regions.
Tractor Industry Product Landscape
The tractor industry is witnessing a continuous stream of product innovations, focusing on enhanced fuel efficiency, advanced features, and improved ergonomics. The integration of precision farming technologies, including GPS guidance, auto-steer, and variable rate technology, is transforming tractor operations. Autonomous tractors are emerging as a significant trend, offering higher productivity and reduced labor costs. Manufacturers are emphasizing the unique selling propositions of their products through durability, reliability, and advanced technology integration.
Key Drivers, Barriers & Challenges in Tractor Industry
Key Drivers:
- Increasing agricultural mechanization globally.
- Rising demand for food and agricultural products.
- Government support and subsidies for farmers.
- Technological advancements improving efficiency and productivity.
Challenges:
- High initial investment costs for advanced tractors.
- Fluctuations in commodity prices affecting farmer income.
- Supply chain disruptions impacting tractor manufacturing.
- Intense competition among established and emerging players. This has resulted in a price war, impacting profit margins by an estimated xx% in 2024.
Emerging Opportunities in Tractor Industry
- Growing demand for electric and alternative fuel tractors.
- Expansion into untapped markets in developing economies.
- Increasing adoption of precision farming and data analytics.
- Development of specialized tractors for specific crops and terrains.
Growth Accelerators in the Tractor Industry
Technological innovation stands as a paramount growth accelerator for the tractor industry. This is particularly evident in the rapid advancements within automation and precision farming technologies, which are fundamentally reshaping agricultural practices. Strategic partnerships and collaborations between established tractor manufacturers and innovative technology providers are playing a crucial role in facilitating the seamless integration of advanced features and enhanced operational capabilities into tractor designs. Furthermore, the strategic expansion into burgeoning emerging markets across Asia, Africa, and Latin America represents another significant driver of growth, as these regions seek to modernize their agricultural sectors and increase productivity.
Key Players Shaping the Tractor Industry Market
- Escorts Limited
- Deere and Company
- Kubota Corporation
- CNH Industrial NV
- Yanmar Company Limited
- Kuhn Group (Subsidiary of Bucher Industries)
- Deutz-Fahr (Part of SDF Group)
- Mahindra and Mahindra Corporation
- CLAAS KGaA mbH
- Tractors and Farm Equipment Limited (TAFE)
- AGCO Corporation
Notable Milestones in Tractor Industry Sector
- July 2022: Ashok Leyland introduced the AVTR 4220 and AVTR 4420 4x2 tractors.
- August 2022: Foxconn signed a contract manufacturing agreement with Monarch Tractor.
- September 2022: KAMAZ PJSC announced plans to expand its gas vehicle range.
- May 2023: CNH committed to a USD 50 million investment in the Indian farm machinery sector.
- October 2023: International Tractors Limited launched three new Solis tractor series, including an electric model.
- March 2024: Hyster Company agreed to supply 10 battery-powered terminal tractors to APM Terminals.
In-Depth Tractor Industry Market Outlook
The tractor industry is exceptionally well-positioned for sustained and significant growth in the coming years. This optimistic outlook is propelled by the relentless march of technological advancements, a growing global demand for agricultural produce driven by an expanding population, and the increasing adoption of modern farming techniques in developing economies. The future market landscape will undoubtedly be shaped by strategic acquisitions that consolidate market power, crucial partnerships that foster innovation, and the continuous development of tractors that are not only efficient but also environmentally sustainable. Key opportunities lie in the further development and widespread adoption of autonomous tractor technology, the creation of specialized tractors catering to specific niche agricultural or industrial applications, and the increasing demand for tractors powered by electric or alternative fuel sources. The overall outlook for the tractor industry is exceptionally bright, brimming with potential for both significant growth and transformative innovation.
Tractor Industry Segmentation
-
1. Horsepower
- 1.1. Below 40 HP
- 1.2. 40 HP - 100 HP
- 1.3. Above 100 HP
-
2. Drive Type
- 2.1. Two-wheel Drive
- 2.2. Four-wheel Drive/All-wheel Drive
Tractor Industry Segmentation By Geography
-
1. North America
- 1.1. United States
- 1.2. Canada
- 1.3. Rest of North America
-
2. Europe
- 2.1. Germany
- 2.2. United Kingdom
- 2.3. France
- 2.4. Spain
- 2.5. Italy
- 2.6. Rest of Europe
-
3. Asia Pacific
- 3.1. China
- 3.2. Japan
- 3.3. India
- 3.4. South Korea
- 3.5. Rest of Asia Pacific
-
4. Rest of the World
- 4.1. South America
- 4.2. Middle East and Africa
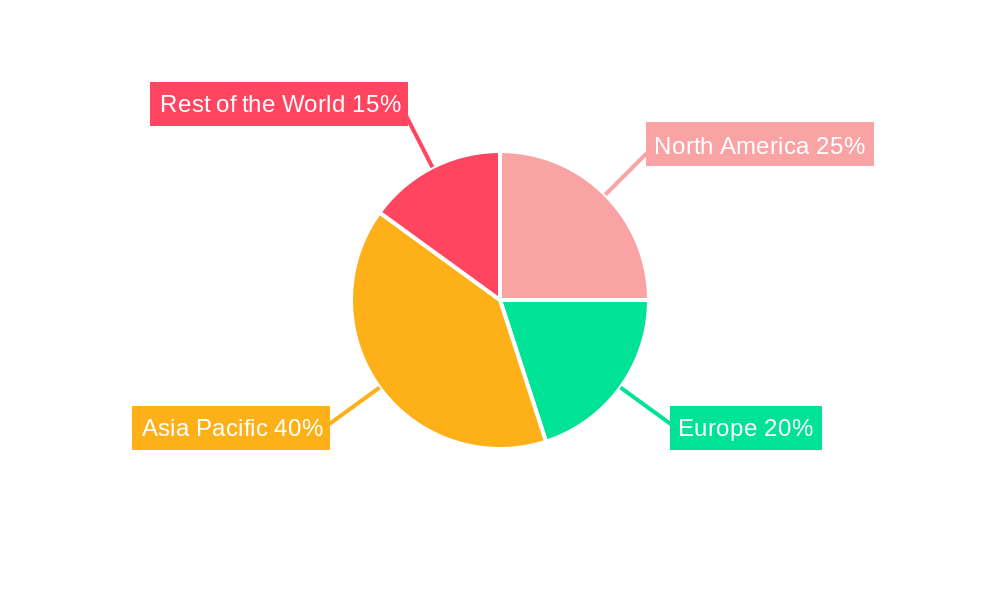
Tractor Industry Regional Market Share
Geographic Coverage of Tractor Industry
Tractor Industry REPORT HIGHLIGHTS
| Aspects | Details |
|---|---|
| Study Period | 2020-2034 |
| Base Year | 2025 |
| Estimated Year | 2026 |
| Forecast Period | 2026-2034 |
| Historical Period | 2020-2025 |
| Growth Rate | CAGR of 5.90% from 2020-2034 |
| Segmentation |
|
Table of Contents
- 1. Introduction
- 1.1. Research Scope
- 1.2. Market Segmentation
- 1.3. Research Objective
- 1.4. Definitions and Assumptions
- 2. Executive Summary
- 2.1. Market Snapshot
- 3. Market Dynamics
- 3.1. Market Drivers
- 3.2. Market Restrains
- 3.3. Market Trends
- 3.4. Market Opportunities
- 4. Market Factor Analysis
- 4.1. Porters Five Forces
- 4.1.1. Bargaining Power of Suppliers
- 4.1.2. Bargaining Power of Buyers
- 4.1.3. Threat of New Entrants
- 4.1.4. Threat of Substitutes
- 4.1.5. Competitive Rivalry
- 4.2. PESTEL analysis
- 4.3. BCG Analysis
- 4.3.1. Stars (High Growth, High Market Share)
- 4.3.2. Cash Cows (Low Growth, High Market Share)
- 4.3.3. Question Mark (High Growth, Low Market Share)
- 4.3.4. Dogs (Low Growth, Low Market Share)
- 4.4. Ansoff Matrix Analysis
- 4.5. Supply Chain Analysis
- 4.6. Regulatory Landscape
- 4.7. Current Market Potential and Opportunity Assessment (TAM–SAM–SOM Framework)
- 4.8. NRP Analyst Note
- 4.1. Porters Five Forces
- 5. Market Analysis, Insights and Forecast 2021-2033
- 5.1. Market Analysis, Insights and Forecast - by Horsepower
- 5.1.1. Below 40 HP
- 5.1.2. 40 HP - 100 HP
- 5.1.3. Above 100 HP
- 5.2. Market Analysis, Insights and Forecast - by Drive Type
- 5.2.1. Two-wheel Drive
- 5.2.2. Four-wheel Drive/All-wheel Drive
- 5.3. Market Analysis, Insights and Forecast - by Region
- 5.3.1. North America
- 5.3.2. Europe
- 5.3.3. Asia Pacific
- 5.3.4. Rest of the World
- 5.1. Market Analysis, Insights and Forecast - by Horsepower
- 6. Global Tractor Industry Analysis, Insights and Forecast, 2021-2033
- 6.1. Market Analysis, Insights and Forecast - by Horsepower
- 6.1.1. Below 40 HP
- 6.1.2. 40 HP - 100 HP
- 6.1.3. Above 100 HP
- 6.2. Market Analysis, Insights and Forecast - by Drive Type
- 6.2.1. Two-wheel Drive
- 6.2.2. Four-wheel Drive/All-wheel Drive
- 6.1. Market Analysis, Insights and Forecast - by Horsepower
- 7. North America Tractor Industry Analysis, Insights and Forecast, 2020-2032
- 7.1. Market Analysis, Insights and Forecast - by Horsepower
- 7.1.1. Below 40 HP
- 7.1.2. 40 HP - 100 HP
- 7.1.3. Above 100 HP
- 7.2. Market Analysis, Insights and Forecast - by Drive Type
- 7.2.1. Two-wheel Drive
- 7.2.2. Four-wheel Drive/All-wheel Drive
- 7.1. Market Analysis, Insights and Forecast - by Horsepower
- 8. Europe Tractor Industry Analysis, Insights and Forecast, 2020-2032
- 8.1. Market Analysis, Insights and Forecast - by Horsepower
- 8.1.1. Below 40 HP
- 8.1.2. 40 HP - 100 HP
- 8.1.3. Above 100 HP
- 8.2. Market Analysis, Insights and Forecast - by Drive Type
- 8.2.1. Two-wheel Drive
- 8.2.2. Four-wheel Drive/All-wheel Drive
- 8.1. Market Analysis, Insights and Forecast - by Horsepower
- 9. Asia Pacific Tractor Industry Analysis, Insights and Forecast, 2020-2032
- 9.1. Market Analysis, Insights and Forecast - by Horsepower
- 9.1.1. Below 40 HP
- 9.1.2. 40 HP - 100 HP
- 9.1.3. Above 100 HP
- 9.2. Market Analysis, Insights and Forecast - by Drive Type
- 9.2.1. Two-wheel Drive
- 9.2.2. Four-wheel Drive/All-wheel Drive
- 9.1. Market Analysis, Insights and Forecast - by Horsepower
- 10. Rest of the World Tractor Industry Analysis, Insights and Forecast, 2020-2032
- 10.1. Market Analysis, Insights and Forecast - by Horsepower
- 10.1.1. Below 40 HP
- 10.1.2. 40 HP - 100 HP
- 10.1.3. Above 100 HP
- 10.2. Market Analysis, Insights and Forecast - by Drive Type
- 10.2.1. Two-wheel Drive
- 10.2.2. Four-wheel Drive/All-wheel Drive
- 10.1. Market Analysis, Insights and Forecast - by Horsepower
- 11. Competitive Analysis
- 11.1. Company Profiles
- 11.1.1 Escorts Limited
- 11.1.1.1. Company Overview
- 11.1.1.2. Products
- 11.1.1.3. Company Financials
- 11.1.1.4. SWOT Analysis
- 11.1.2 Deere and Company
- 11.1.2.1. Company Overview
- 11.1.2.2. Products
- 11.1.2.3. Company Financials
- 11.1.2.4. SWOT Analysis
- 11.1.3 Kubota Corporation
- 11.1.3.1. Company Overview
- 11.1.3.2. Products
- 11.1.3.3. Company Financials
- 11.1.3.4. SWOT Analysis
- 11.1.4 CNH Global NV (includes New Holland and Case IH)
- 11.1.4.1. Company Overview
- 11.1.4.2. Products
- 11.1.4.3. Company Financials
- 11.1.4.4. SWOT Analysis
- 11.1.5 Yanmar Company Limited
- 11.1.5.1. Company Overview
- 11.1.5.2. Products
- 11.1.5.3. Company Financials
- 11.1.5.4. SWOT Analysis
- 11.1.6 Kuhn Group (Subsidiary of Bucher Industries)
- 11.1.6.1. Company Overview
- 11.1.6.2. Products
- 11.1.6.3. Company Financials
- 11.1.6.4. SWOT Analysis
- 11.1.7 Deutz-Fah
- 11.1.7.1. Company Overview
- 11.1.7.2. Products
- 11.1.7.3. Company Financials
- 11.1.7.4. SWOT Analysis
- 11.1.8 Mahindra and Mahindra Corporation
- 11.1.8.1. Company Overview
- 11.1.8.2. Products
- 11.1.8.3. Company Financials
- 11.1.8.4. SWOT Analysis
- 11.1.9 CLAAS KGaA mbH
- 11.1.9.1. Company Overview
- 11.1.9.2. Products
- 11.1.9.3. Company Financials
- 11.1.9.4. SWOT Analysis
- 11.1.10 Tractors and Farm Equipment Limited (TAFE)
- 11.1.10.1. Company Overview
- 11.1.10.2. Products
- 11.1.10.3. Company Financials
- 11.1.10.4. SWOT Analysis
- 11.1.11 AGCO Corporation (includes Massey Ferguson Valtra Fendt and Challenger)
- 11.1.11.1. Company Overview
- 11.1.11.2. Products
- 11.1.11.3. Company Financials
- 11.1.11.4. SWOT Analysis
- 11.1.1 Escorts Limited
- 11.2. Market Entropy
- 11.2.1 Company's Key Areas Served
- 11.2.2 Recent Developments
- 11.3. Company Market Share Analysis 2025
- 11.3.1 Top 5 Companies Market Share Analysis
- 11.3.2 Top 3 Companies Market Share Analysis
- 11.4. List of Potential Customers
- 12. Research Methodology
List of Figures
- Figure 1: Global Tractor Industry Revenue Breakdown (Million, %) by Region 2025 & 2033
- Figure 2: North America Tractor Industry Revenue (Million), by Horsepower 2025 & 2033
- Figure 3: North America Tractor Industry Revenue Share (%), by Horsepower 2025 & 2033
- Figure 4: North America Tractor Industry Revenue (Million), by Drive Type 2025 & 2033
- Figure 5: North America Tractor Industry Revenue Share (%), by Drive Type 2025 & 2033
- Figure 6: North America Tractor Industry Revenue (Million), by Country 2025 & 2033
- Figure 7: North America Tractor Industry Revenue Share (%), by Country 2025 & 2033
- Figure 8: Europe Tractor Industry Revenue (Million), by Horsepower 2025 & 2033
- Figure 9: Europe Tractor Industry Revenue Share (%), by Horsepower 2025 & 2033
- Figure 10: Europe Tractor Industry Revenue (Million), by Drive Type 2025 & 2033
- Figure 11: Europe Tractor Industry Revenue Share (%), by Drive Type 2025 & 2033
- Figure 12: Europe Tractor Industry Revenue (Million), by Country 2025 & 2033
- Figure 13: Europe Tractor Industry Revenue Share (%), by Country 2025 & 2033
- Figure 14: Asia Pacific Tractor Industry Revenue (Million), by Horsepower 2025 & 2033
- Figure 15: Asia Pacific Tractor Industry Revenue Share (%), by Horsepower 2025 & 2033
- Figure 16: Asia Pacific Tractor Industry Revenue (Million), by Drive Type 2025 & 2033
- Figure 17: Asia Pacific Tractor Industry Revenue Share (%), by Drive Type 2025 & 2033
- Figure 18: Asia Pacific Tractor Industry Revenue (Million), by Country 2025 & 2033
- Figure 19: Asia Pacific Tractor Industry Revenue Share (%), by Country 2025 & 2033
- Figure 20: Rest of the World Tractor Industry Revenue (Million), by Horsepower 2025 & 2033
- Figure 21: Rest of the World Tractor Industry Revenue Share (%), by Horsepower 2025 & 2033
- Figure 22: Rest of the World Tractor Industry Revenue (Million), by Drive Type 2025 & 2033
- Figure 23: Rest of the World Tractor Industry Revenue Share (%), by Drive Type 2025 & 2033
- Figure 24: Rest of the World Tractor Industry Revenue (Million), by Country 2025 & 2033
- Figure 25: Rest of the World Tractor Industry Revenue Share (%), by Country 2025 & 2033
List of Tables
- Table 1: Global Tractor Industry Revenue Million Forecast, by Horsepower 2020 & 2033
- Table 2: Global Tractor Industry Revenue Million Forecast, by Drive Type 2020 & 2033
- Table 3: Global Tractor Industry Revenue Million Forecast, by Region 2020 & 2033
- Table 4: Global Tractor Industry Revenue Million Forecast, by Horsepower 2020 & 2033
- Table 5: Global Tractor Industry Revenue Million Forecast, by Drive Type 2020 & 2033
- Table 6: Global Tractor Industry Revenue Million Forecast, by Country 2020 & 2033
- Table 7: United States Tractor Industry Revenue (Million) Forecast, by Application 2020 & 2033
- Table 8: Canada Tractor Industry Revenue (Million) Forecast, by Application 2020 & 2033
- Table 9: Rest of North America Tractor Industry Revenue (Million) Forecast, by Application 2020 & 2033
- Table 10: Global Tractor Industry Revenue Million Forecast, by Horsepower 2020 & 2033
- Table 11: Global Tractor Industry Revenue Million Forecast, by Drive Type 2020 & 2033
- Table 12: Global Tractor Industry Revenue Million Forecast, by Country 2020 & 2033
- Table 13: Germany Tractor Industry Revenue (Million) Forecast, by Application 2020 & 2033
- Table 14: United Kingdom Tractor Industry Revenue (Million) Forecast, by Application 2020 & 2033
- Table 15: France Tractor Industry Revenue (Million) Forecast, by Application 2020 & 2033
- Table 16: Spain Tractor Industry Revenue (Million) Forecast, by Application 2020 & 2033
- Table 17: Italy Tractor Industry Revenue (Million) Forecast, by Application 2020 & 2033
- Table 18: Rest of Europe Tractor Industry Revenue (Million) Forecast, by Application 2020 & 2033
- Table 19: Global Tractor Industry Revenue Million Forecast, by Horsepower 2020 & 2033
- Table 20: Global Tractor Industry Revenue Million Forecast, by Drive Type 2020 & 2033
- Table 21: Global Tractor Industry Revenue Million Forecast, by Country 2020 & 2033
- Table 22: China Tractor Industry Revenue (Million) Forecast, by Application 2020 & 2033
- Table 23: Japan Tractor Industry Revenue (Million) Forecast, by Application 2020 & 2033
- Table 24: India Tractor Industry Revenue (Million) Forecast, by Application 2020 & 2033
- Table 25: South Korea Tractor Industry Revenue (Million) Forecast, by Application 2020 & 2033
- Table 26: Rest of Asia Pacific Tractor Industry Revenue (Million) Forecast, by Application 2020 & 2033
- Table 27: Global Tractor Industry Revenue Million Forecast, by Horsepower 2020 & 2033
- Table 28: Global Tractor Industry Revenue Million Forecast, by Drive Type 2020 & 2033
- Table 29: Global Tractor Industry Revenue Million Forecast, by Country 2020 & 2033
- Table 30: South America Tractor Industry Revenue (Million) Forecast, by Application 2020 & 2033
- Table 31: Middle East and Africa Tractor Industry Revenue (Million) Forecast, by Application 2020 & 2033
Frequently Asked Questions
1. What is the projected Compound Annual Growth Rate (CAGR) of the Tractor Industry?
The projected CAGR is approximately 5.90%.
2. Which companies are prominent players in the Tractor Industry?
Key companies in the market include Escorts Limited, Deere and Company, Kubota Corporation, CNH Global NV (includes New Holland and Case IH), Yanmar Company Limited, Kuhn Group (Subsidiary of Bucher Industries), Deutz-Fah, Mahindra and Mahindra Corporation, CLAAS KGaA mbH, Tractors and Farm Equipment Limited (TAFE), AGCO Corporation (includes Massey Ferguson Valtra Fendt and Challenger).
3. What are the main segments of the Tractor Industry?
The market segments include Horsepower, Drive Type.
4. Can you provide details about the market size?
The market size is estimated to be USD 84.80 Million as of 2022.
5. What are some drivers contributing to market growth?
Rising Residential Activities in Addition to Consumer Spending to Enhance Market Demand.
6. What are the notable trends driving market growth?
The Below 40 HP Tractors Segment's Growth is Expected to be Bolstered over the Next Five Years.
7. Are there any restraints impacting market growth?
Rising Electric Vehicle Adoption to Hinder Market Growth in the Long Run.
8. Can you provide examples of recent developments in the market?
March 2024: Hyster Company announced an agreement to provide APM Terminals with 10 battery-powered terminal tractors for their location at the Port of Mobile in Alabama. The electric terminal tractors, which are scheduled to be delivered in 2024, are part of a USD 60 million investment in port equipment electrification pilots by APM Terminals.
9. What pricing options are available for accessing the report?
Pricing options include single-user, multi-user, and enterprise licenses priced at USD 4750, USD 5250, and USD 8750 respectively.
10. Is the market size provided in terms of value or volume?
The market size is provided in terms of value, measured in Million.
11. Are there any specific market keywords associated with the report?
Yes, the market keyword associated with the report is "Tractor Industry," which aids in identifying and referencing the specific market segment covered.
12. How do I determine which pricing option suits my needs best?
The pricing options vary based on user requirements and access needs. Individual users may opt for single-user licenses, while businesses requiring broader access may choose multi-user or enterprise licenses for cost-effective access to the report.
13. Are there any additional resources or data provided in the Tractor Industry report?
While the report offers comprehensive insights, it's advisable to review the specific contents or supplementary materials provided to ascertain if additional resources or data are available.
14. How can I stay updated on further developments or reports in the Tractor Industry?
To stay informed about further developments, trends, and reports in the Tractor Industry, consider subscribing to industry newsletters, following relevant companies and organizations, or regularly checking reputable industry news sources and publications.
Methodology
Step 1 - Identification of Relevant Samples Size from Population Database


Step 2 - Approaches for Defining Global Market Size (Value, Volume* & Price*)

Note*: In applicable scenarios
Step 3 - Data Sources
Primary Research
- Web Analytics
- Survey Reports
- Research Institute
- Latest Research Reports
- Opinion Leaders
Secondary Research
- Annual Reports
- White Paper
- Latest Press Release
- Industry Association
- Paid Database
- Investor Presentations

Step 4 - Data Triangulation
Involves using different sources of information in order to increase the validity of a study
These sources are likely to be stakeholders in a program - participants, other researchers, program staff, other community members, and so on.
Then we put all data in single framework & apply various statistical tools to find out the dynamic on the market.
During the analysis stage, feedback from the stakeholder groups would be compared to determine areas of agreement as well as areas of divergence