

Key Insights
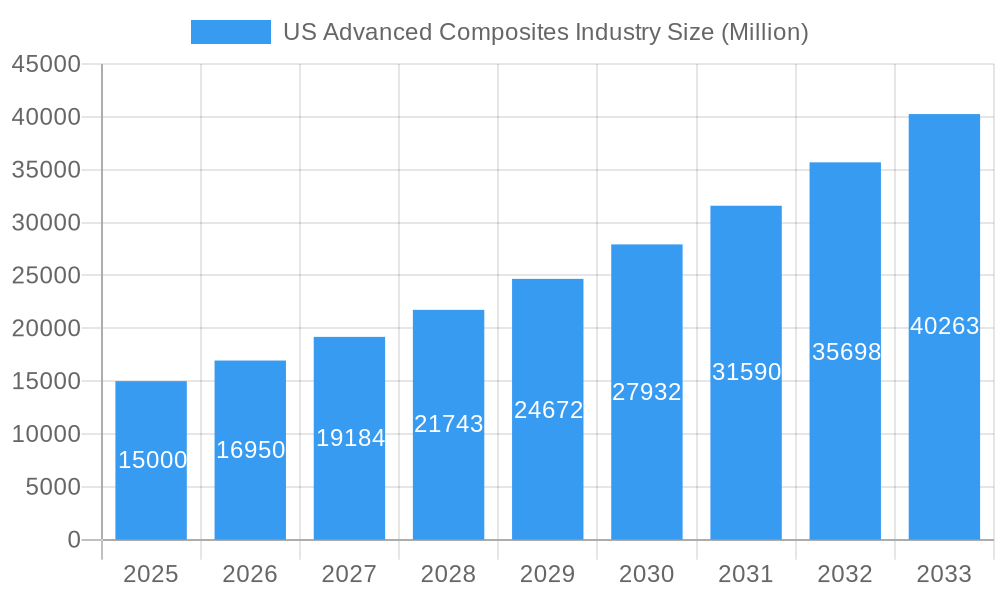
The US advanced composites market, valued at approximately $52.4 billion in the base year 2025, is poised for significant expansion. Projected to grow at a Compound Annual Growth Rate (CAGR) of 8.9% through 2033, this market's trajectory is shaped by key industry demands. The automotive sector's accelerating integration of lightweight, high-strength composites for vehicle structures and powertrain optimization is a primary growth catalyst. Concurrently, the aerospace industry's sustained need for advanced composite materials to enhance fuel efficiency and performance in aircraft manufacturing continues to drive demand. The burgeoning renewable energy sector, particularly wind power, presents substantial opportunities, as composites are essential for developing larger, more efficient wind turbine blades. Innovations in manufacturing techniques, including resin transfer molding and vacuum infusion processing, are improving cost-effectiveness and performance, further stimulating market growth. The market is segmented by production type, material type (thermoset polymers, thermoplastic polymers, carbon fiber, glass fiber), and application type (structural assembly, powertrain, interior, exterior). Despite challenges such as rising raw material costs and potential supply chain volatility, the market outlook remains exceptionally strong.
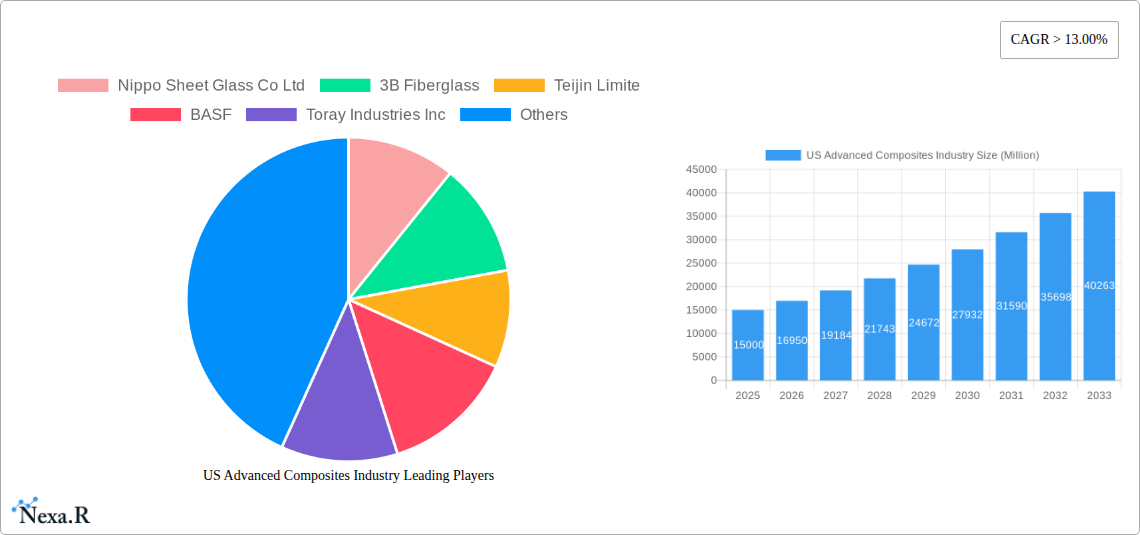
US Advanced Composites Industry Market Size (In Billion)
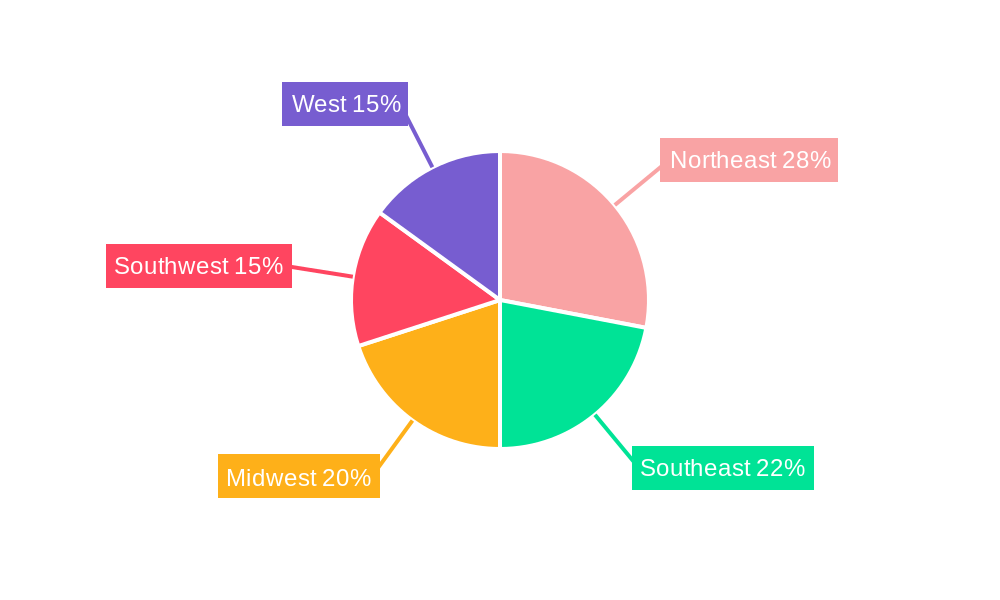
Growth is expected to be particularly robust in the automotive and renewable energy segments. The Northeast and West regions of the US are anticipated to lead market share, driven by concentrated automotive manufacturing and technological innovation hubs. The competitive landscape is dynamic, featuring key players such as Nippo Sheet Glass Co Ltd, 3B Fiberglass, Teijin Limited, BASF, Toray Industries Inc, and General Motors Company, among others. Strategic collaborations, mergers, acquisitions, and ongoing advancements in material science and manufacturing technology will be critical for sustained growth and profitability. Emerging trends also highlight the increasing importance of sustainability and the development of recyclable composite materials.
US Advanced Composites Industry Company Market Share
US Advanced Composites Industry Market Report: 2019-2033
This comprehensive report provides a detailed analysis of the US advanced composites industry, covering market dynamics, growth trends, key players, and future outlook. The study period spans 2019-2033, with 2025 as the base and estimated year. The report is invaluable for industry professionals, investors, and strategic decision-makers seeking to understand and capitalize on the opportunities within this dynamic sector. This report focuses on the parent market of advanced composites and delves into the various child markets, offering a granular understanding of the industry’s segmentation.
US Advanced Composites Industry Market Dynamics & Structure
The US advanced composites market is characterized by moderate concentration, with a few major players holding significant market share. The market structure is evolving rapidly, driven by technological innovation, particularly in materials science and manufacturing processes. Stringent regulatory frameworks, especially concerning environmental impact and safety, influence market behavior. Competition from alternative materials, such as high-strength steel and aluminum, remains a challenge. End-user demographics, primarily focused on the automotive, aerospace, and wind energy sectors, dictate demand patterns. M&A activity has been relatively robust in recent years, with xx deals recorded between 2019 and 2024, representing a xx% increase compared to the previous five-year period. This signifies consolidation and efforts to enhance market share and technological capabilities.
- Market Concentration: The top 5 players hold approximately xx% of the market share.
- Technological Innovation: Focus on lightweighting, high-strength materials, and automated manufacturing processes.
- Regulatory Framework: Emphasis on sustainability and safety standards, potentially impacting material choices.
- Competitive Substitutes: Steel, aluminum, and other high-performance materials pose a competitive threat.
- End-User Demographics: Automotive, aerospace, and wind energy sectors are key end-users.
- M&A Trends: Consolidation through mergers and acquisitions is a significant factor shaping the market landscape. The average deal size increased by xx% from 2019 to 2024.
US Advanced Composites Industry Growth Trends & Insights
The US advanced composites market experienced significant growth during the historical period (2019-2024), with a CAGR of xx%. This growth is primarily attributed to the increasing adoption of lightweight materials in the automotive and aerospace industries. Technological advancements in materials science and manufacturing processes, such as the development of improved carbon fiber and resin systems, further fuel market expansion. The changing consumer preference towards fuel-efficient vehicles and the growth of renewable energy sectors (particularly wind) are crucial driving factors. However, the market faced some challenges during the COVID-19 pandemic, resulting in a temporary slowdown in growth; nonetheless, the market is expected to rebound strongly in the coming years. Market penetration in key end-user sectors (e.g., automotive, aerospace) is projected to increase from xx% in 2024 to xx% in 2033.
The forecast period (2025-2033) anticipates a CAGR of xx%, driven by continued technological advancements, increasing demand for high-performance materials in various applications, and government initiatives promoting the use of sustainable materials. Challenges such as high raw material costs and the complexity of manufacturing processes are expected to persist, however, the overall market outlook remains positive.
Dominant Regions, Countries, or Segments in US Advanced Composites Industry
The automotive sector, particularly in the states of Michigan, Ohio, and Tennessee, drives significant demand within the US. Among the production types, Resin Transfer Molding (RTM) and Vacuum Infusion Processing (VIP) dominate, owing to their adaptability for large-scale manufacturing and superior mechanical properties. Within material types, carbon fiber composites are increasingly prevalent due to their high strength-to-weight ratio; however, glass fiber retains a larger market share due to its lower cost. The structural assembly application segment leads in growth potential due to its extensive use in automobiles and aerospace structures.
- Key Regional Drivers: Strong automotive manufacturing hubs contribute significantly to market growth.
- Production Type Dominance: RTM and VIP lead in terms of market share and growth rate.
- Material Type Preference: Carbon fiber composites are gaining traction, while glass fiber maintains a substantial market share.
- Application Type Growth: Structural assembly applications demonstrate significant growth potential.
US Advanced Composites Industry Product Landscape
The US advanced composites market offers a diverse range of products, including high-performance carbon fiber reinforced polymers (CFRPs), glass fiber reinforced polymers (GFRPs), and hybrid composites. Continuous innovation leads to improved mechanical properties, enhanced durability, and lightweight solutions. Key advancements include the development of novel resin systems with superior curing characteristics, improved fiber architectures for enhanced strength, and advanced manufacturing techniques for producing complex shapes. This evolution leads to cost-effective solutions and allows for increased adoption across various industries. The unique selling propositions frequently center on the ability to tailor properties to specific applications, maximizing performance and minimizing weight.
Key Drivers, Barriers & Challenges in US Advanced Composites Industry
Key Drivers: The primary drivers include increasing demand for lightweight materials in the automotive and aerospace industries, ongoing technological advancements in materials and manufacturing processes, and government regulations promoting sustainable materials. Examples include the fuel efficiency standards for automobiles and the growing focus on reducing carbon emissions.
Key Challenges: High raw material costs, particularly for carbon fiber, pose a significant barrier to entry and widespread adoption. Supply chain complexities and skilled labor shortages add to manufacturing challenges. Stringent regulatory compliance requirements and competition from alternative materials also impact market growth. The impact of these challenges is estimated to reduce the market growth by approximately xx% annually.
Emerging Opportunities in US Advanced Composites Industry
Emerging opportunities lie in the development of bio-based composites, advanced recycling techniques for composite materials, and expansion into new applications, such as 3D printing and additive manufacturing. Untapped markets in the infrastructure sector, construction, and renewable energy represent significant growth potentials.
Growth Accelerators in the US Advanced Composites Industry Industry
Technological breakthroughs in materials science and manufacturing, strategic partnerships between material suppliers and end-users, and expansion into new applications and markets will serve as key growth catalysts. Investments in research and development, particularly focusing on enhancing material properties and processing efficiency, will propel further market expansion.
Key Players Shaping the US Advanced Composites Industry Market
- Nippo Sheet Glass Co Ltd
- 3B Fiberglass
- Teijin Limited
- BASF
- Toray Industries Inc
- General Motors Company
- Base Group
- Cytec Industries Inc
- BMW
- Delphi Auto
- SGL Group
Notable Milestones in US Advanced Composites Industry Sector
- 2020: Introduction of a new high-strength carbon fiber by Toray Industries.
- 2021: Merger of two leading composite manufacturers, resulting in increased market share.
- 2022: Launch of a new sustainable resin system by BASF, addressing environmental concerns.
- 2023: Significant investment in automated composite manufacturing facilities by General Motors.
- 2024: Government initiatives promoting the use of advanced composites in infrastructure projects.
In-Depth US Advanced Composites Industry Market Outlook
The future of the US advanced composites market appears bright, driven by several factors. Continuous technological advancements promise superior performance and cost-effectiveness. Strategic partnerships across the value chain will optimize resource utilization and streamline manufacturing processes. Expansion into untapped markets, including infrastructure and renewable energy, presents considerable opportunities. The market is expected to witness strong growth in the coming years, presenting attractive prospects for both established players and new entrants.
US Advanced Composites Industry Segmentation
-
1. Productino Type
- 1.1. Hand Layup
- 1.2. Resin Transfer Molding
- 1.3. Vacuum Infusion Processing
- 1.4. Injection Molding
- 1.5. Compression Molding
-
2. Material Type
- 2.1. Thermoset Polymer
- 2.2. Thermoplastic Polymer
- 2.3. Carbon Fiber
- 2.4. Glass Fiber
- 2.5. Others
-
3. Application Type
- 3.1. Structural Assembly
- 3.2. Power Train Components
- 3.3. Interior
- 3.4. Exterior
- 3.5. Others
US Advanced Composites Industry Segmentation By Geography
-
1. North America
- 1.1. United States
- 1.2. Canada
- 1.3. Mexico
-
2. South America
- 2.1. Brazil
- 2.2. Argentina
- 2.3. Rest of South America
-
3. Europe
- 3.1. United Kingdom
- 3.2. Germany
- 3.3. France
- 3.4. Italy
- 3.5. Spain
- 3.6. Russia
- 3.7. Benelux
- 3.8. Nordics
- 3.9. Rest of Europe
-
4. Middle East & Africa
- 4.1. Turkey
- 4.2. Israel
- 4.3. GCC
- 4.4. North Africa
- 4.5. South Africa
- 4.6. Rest of Middle East & Africa
-
5. Asia Pacific
- 5.1. China
- 5.2. India
- 5.3. Japan
- 5.4. South Korea
- 5.5. ASEAN
- 5.6. Oceania
- 5.7. Rest of Asia Pacific
US Advanced Composites Industry Regional Market Share
Geographic Coverage of US Advanced Composites Industry
US Advanced Composites Industry REPORT HIGHLIGHTS
| Aspects | Details |
|---|---|
| Study Period | 2020-2034 |
| Base Year | 2025 |
| Estimated Year | 2026 |
| Forecast Period | 2026-2034 |
| Historical Period | 2020-2025 |
| Growth Rate | CAGR of 8.9% from 2020-2034 |
| Segmentation |
|
Table of Contents
- 1. Introduction
- 1.1. Research Scope
- 1.2. Market Segmentation
- 1.3. Research Objective
- 1.4. Definitions and Assumptions
- 2. Executive Summary
- 2.1. Market Snapshot
- 3. Market Dynamics
- 3.1. Market Drivers
- 3.2. Market Restrains
- 3.3. Market Trends
- 3.4. Market Opportunities
- 4. Market Factor Analysis
- 4.1. Porters Five Forces
- 4.1.1. Bargaining Power of Suppliers
- 4.1.2. Bargaining Power of Buyers
- 4.1.3. Threat of New Entrants
- 4.1.4. Threat of Substitutes
- 4.1.5. Competitive Rivalry
- 4.2. PESTEL analysis
- 4.3. BCG Analysis
- 4.3.1. Stars (High Growth, High Market Share)
- 4.3.2. Cash Cows (Low Growth, High Market Share)
- 4.3.3. Question Mark (High Growth, Low Market Share)
- 4.3.4. Dogs (Low Growth, Low Market Share)
- 4.4. Ansoff Matrix Analysis
- 4.5. Supply Chain Analysis
- 4.6. Regulatory Landscape
- 4.7. Current Market Potential and Opportunity Assessment (TAM–SAM–SOM Framework)
- 4.8. NRP Analyst Note
- 4.1. Porters Five Forces
- 5. Market Analysis, Insights and Forecast 2021-2033
- 5.1. Market Analysis, Insights and Forecast - by Productino Type
- 5.1.1. Hand Layup
- 5.1.2. Resin Transfer Molding
- 5.1.3. Vacuum Infusion Processing
- 5.1.4. Injection Molding
- 5.1.5. Compression Molding
- 5.2. Market Analysis, Insights and Forecast - by Material Type
- 5.2.1. Thermoset Polymer
- 5.2.2. Thermoplastic Polymer
- 5.2.3. Carbon Fiber
- 5.2.4. Glass Fiber
- 5.2.5. Others
- 5.3. Market Analysis, Insights and Forecast - by Application Type
- 5.3.1. Structural Assembly
- 5.3.2. Power Train Components
- 5.3.3. Interior
- 5.3.4. Exterior
- 5.3.5. Others
- 5.4. Market Analysis, Insights and Forecast - by Region
- 5.4.1. North America
- 5.4.2. South America
- 5.4.3. Europe
- 5.4.4. Middle East & Africa
- 5.4.5. Asia Pacific
- 5.1. Market Analysis, Insights and Forecast - by Productino Type
- 6. Global US Advanced Composites Industry Analysis, Insights and Forecast, 2021-2033
- 6.1. Market Analysis, Insights and Forecast - by Productino Type
- 6.1.1. Hand Layup
- 6.1.2. Resin Transfer Molding
- 6.1.3. Vacuum Infusion Processing
- 6.1.4. Injection Molding
- 6.1.5. Compression Molding
- 6.2. Market Analysis, Insights and Forecast - by Material Type
- 6.2.1. Thermoset Polymer
- 6.2.2. Thermoplastic Polymer
- 6.2.3. Carbon Fiber
- 6.2.4. Glass Fiber
- 6.2.5. Others
- 6.3. Market Analysis, Insights and Forecast - by Application Type
- 6.3.1. Structural Assembly
- 6.3.2. Power Train Components
- 6.3.3. Interior
- 6.3.4. Exterior
- 6.3.5. Others
- 6.1. Market Analysis, Insights and Forecast - by Productino Type
- 7. North America US Advanced Composites Industry Analysis, Insights and Forecast, 2020-2032
- 7.1. Market Analysis, Insights and Forecast - by Productino Type
- 7.1.1. Hand Layup
- 7.1.2. Resin Transfer Molding
- 7.1.3. Vacuum Infusion Processing
- 7.1.4. Injection Molding
- 7.1.5. Compression Molding
- 7.2. Market Analysis, Insights and Forecast - by Material Type
- 7.2.1. Thermoset Polymer
- 7.2.2. Thermoplastic Polymer
- 7.2.3. Carbon Fiber
- 7.2.4. Glass Fiber
- 7.2.5. Others
- 7.3. Market Analysis, Insights and Forecast - by Application Type
- 7.3.1. Structural Assembly
- 7.3.2. Power Train Components
- 7.3.3. Interior
- 7.3.4. Exterior
- 7.3.5. Others
- 7.1. Market Analysis, Insights and Forecast - by Productino Type
- 8. South America US Advanced Composites Industry Analysis, Insights and Forecast, 2020-2032
- 8.1. Market Analysis, Insights and Forecast - by Productino Type
- 8.1.1. Hand Layup
- 8.1.2. Resin Transfer Molding
- 8.1.3. Vacuum Infusion Processing
- 8.1.4. Injection Molding
- 8.1.5. Compression Molding
- 8.2. Market Analysis, Insights and Forecast - by Material Type
- 8.2.1. Thermoset Polymer
- 8.2.2. Thermoplastic Polymer
- 8.2.3. Carbon Fiber
- 8.2.4. Glass Fiber
- 8.2.5. Others
- 8.3. Market Analysis, Insights and Forecast - by Application Type
- 8.3.1. Structural Assembly
- 8.3.2. Power Train Components
- 8.3.3. Interior
- 8.3.4. Exterior
- 8.3.5. Others
- 8.1. Market Analysis, Insights and Forecast - by Productino Type
- 9. Europe US Advanced Composites Industry Analysis, Insights and Forecast, 2020-2032
- 9.1. Market Analysis, Insights and Forecast - by Productino Type
- 9.1.1. Hand Layup
- 9.1.2. Resin Transfer Molding
- 9.1.3. Vacuum Infusion Processing
- 9.1.4. Injection Molding
- 9.1.5. Compression Molding
- 9.2. Market Analysis, Insights and Forecast - by Material Type
- 9.2.1. Thermoset Polymer
- 9.2.2. Thermoplastic Polymer
- 9.2.3. Carbon Fiber
- 9.2.4. Glass Fiber
- 9.2.5. Others
- 9.3. Market Analysis, Insights and Forecast - by Application Type
- 9.3.1. Structural Assembly
- 9.3.2. Power Train Components
- 9.3.3. Interior
- 9.3.4. Exterior
- 9.3.5. Others
- 9.1. Market Analysis, Insights and Forecast - by Productino Type
- 10. Middle East & Africa US Advanced Composites Industry Analysis, Insights and Forecast, 2020-2032
- 10.1. Market Analysis, Insights and Forecast - by Productino Type
- 10.1.1. Hand Layup
- 10.1.2. Resin Transfer Molding
- 10.1.3. Vacuum Infusion Processing
- 10.1.4. Injection Molding
- 10.1.5. Compression Molding
- 10.2. Market Analysis, Insights and Forecast - by Material Type
- 10.2.1. Thermoset Polymer
- 10.2.2. Thermoplastic Polymer
- 10.2.3. Carbon Fiber
- 10.2.4. Glass Fiber
- 10.2.5. Others
- 10.3. Market Analysis, Insights and Forecast - by Application Type
- 10.3.1. Structural Assembly
- 10.3.2. Power Train Components
- 10.3.3. Interior
- 10.3.4. Exterior
- 10.3.5. Others
- 10.1. Market Analysis, Insights and Forecast - by Productino Type
- 11. Asia Pacific US Advanced Composites Industry Analysis, Insights and Forecast, 2020-2032
- 11.1. Market Analysis, Insights and Forecast - by Productino Type
- 11.1.1. Hand Layup
- 11.1.2. Resin Transfer Molding
- 11.1.3. Vacuum Infusion Processing
- 11.1.4. Injection Molding
- 11.1.5. Compression Molding
- 11.2. Market Analysis, Insights and Forecast - by Material Type
- 11.2.1. Thermoset Polymer
- 11.2.2. Thermoplastic Polymer
- 11.2.3. Carbon Fiber
- 11.2.4. Glass Fiber
- 11.2.5. Others
- 11.3. Market Analysis, Insights and Forecast - by Application Type
- 11.3.1. Structural Assembly
- 11.3.2. Power Train Components
- 11.3.3. Interior
- 11.3.4. Exterior
- 11.3.5. Others
- 11.1. Market Analysis, Insights and Forecast - by Productino Type
- 12. Competitive Analysis
- 12.1. Company Profiles
- 12.1.1 Nippo Sheet Glass Co Ltd
- 12.1.1.1. Company Overview
- 12.1.1.2. Products
- 12.1.1.3. Company Financials
- 12.1.1.4. SWOT Analysis
- 12.1.2 3B Fiberglass
- 12.1.2.1. Company Overview
- 12.1.2.2. Products
- 12.1.2.3. Company Financials
- 12.1.2.4. SWOT Analysis
- 12.1.3 Teijin Limite
- 12.1.3.1. Company Overview
- 12.1.3.2. Products
- 12.1.3.3. Company Financials
- 12.1.3.4. SWOT Analysis
- 12.1.4 BASF
- 12.1.4.1. Company Overview
- 12.1.4.2. Products
- 12.1.4.3. Company Financials
- 12.1.4.4. SWOT Analysis
- 12.1.5 Toray Industries Inc
- 12.1.5.1. Company Overview
- 12.1.5.2. Products
- 12.1.5.3. Company Financials
- 12.1.5.4. SWOT Analysis
- 12.1.6 General Motors Company
- 12.1.6.1. Company Overview
- 12.1.6.2. Products
- 12.1.6.3. Company Financials
- 12.1.6.4. SWOT Analysis
- 12.1.7 Base Group
- 12.1.7.1. Company Overview
- 12.1.7.2. Products
- 12.1.7.3. Company Financials
- 12.1.7.4. SWOT Analysis
- 12.1.8 Cytec Industries Inc
- 12.1.8.1. Company Overview
- 12.1.8.2. Products
- 12.1.8.3. Company Financials
- 12.1.8.4. SWOT Analysis
- 12.1.9 BMW
- 12.1.9.1. Company Overview
- 12.1.9.2. Products
- 12.1.9.3. Company Financials
- 12.1.9.4. SWOT Analysis
- 12.1.10 Delphi Auto
- 12.1.10.1. Company Overview
- 12.1.10.2. Products
- 12.1.10.3. Company Financials
- 12.1.10.4. SWOT Analysis
- 12.1.11 SGL Group
- 12.1.11.1. Company Overview
- 12.1.11.2. Products
- 12.1.11.3. Company Financials
- 12.1.11.4. SWOT Analysis
- 12.1.1 Nippo Sheet Glass Co Ltd
- 12.2. Market Entropy
- 12.2.1 Company's Key Areas Served
- 12.2.2 Recent Developments
- 12.3. Company Market Share Analysis 2025
- 12.3.1 Top 5 Companies Market Share Analysis
- 12.3.2 Top 3 Companies Market Share Analysis
- 12.4. List of Potential Customers
- 13. Research Methodology
List of Figures
- Figure 1: Global US Advanced Composites Industry Revenue Breakdown (billion, %) by Region 2025 & 2033
- Figure 2: North America US Advanced Composites Industry Revenue (billion), by Productino Type 2025 & 2033
- Figure 3: North America US Advanced Composites Industry Revenue Share (%), by Productino Type 2025 & 2033
- Figure 4: North America US Advanced Composites Industry Revenue (billion), by Material Type 2025 & 2033
- Figure 5: North America US Advanced Composites Industry Revenue Share (%), by Material Type 2025 & 2033
- Figure 6: North America US Advanced Composites Industry Revenue (billion), by Application Type 2025 & 2033
- Figure 7: North America US Advanced Composites Industry Revenue Share (%), by Application Type 2025 & 2033
- Figure 8: North America US Advanced Composites Industry Revenue (billion), by Country 2025 & 2033
- Figure 9: North America US Advanced Composites Industry Revenue Share (%), by Country 2025 & 2033
- Figure 10: South America US Advanced Composites Industry Revenue (billion), by Productino Type 2025 & 2033
- Figure 11: South America US Advanced Composites Industry Revenue Share (%), by Productino Type 2025 & 2033
- Figure 12: South America US Advanced Composites Industry Revenue (billion), by Material Type 2025 & 2033
- Figure 13: South America US Advanced Composites Industry Revenue Share (%), by Material Type 2025 & 2033
- Figure 14: South America US Advanced Composites Industry Revenue (billion), by Application Type 2025 & 2033
- Figure 15: South America US Advanced Composites Industry Revenue Share (%), by Application Type 2025 & 2033
- Figure 16: South America US Advanced Composites Industry Revenue (billion), by Country 2025 & 2033
- Figure 17: South America US Advanced Composites Industry Revenue Share (%), by Country 2025 & 2033
- Figure 18: Europe US Advanced Composites Industry Revenue (billion), by Productino Type 2025 & 2033
- Figure 19: Europe US Advanced Composites Industry Revenue Share (%), by Productino Type 2025 & 2033
- Figure 20: Europe US Advanced Composites Industry Revenue (billion), by Material Type 2025 & 2033
- Figure 21: Europe US Advanced Composites Industry Revenue Share (%), by Material Type 2025 & 2033
- Figure 22: Europe US Advanced Composites Industry Revenue (billion), by Application Type 2025 & 2033
- Figure 23: Europe US Advanced Composites Industry Revenue Share (%), by Application Type 2025 & 2033
- Figure 24: Europe US Advanced Composites Industry Revenue (billion), by Country 2025 & 2033
- Figure 25: Europe US Advanced Composites Industry Revenue Share (%), by Country 2025 & 2033
- Figure 26: Middle East & Africa US Advanced Composites Industry Revenue (billion), by Productino Type 2025 & 2033
- Figure 27: Middle East & Africa US Advanced Composites Industry Revenue Share (%), by Productino Type 2025 & 2033
- Figure 28: Middle East & Africa US Advanced Composites Industry Revenue (billion), by Material Type 2025 & 2033
- Figure 29: Middle East & Africa US Advanced Composites Industry Revenue Share (%), by Material Type 2025 & 2033
- Figure 30: Middle East & Africa US Advanced Composites Industry Revenue (billion), by Application Type 2025 & 2033
- Figure 31: Middle East & Africa US Advanced Composites Industry Revenue Share (%), by Application Type 2025 & 2033
- Figure 32: Middle East & Africa US Advanced Composites Industry Revenue (billion), by Country 2025 & 2033
- Figure 33: Middle East & Africa US Advanced Composites Industry Revenue Share (%), by Country 2025 & 2033
- Figure 34: Asia Pacific US Advanced Composites Industry Revenue (billion), by Productino Type 2025 & 2033
- Figure 35: Asia Pacific US Advanced Composites Industry Revenue Share (%), by Productino Type 2025 & 2033
- Figure 36: Asia Pacific US Advanced Composites Industry Revenue (billion), by Material Type 2025 & 2033
- Figure 37: Asia Pacific US Advanced Composites Industry Revenue Share (%), by Material Type 2025 & 2033
- Figure 38: Asia Pacific US Advanced Composites Industry Revenue (billion), by Application Type 2025 & 2033
- Figure 39: Asia Pacific US Advanced Composites Industry Revenue Share (%), by Application Type 2025 & 2033
- Figure 40: Asia Pacific US Advanced Composites Industry Revenue (billion), by Country 2025 & 2033
- Figure 41: Asia Pacific US Advanced Composites Industry Revenue Share (%), by Country 2025 & 2033
List of Tables
- Table 1: Global US Advanced Composites Industry Revenue billion Forecast, by Productino Type 2020 & 2033
- Table 2: Global US Advanced Composites Industry Revenue billion Forecast, by Material Type 2020 & 2033
- Table 3: Global US Advanced Composites Industry Revenue billion Forecast, by Application Type 2020 & 2033
- Table 4: Global US Advanced Composites Industry Revenue billion Forecast, by Region 2020 & 2033
- Table 5: Global US Advanced Composites Industry Revenue billion Forecast, by Productino Type 2020 & 2033
- Table 6: Global US Advanced Composites Industry Revenue billion Forecast, by Material Type 2020 & 2033
- Table 7: Global US Advanced Composites Industry Revenue billion Forecast, by Application Type 2020 & 2033
- Table 8: Global US Advanced Composites Industry Revenue billion Forecast, by Country 2020 & 2033
- Table 9: United States US Advanced Composites Industry Revenue (billion) Forecast, by Application 2020 & 2033
- Table 10: Canada US Advanced Composites Industry Revenue (billion) Forecast, by Application 2020 & 2033
- Table 11: Mexico US Advanced Composites Industry Revenue (billion) Forecast, by Application 2020 & 2033
- Table 12: Global US Advanced Composites Industry Revenue billion Forecast, by Productino Type 2020 & 2033
- Table 13: Global US Advanced Composites Industry Revenue billion Forecast, by Material Type 2020 & 2033
- Table 14: Global US Advanced Composites Industry Revenue billion Forecast, by Application Type 2020 & 2033
- Table 15: Global US Advanced Composites Industry Revenue billion Forecast, by Country 2020 & 2033
- Table 16: Brazil US Advanced Composites Industry Revenue (billion) Forecast, by Application 2020 & 2033
- Table 17: Argentina US Advanced Composites Industry Revenue (billion) Forecast, by Application 2020 & 2033
- Table 18: Rest of South America US Advanced Composites Industry Revenue (billion) Forecast, by Application 2020 & 2033
- Table 19: Global US Advanced Composites Industry Revenue billion Forecast, by Productino Type 2020 & 2033
- Table 20: Global US Advanced Composites Industry Revenue billion Forecast, by Material Type 2020 & 2033
- Table 21: Global US Advanced Composites Industry Revenue billion Forecast, by Application Type 2020 & 2033
- Table 22: Global US Advanced Composites Industry Revenue billion Forecast, by Country 2020 & 2033
- Table 23: United Kingdom US Advanced Composites Industry Revenue (billion) Forecast, by Application 2020 & 2033
- Table 24: Germany US Advanced Composites Industry Revenue (billion) Forecast, by Application 2020 & 2033
- Table 25: France US Advanced Composites Industry Revenue (billion) Forecast, by Application 2020 & 2033
- Table 26: Italy US Advanced Composites Industry Revenue (billion) Forecast, by Application 2020 & 2033
- Table 27: Spain US Advanced Composites Industry Revenue (billion) Forecast, by Application 2020 & 2033
- Table 28: Russia US Advanced Composites Industry Revenue (billion) Forecast, by Application 2020 & 2033
- Table 29: Benelux US Advanced Composites Industry Revenue (billion) Forecast, by Application 2020 & 2033
- Table 30: Nordics US Advanced Composites Industry Revenue (billion) Forecast, by Application 2020 & 2033
- Table 31: Rest of Europe US Advanced Composites Industry Revenue (billion) Forecast, by Application 2020 & 2033
- Table 32: Global US Advanced Composites Industry Revenue billion Forecast, by Productino Type 2020 & 2033
- Table 33: Global US Advanced Composites Industry Revenue billion Forecast, by Material Type 2020 & 2033
- Table 34: Global US Advanced Composites Industry Revenue billion Forecast, by Application Type 2020 & 2033
- Table 35: Global US Advanced Composites Industry Revenue billion Forecast, by Country 2020 & 2033
- Table 36: Turkey US Advanced Composites Industry Revenue (billion) Forecast, by Application 2020 & 2033
- Table 37: Israel US Advanced Composites Industry Revenue (billion) Forecast, by Application 2020 & 2033
- Table 38: GCC US Advanced Composites Industry Revenue (billion) Forecast, by Application 2020 & 2033
- Table 39: North Africa US Advanced Composites Industry Revenue (billion) Forecast, by Application 2020 & 2033
- Table 40: South Africa US Advanced Composites Industry Revenue (billion) Forecast, by Application 2020 & 2033
- Table 41: Rest of Middle East & Africa US Advanced Composites Industry Revenue (billion) Forecast, by Application 2020 & 2033
- Table 42: Global US Advanced Composites Industry Revenue billion Forecast, by Productino Type 2020 & 2033
- Table 43: Global US Advanced Composites Industry Revenue billion Forecast, by Material Type 2020 & 2033
- Table 44: Global US Advanced Composites Industry Revenue billion Forecast, by Application Type 2020 & 2033
- Table 45: Global US Advanced Composites Industry Revenue billion Forecast, by Country 2020 & 2033
- Table 46: China US Advanced Composites Industry Revenue (billion) Forecast, by Application 2020 & 2033
- Table 47: India US Advanced Composites Industry Revenue (billion) Forecast, by Application 2020 & 2033
- Table 48: Japan US Advanced Composites Industry Revenue (billion) Forecast, by Application 2020 & 2033
- Table 49: South Korea US Advanced Composites Industry Revenue (billion) Forecast, by Application 2020 & 2033
- Table 50: ASEAN US Advanced Composites Industry Revenue (billion) Forecast, by Application 2020 & 2033
- Table 51: Oceania US Advanced Composites Industry Revenue (billion) Forecast, by Application 2020 & 2033
- Table 52: Rest of Asia Pacific US Advanced Composites Industry Revenue (billion) Forecast, by Application 2020 & 2033
Frequently Asked Questions
1. What is the projected Compound Annual Growth Rate (CAGR) of the US Advanced Composites Industry?
The projected CAGR is approximately 8.9%.
2. Which companies are prominent players in the US Advanced Composites Industry?
Key companies in the market include Nippo Sheet Glass Co Ltd, 3B Fiberglass, Teijin Limite, BASF, Toray Industries Inc, General Motors Company, Base Group, Cytec Industries Inc, BMW, Delphi Auto, SGL Group.
3. What are the main segments of the US Advanced Composites Industry?
The market segments include Productino Type, Material Type, Application Type.
4. Can you provide details about the market size?
The market size is estimated to be USD 52.4 billion as of 2022.
5. What are some drivers contributing to market growth?
4.; Increasing demand from automobile industry4.; Increased focus on precision products.
6. What are the notable trends driving market growth?
Growing Demand for Lightweight Materials.
7. Are there any restraints impacting market growth?
4.; The cost of production and transportation4.; Regulations and quality standards.
8. Can you provide examples of recent developments in the market?
N/A
9. What pricing options are available for accessing the report?
Pricing options include single-user, multi-user, and enterprise licenses priced at USD 3800, USD 4500, and USD 5800 respectively.
10. Is the market size provided in terms of value or volume?
The market size is provided in terms of value, measured in billion.
11. Are there any specific market keywords associated with the report?
Yes, the market keyword associated with the report is "US Advanced Composites Industry," which aids in identifying and referencing the specific market segment covered.
12. How do I determine which pricing option suits my needs best?
The pricing options vary based on user requirements and access needs. Individual users may opt for single-user licenses, while businesses requiring broader access may choose multi-user or enterprise licenses for cost-effective access to the report.
13. Are there any additional resources or data provided in the US Advanced Composites Industry report?
While the report offers comprehensive insights, it's advisable to review the specific contents or supplementary materials provided to ascertain if additional resources or data are available.
14. How can I stay updated on further developments or reports in the US Advanced Composites Industry?
To stay informed about further developments, trends, and reports in the US Advanced Composites Industry, consider subscribing to industry newsletters, following relevant companies and organizations, or regularly checking reputable industry news sources and publications.
Methodology
Step 1 - Identification of Relevant Samples Size from Population Database


Step 2 - Approaches for Defining Global Market Size (Value, Volume* & Price*)

Note*: In applicable scenarios
Step 3 - Data Sources
Primary Research
- Web Analytics
- Survey Reports
- Research Institute
- Latest Research Reports
- Opinion Leaders
Secondary Research
- Annual Reports
- White Paper
- Latest Press Release
- Industry Association
- Paid Database
- Investor Presentations

Step 4 - Data Triangulation
Involves using different sources of information in order to increase the validity of a study
These sources are likely to be stakeholders in a program - participants, other researchers, program staff, other community members, and so on.
Then we put all data in single framework & apply various statistical tools to find out the dynamic on the market.
During the analysis stage, feedback from the stakeholder groups would be compared to determine areas of agreement as well as areas of divergence