

Key Insights
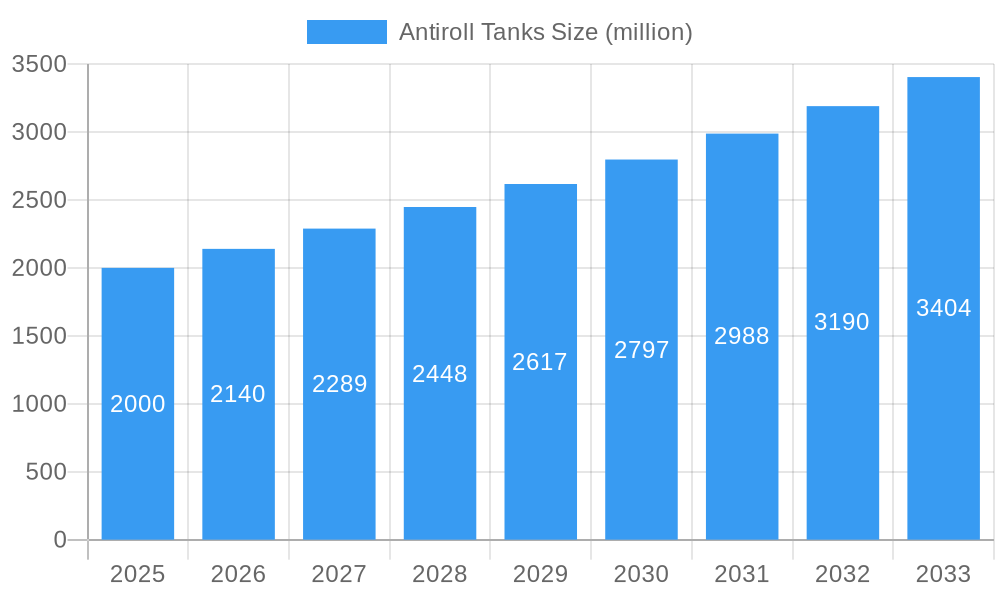
The global anti-roll tank market is experiencing robust growth, driven by increasing demand for enhanced stability and safety in marine vessels across various segments. The market, estimated at $2 billion in 2025, is projected to exhibit a Compound Annual Growth Rate (CAGR) of 7% from 2025 to 2033, reaching an estimated $3.5 billion by 2033. This growth is fueled by several key factors. The rising adoption of larger and more sophisticated vessels in the shipping industry, coupled with stringent safety regulations, necessitates the implementation of effective stabilization systems like anti-roll tanks. Furthermore, the growing focus on passenger comfort in cruise liners and ferries is driving demand for advanced anti-roll technologies. Technological advancements, such as improved tank design and control systems leading to better efficiency and reduced fuel consumption, are also contributing significantly to market expansion. Key players like Wärtsilä, Kongsberg Maritime, and others are actively involved in R&D, leading to innovative solutions that cater to diverse vessel types and operational needs.
Antiroll Tanks Market Size (In Billion)
However, certain restraints impede market growth. High initial investment costs associated with the installation and maintenance of anti-roll tanks can be a barrier for smaller vessel operators. Furthermore, the availability of alternative stabilization technologies, such as fin stabilizers and gyroscopic stabilizers, presents competition. Nevertheless, the long-term benefits of enhanced stability, safety, and fuel efficiency are expected to outweigh these challenges, ensuring continued market growth in the forecast period. The market segmentation is diverse, encompassing various vessel types (e.g., container ships, cruise liners, tankers), which further contributes to its dynamism. Regional market analysis indicates strong growth in Asia-Pacific due to expanding shipbuilding activities and increasing maritime trade.
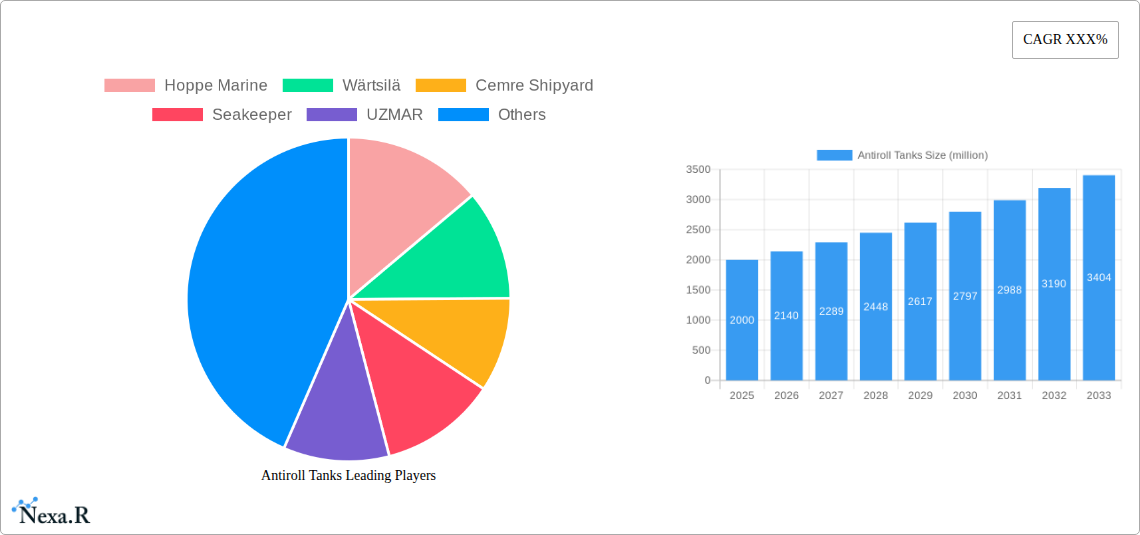
Antiroll Tanks Company Market Share
Antiroll Tanks Market Report: 2019-2033 Forecast
This comprehensive report provides a detailed analysis of the global antiroll tanks market, encompassing market dynamics, growth trends, regional segmentation, product landscape, key players, and future outlook. The study period covers 2019-2033, with 2025 serving as the base and estimated year. The forecast period is 2025-2033, and the historical period is 2019-2024. This report is invaluable for industry professionals, investors, and strategic decision-makers seeking a deep understanding of this dynamic market. The report projects a market size of xx million units by 2033.
Antiroll Tanks Market Dynamics & Structure
This section analyzes the competitive landscape of the antiroll tanks market, examining market concentration, technological innovation, regulatory influences, substitute products, and end-user demographics. The analysis incorporates both qualitative and quantitative insights, including market share percentages and M&A deal volumes. The global antiroll tank market is characterized by a moderately concentrated structure, with a few major players holding significant market share. The market's growth is driven by technological advancements in tank design and materials, increasing demand from the shipbuilding and offshore industries (parent market), and stricter regulations regarding ship stability and safety.
- Market Concentration: The top 5 players account for approximately 45% of the global market share in 2025.
- Technological Innovation: Advancements in materials science and computational fluid dynamics are leading to more efficient and effective antiroll tank designs.
- Regulatory Framework: International Maritime Organization (IMO) regulations concerning ship stability significantly influence the demand for antiroll tanks.
- Competitive Substitutes: Gyroscopic stabilizers and active fin stabilizers are key competitive substitutes, though antiroll tanks maintain a cost advantage in certain applications.
- End-User Demographics: The primary end-users are commercial shipping companies (child market), naval forces, and offshore oil and gas platforms.
- M&A Trends: Over the historical period, the number of M&A deals in the antiroll tank sector averaged xx per year, indicating a moderate level of consolidation.
Antiroll Tanks Growth Trends & Insights
Leveraging extensive primary and secondary research, this section details the evolution of the antiroll tanks market size, adoption rates, technological disruptions, and shifts in consumer behavior. The market witnessed a compound annual growth rate (CAGR) of xx% during the historical period (2019-2024). This growth is primarily attributed to increased global shipping activities, stricter safety regulations, and technological advancements in antiroll tank designs. The forecast period anticipates continued growth, driven by expanding global trade and a rising demand for enhanced vessel stability across various maritime sectors. Market penetration within the global fleet remains relatively low, indicating significant growth potential. Technological innovations, such as smart antiroll tank systems with integrated monitoring and control, are expected to accelerate market adoption rates in the coming years.
Dominant Regions, Countries, or Segments in Antiroll Tanks
This section identifies the leading regions and segments driving market growth. Asia-Pacific currently dominates the market, largely due to robust shipbuilding activities in countries like China, South Korea, and Japan. The growth in this region is primarily propelled by increasing investments in infrastructure development and expansion of the maritime trade.
- Key Drivers in Asia-Pacific:
- High shipbuilding capacity.
- Growing demand from regional shipping companies.
- Government support for maritime infrastructure development.
- Dominance Factors:
- Large market share (xx% in 2025).
- High growth potential due to expanding trade activities.
- Favorable government policies.
Antiroll Tanks Product Landscape
Antiroll tank designs have evolved significantly, incorporating advanced materials and sophisticated control systems. Modern antiroll tanks often feature optimized geometries for enhanced performance, and integrated sensors for real-time monitoring of tank behavior. This results in improved stability, reduced roll motion, and enhanced cargo protection. Unique selling propositions include increased efficiency, reduced maintenance costs, and improved integration with other ship systems.
Key Drivers, Barriers & Challenges in Antiroll Tanks
Key Drivers: Increasing demand for safer and more stable vessels, stringent international maritime regulations, and advancements in tank design and materials are key drivers. Growing global trade and the expansion of offshore activities also play crucial roles.
Key Challenges & Restraints: High initial investment costs, complexities associated with installation and maintenance, and competition from alternative stabilization technologies pose significant challenges. Supply chain disruptions, particularly in the procurement of specialized materials, can also impact market growth. Furthermore, regulatory compliance requirements may present challenges for smaller players. The estimated impact of supply chain issues on market growth is a reduction of xx million units in 2025.
Emerging Opportunities in Antiroll Tanks
Emerging opportunities include the development of lightweight, high-performance antiroll tanks for smaller vessels. Integration with smart ship systems and the use of advanced materials offer significant potential. Furthermore, expansion into emerging markets with growing maritime industries presents considerable opportunities. Untapped markets exist in developing economies with expanding shipping sectors.
Growth Accelerators in the Antiroll Tanks Industry
Technological advancements, strategic partnerships between tank manufacturers and shipbuilders, and increasing awareness of the importance of vessel stability are key catalysts for long-term growth. Market expansion into new geographical regions and development of innovative tank designs will further contribute to market acceleration.
Key Players Shaping the Antiroll Tanks Market
- Hoppe Marine
- Wärtsilä
- Cemre Shipyard
- Seakeeper
- UZMAR
- Brown Brothers (Vickers PLC)
- Kongsberg Maritime
- JFE
- Niron Staal
- CSIC
- Seastel
- Wuxi MNET
Notable Milestones in Antiroll Tanks Sector
- 2020: Introduction of a new lightweight antiroll tank design by Hoppe Marine.
- 2022: Wärtsilä announced a strategic partnership with a major shipyard for the supply of advanced antiroll tanks.
- 2023: New IMO regulations regarding vessel stability came into effect, stimulating demand for antiroll tanks.
In-Depth Antiroll Tanks Market Outlook
The future of the antiroll tanks market is promising, driven by continued growth in global shipping, technological advancements leading to more efficient and effective systems, and the increasing adoption of stricter safety regulations. Strategic partnerships, expansion into new markets, and innovations in materials and design will shape the market landscape. The projected CAGR for 2025-2033 is xx%, signifying substantial market expansion and presenting attractive opportunities for key players.
Antiroll Tanks Segmentation
-
1. Application
- 1.1. Recreational Ship
- 1.2. Commercial Vessel
- 1.3. Others
-
2. Type
- 2.1. Passive Antiroll Tanks
- 2.2. Active Antiroll Tanks
Antiroll Tanks Segmentation By Geography
-
1. North America
- 1.1. United States
- 1.2. Canada
- 1.3. Mexico
-
2. South America
- 2.1. Brazil
- 2.2. Argentina
- 2.3. Rest of South America
-
3. Europe
- 3.1. United Kingdom
- 3.2. Germany
- 3.3. France
- 3.4. Italy
- 3.5. Spain
- 3.6. Russia
- 3.7. Benelux
- 3.8. Nordics
- 3.9. Rest of Europe
-
4. Middle East & Africa
- 4.1. Turkey
- 4.2. Israel
- 4.3. GCC
- 4.4. North Africa
- 4.5. South Africa
- 4.6. Rest of Middle East & Africa
-
5. Asia Pacific
- 5.1. China
- 5.2. India
- 5.3. Japan
- 5.4. South Korea
- 5.5. ASEAN
- 5.6. Oceania
- 5.7. Rest of Asia Pacific
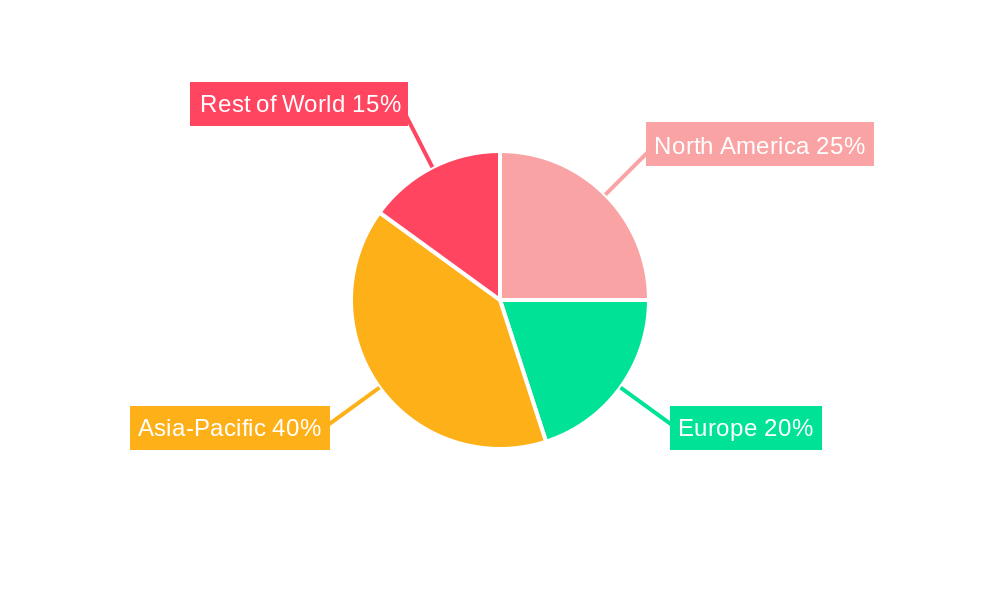
Antiroll Tanks Regional Market Share
Geographic Coverage of Antiroll Tanks
Antiroll Tanks REPORT HIGHLIGHTS
| Aspects | Details |
|---|---|
| Study Period | 2020-2034 |
| Base Year | 2025 |
| Estimated Year | 2026 |
| Forecast Period | 2026-2034 |
| Historical Period | 2020-2025 |
| Growth Rate | CAGR of XXX% from 2020-2034 |
| Segmentation |
|
Table of Contents
- 1. Introduction
- 1.1. Research Scope
- 1.2. Market Segmentation
- 1.3. Research Methodology
- 1.4. Definitions and Assumptions
- 2. Executive Summary
- 2.1. Introduction
- 3. Market Dynamics
- 3.1. Introduction
- 3.2. Market Drivers
- 3.3. Market Restrains
- 3.4. Market Trends
- 4. Market Factor Analysis
- 4.1. Porters Five Forces
- 4.2. Supply/Value Chain
- 4.3. PESTEL analysis
- 4.4. Market Entropy
- 4.5. Patent/Trademark Analysis
- 5. Global Antiroll Tanks Analysis, Insights and Forecast, 2020-2032
- 5.1. Market Analysis, Insights and Forecast - by Application
- 5.1.1. Recreational Ship
- 5.1.2. Commercial Vessel
- 5.1.3. Others
- 5.2. Market Analysis, Insights and Forecast - by Type
- 5.2.1. Passive Antiroll Tanks
- 5.2.2. Active Antiroll Tanks
- 5.3. Market Analysis, Insights and Forecast - by Region
- 5.3.1. North America
- 5.3.2. South America
- 5.3.3. Europe
- 5.3.4. Middle East & Africa
- 5.3.5. Asia Pacific
- 5.1. Market Analysis, Insights and Forecast - by Application
- 6. North America Antiroll Tanks Analysis, Insights and Forecast, 2020-2032
- 6.1. Market Analysis, Insights and Forecast - by Application
- 6.1.1. Recreational Ship
- 6.1.2. Commercial Vessel
- 6.1.3. Others
- 6.2. Market Analysis, Insights and Forecast - by Type
- 6.2.1. Passive Antiroll Tanks
- 6.2.2. Active Antiroll Tanks
- 6.1. Market Analysis, Insights and Forecast - by Application
- 7. South America Antiroll Tanks Analysis, Insights and Forecast, 2020-2032
- 7.1. Market Analysis, Insights and Forecast - by Application
- 7.1.1. Recreational Ship
- 7.1.2. Commercial Vessel
- 7.1.3. Others
- 7.2. Market Analysis, Insights and Forecast - by Type
- 7.2.1. Passive Antiroll Tanks
- 7.2.2. Active Antiroll Tanks
- 7.1. Market Analysis, Insights and Forecast - by Application
- 8. Europe Antiroll Tanks Analysis, Insights and Forecast, 2020-2032
- 8.1. Market Analysis, Insights and Forecast - by Application
- 8.1.1. Recreational Ship
- 8.1.2. Commercial Vessel
- 8.1.3. Others
- 8.2. Market Analysis, Insights and Forecast - by Type
- 8.2.1. Passive Antiroll Tanks
- 8.2.2. Active Antiroll Tanks
- 8.1. Market Analysis, Insights and Forecast - by Application
- 9. Middle East & Africa Antiroll Tanks Analysis, Insights and Forecast, 2020-2032
- 9.1. Market Analysis, Insights and Forecast - by Application
- 9.1.1. Recreational Ship
- 9.1.2. Commercial Vessel
- 9.1.3. Others
- 9.2. Market Analysis, Insights and Forecast - by Type
- 9.2.1. Passive Antiroll Tanks
- 9.2.2. Active Antiroll Tanks
- 9.1. Market Analysis, Insights and Forecast - by Application
- 10. Asia Pacific Antiroll Tanks Analysis, Insights and Forecast, 2020-2032
- 10.1. Market Analysis, Insights and Forecast - by Application
- 10.1.1. Recreational Ship
- 10.1.2. Commercial Vessel
- 10.1.3. Others
- 10.2. Market Analysis, Insights and Forecast - by Type
- 10.2.1. Passive Antiroll Tanks
- 10.2.2. Active Antiroll Tanks
- 10.1. Market Analysis, Insights and Forecast - by Application
- 11. Competitive Analysis
- 11.1. Global Market Share Analysis 2025
- 11.2. Company Profiles
- 11.2.1 Hoppe Marine
- 11.2.1.1. Overview
- 11.2.1.2. Products
- 11.2.1.3. SWOT Analysis
- 11.2.1.4. Recent Developments
- 11.2.1.5. Financials (Based on Availability)
- 11.2.2 Wärtsilä
- 11.2.2.1. Overview
- 11.2.2.2. Products
- 11.2.2.3. SWOT Analysis
- 11.2.2.4. Recent Developments
- 11.2.2.5. Financials (Based on Availability)
- 11.2.3 Cemre Shipyard
- 11.2.3.1. Overview
- 11.2.3.2. Products
- 11.2.3.3. SWOT Analysis
- 11.2.3.4. Recent Developments
- 11.2.3.5. Financials (Based on Availability)
- 11.2.4 Seakeeper
- 11.2.4.1. Overview
- 11.2.4.2. Products
- 11.2.4.3. SWOT Analysis
- 11.2.4.4. Recent Developments
- 11.2.4.5. Financials (Based on Availability)
- 11.2.5 UZMAR
- 11.2.5.1. Overview
- 11.2.5.2. Products
- 11.2.5.3. SWOT Analysis
- 11.2.5.4. Recent Developments
- 11.2.5.5. Financials (Based on Availability)
- 11.2.6 Brown Brothers (Vickers PLC)
- 11.2.6.1. Overview
- 11.2.6.2. Products
- 11.2.6.3. SWOT Analysis
- 11.2.6.4. Recent Developments
- 11.2.6.5. Financials (Based on Availability)
- 11.2.7 Kongsberg Maritime
- 11.2.7.1. Overview
- 11.2.7.2. Products
- 11.2.7.3. SWOT Analysis
- 11.2.7.4. Recent Developments
- 11.2.7.5. Financials (Based on Availability)
- 11.2.8 JFE
- 11.2.8.1. Overview
- 11.2.8.2. Products
- 11.2.8.3. SWOT Analysis
- 11.2.8.4. Recent Developments
- 11.2.8.5. Financials (Based on Availability)
- 11.2.9 Niron Staal
- 11.2.9.1. Overview
- 11.2.9.2. Products
- 11.2.9.3. SWOT Analysis
- 11.2.9.4. Recent Developments
- 11.2.9.5. Financials (Based on Availability)
- 11.2.10 CSIC
- 11.2.10.1. Overview
- 11.2.10.2. Products
- 11.2.10.3. SWOT Analysis
- 11.2.10.4. Recent Developments
- 11.2.10.5. Financials (Based on Availability)
- 11.2.11 Seastel
- 11.2.11.1. Overview
- 11.2.11.2. Products
- 11.2.11.3. SWOT Analysis
- 11.2.11.4. Recent Developments
- 11.2.11.5. Financials (Based on Availability)
- 11.2.12 Wuxi MNET
- 11.2.12.1. Overview
- 11.2.12.2. Products
- 11.2.12.3. SWOT Analysis
- 11.2.12.4. Recent Developments
- 11.2.12.5. Financials (Based on Availability)
- 11.2.1 Hoppe Marine
List of Figures
- Figure 1: Global Antiroll Tanks Revenue Breakdown (million, %) by Region 2025 & 2033
- Figure 2: Global Antiroll Tanks Volume Breakdown (K, %) by Region 2025 & 2033
- Figure 3: North America Antiroll Tanks Revenue (million), by Application 2025 & 2033
- Figure 4: North America Antiroll Tanks Volume (K), by Application 2025 & 2033
- Figure 5: North America Antiroll Tanks Revenue Share (%), by Application 2025 & 2033
- Figure 6: North America Antiroll Tanks Volume Share (%), by Application 2025 & 2033
- Figure 7: North America Antiroll Tanks Revenue (million), by Type 2025 & 2033
- Figure 8: North America Antiroll Tanks Volume (K), by Type 2025 & 2033
- Figure 9: North America Antiroll Tanks Revenue Share (%), by Type 2025 & 2033
- Figure 10: North America Antiroll Tanks Volume Share (%), by Type 2025 & 2033
- Figure 11: North America Antiroll Tanks Revenue (million), by Country 2025 & 2033
- Figure 12: North America Antiroll Tanks Volume (K), by Country 2025 & 2033
- Figure 13: North America Antiroll Tanks Revenue Share (%), by Country 2025 & 2033
- Figure 14: North America Antiroll Tanks Volume Share (%), by Country 2025 & 2033
- Figure 15: South America Antiroll Tanks Revenue (million), by Application 2025 & 2033
- Figure 16: South America Antiroll Tanks Volume (K), by Application 2025 & 2033
- Figure 17: South America Antiroll Tanks Revenue Share (%), by Application 2025 & 2033
- Figure 18: South America Antiroll Tanks Volume Share (%), by Application 2025 & 2033
- Figure 19: South America Antiroll Tanks Revenue (million), by Type 2025 & 2033
- Figure 20: South America Antiroll Tanks Volume (K), by Type 2025 & 2033
- Figure 21: South America Antiroll Tanks Revenue Share (%), by Type 2025 & 2033
- Figure 22: South America Antiroll Tanks Volume Share (%), by Type 2025 & 2033
- Figure 23: South America Antiroll Tanks Revenue (million), by Country 2025 & 2033
- Figure 24: South America Antiroll Tanks Volume (K), by Country 2025 & 2033
- Figure 25: South America Antiroll Tanks Revenue Share (%), by Country 2025 & 2033
- Figure 26: South America Antiroll Tanks Volume Share (%), by Country 2025 & 2033
- Figure 27: Europe Antiroll Tanks Revenue (million), by Application 2025 & 2033
- Figure 28: Europe Antiroll Tanks Volume (K), by Application 2025 & 2033
- Figure 29: Europe Antiroll Tanks Revenue Share (%), by Application 2025 & 2033
- Figure 30: Europe Antiroll Tanks Volume Share (%), by Application 2025 & 2033
- Figure 31: Europe Antiroll Tanks Revenue (million), by Type 2025 & 2033
- Figure 32: Europe Antiroll Tanks Volume (K), by Type 2025 & 2033
- Figure 33: Europe Antiroll Tanks Revenue Share (%), by Type 2025 & 2033
- Figure 34: Europe Antiroll Tanks Volume Share (%), by Type 2025 & 2033
- Figure 35: Europe Antiroll Tanks Revenue (million), by Country 2025 & 2033
- Figure 36: Europe Antiroll Tanks Volume (K), by Country 2025 & 2033
- Figure 37: Europe Antiroll Tanks Revenue Share (%), by Country 2025 & 2033
- Figure 38: Europe Antiroll Tanks Volume Share (%), by Country 2025 & 2033
- Figure 39: Middle East & Africa Antiroll Tanks Revenue (million), by Application 2025 & 2033
- Figure 40: Middle East & Africa Antiroll Tanks Volume (K), by Application 2025 & 2033
- Figure 41: Middle East & Africa Antiroll Tanks Revenue Share (%), by Application 2025 & 2033
- Figure 42: Middle East & Africa Antiroll Tanks Volume Share (%), by Application 2025 & 2033
- Figure 43: Middle East & Africa Antiroll Tanks Revenue (million), by Type 2025 & 2033
- Figure 44: Middle East & Africa Antiroll Tanks Volume (K), by Type 2025 & 2033
- Figure 45: Middle East & Africa Antiroll Tanks Revenue Share (%), by Type 2025 & 2033
- Figure 46: Middle East & Africa Antiroll Tanks Volume Share (%), by Type 2025 & 2033
- Figure 47: Middle East & Africa Antiroll Tanks Revenue (million), by Country 2025 & 2033
- Figure 48: Middle East & Africa Antiroll Tanks Volume (K), by Country 2025 & 2033
- Figure 49: Middle East & Africa Antiroll Tanks Revenue Share (%), by Country 2025 & 2033
- Figure 50: Middle East & Africa Antiroll Tanks Volume Share (%), by Country 2025 & 2033
- Figure 51: Asia Pacific Antiroll Tanks Revenue (million), by Application 2025 & 2033
- Figure 52: Asia Pacific Antiroll Tanks Volume (K), by Application 2025 & 2033
- Figure 53: Asia Pacific Antiroll Tanks Revenue Share (%), by Application 2025 & 2033
- Figure 54: Asia Pacific Antiroll Tanks Volume Share (%), by Application 2025 & 2033
- Figure 55: Asia Pacific Antiroll Tanks Revenue (million), by Type 2025 & 2033
- Figure 56: Asia Pacific Antiroll Tanks Volume (K), by Type 2025 & 2033
- Figure 57: Asia Pacific Antiroll Tanks Revenue Share (%), by Type 2025 & 2033
- Figure 58: Asia Pacific Antiroll Tanks Volume Share (%), by Type 2025 & 2033
- Figure 59: Asia Pacific Antiroll Tanks Revenue (million), by Country 2025 & 2033
- Figure 60: Asia Pacific Antiroll Tanks Volume (K), by Country 2025 & 2033
- Figure 61: Asia Pacific Antiroll Tanks Revenue Share (%), by Country 2025 & 2033
- Figure 62: Asia Pacific Antiroll Tanks Volume Share (%), by Country 2025 & 2033
List of Tables
- Table 1: Global Antiroll Tanks Revenue million Forecast, by Application 2020 & 2033
- Table 2: Global Antiroll Tanks Volume K Forecast, by Application 2020 & 2033
- Table 3: Global Antiroll Tanks Revenue million Forecast, by Type 2020 & 2033
- Table 4: Global Antiroll Tanks Volume K Forecast, by Type 2020 & 2033
- Table 5: Global Antiroll Tanks Revenue million Forecast, by Region 2020 & 2033
- Table 6: Global Antiroll Tanks Volume K Forecast, by Region 2020 & 2033
- Table 7: Global Antiroll Tanks Revenue million Forecast, by Application 2020 & 2033
- Table 8: Global Antiroll Tanks Volume K Forecast, by Application 2020 & 2033
- Table 9: Global Antiroll Tanks Revenue million Forecast, by Type 2020 & 2033
- Table 10: Global Antiroll Tanks Volume K Forecast, by Type 2020 & 2033
- Table 11: Global Antiroll Tanks Revenue million Forecast, by Country 2020 & 2033
- Table 12: Global Antiroll Tanks Volume K Forecast, by Country 2020 & 2033
- Table 13: United States Antiroll Tanks Revenue (million) Forecast, by Application 2020 & 2033
- Table 14: United States Antiroll Tanks Volume (K) Forecast, by Application 2020 & 2033
- Table 15: Canada Antiroll Tanks Revenue (million) Forecast, by Application 2020 & 2033
- Table 16: Canada Antiroll Tanks Volume (K) Forecast, by Application 2020 & 2033
- Table 17: Mexico Antiroll Tanks Revenue (million) Forecast, by Application 2020 & 2033
- Table 18: Mexico Antiroll Tanks Volume (K) Forecast, by Application 2020 & 2033
- Table 19: Global Antiroll Tanks Revenue million Forecast, by Application 2020 & 2033
- Table 20: Global Antiroll Tanks Volume K Forecast, by Application 2020 & 2033
- Table 21: Global Antiroll Tanks Revenue million Forecast, by Type 2020 & 2033
- Table 22: Global Antiroll Tanks Volume K Forecast, by Type 2020 & 2033
- Table 23: Global Antiroll Tanks Revenue million Forecast, by Country 2020 & 2033
- Table 24: Global Antiroll Tanks Volume K Forecast, by Country 2020 & 2033
- Table 25: Brazil Antiroll Tanks Revenue (million) Forecast, by Application 2020 & 2033
- Table 26: Brazil Antiroll Tanks Volume (K) Forecast, by Application 2020 & 2033
- Table 27: Argentina Antiroll Tanks Revenue (million) Forecast, by Application 2020 & 2033
- Table 28: Argentina Antiroll Tanks Volume (K) Forecast, by Application 2020 & 2033
- Table 29: Rest of South America Antiroll Tanks Revenue (million) Forecast, by Application 2020 & 2033
- Table 30: Rest of South America Antiroll Tanks Volume (K) Forecast, by Application 2020 & 2033
- Table 31: Global Antiroll Tanks Revenue million Forecast, by Application 2020 & 2033
- Table 32: Global Antiroll Tanks Volume K Forecast, by Application 2020 & 2033
- Table 33: Global Antiroll Tanks Revenue million Forecast, by Type 2020 & 2033
- Table 34: Global Antiroll Tanks Volume K Forecast, by Type 2020 & 2033
- Table 35: Global Antiroll Tanks Revenue million Forecast, by Country 2020 & 2033
- Table 36: Global Antiroll Tanks Volume K Forecast, by Country 2020 & 2033
- Table 37: United Kingdom Antiroll Tanks Revenue (million) Forecast, by Application 2020 & 2033
- Table 38: United Kingdom Antiroll Tanks Volume (K) Forecast, by Application 2020 & 2033
- Table 39: Germany Antiroll Tanks Revenue (million) Forecast, by Application 2020 & 2033
- Table 40: Germany Antiroll Tanks Volume (K) Forecast, by Application 2020 & 2033
- Table 41: France Antiroll Tanks Revenue (million) Forecast, by Application 2020 & 2033
- Table 42: France Antiroll Tanks Volume (K) Forecast, by Application 2020 & 2033
- Table 43: Italy Antiroll Tanks Revenue (million) Forecast, by Application 2020 & 2033
- Table 44: Italy Antiroll Tanks Volume (K) Forecast, by Application 2020 & 2033
- Table 45: Spain Antiroll Tanks Revenue (million) Forecast, by Application 2020 & 2033
- Table 46: Spain Antiroll Tanks Volume (K) Forecast, by Application 2020 & 2033
- Table 47: Russia Antiroll Tanks Revenue (million) Forecast, by Application 2020 & 2033
- Table 48: Russia Antiroll Tanks Volume (K) Forecast, by Application 2020 & 2033
- Table 49: Benelux Antiroll Tanks Revenue (million) Forecast, by Application 2020 & 2033
- Table 50: Benelux Antiroll Tanks Volume (K) Forecast, by Application 2020 & 2033
- Table 51: Nordics Antiroll Tanks Revenue (million) Forecast, by Application 2020 & 2033
- Table 52: Nordics Antiroll Tanks Volume (K) Forecast, by Application 2020 & 2033
- Table 53: Rest of Europe Antiroll Tanks Revenue (million) Forecast, by Application 2020 & 2033
- Table 54: Rest of Europe Antiroll Tanks Volume (K) Forecast, by Application 2020 & 2033
- Table 55: Global Antiroll Tanks Revenue million Forecast, by Application 2020 & 2033
- Table 56: Global Antiroll Tanks Volume K Forecast, by Application 2020 & 2033
- Table 57: Global Antiroll Tanks Revenue million Forecast, by Type 2020 & 2033
- Table 58: Global Antiroll Tanks Volume K Forecast, by Type 2020 & 2033
- Table 59: Global Antiroll Tanks Revenue million Forecast, by Country 2020 & 2033
- Table 60: Global Antiroll Tanks Volume K Forecast, by Country 2020 & 2033
- Table 61: Turkey Antiroll Tanks Revenue (million) Forecast, by Application 2020 & 2033
- Table 62: Turkey Antiroll Tanks Volume (K) Forecast, by Application 2020 & 2033
- Table 63: Israel Antiroll Tanks Revenue (million) Forecast, by Application 2020 & 2033
- Table 64: Israel Antiroll Tanks Volume (K) Forecast, by Application 2020 & 2033
- Table 65: GCC Antiroll Tanks Revenue (million) Forecast, by Application 2020 & 2033
- Table 66: GCC Antiroll Tanks Volume (K) Forecast, by Application 2020 & 2033
- Table 67: North Africa Antiroll Tanks Revenue (million) Forecast, by Application 2020 & 2033
- Table 68: North Africa Antiroll Tanks Volume (K) Forecast, by Application 2020 & 2033
- Table 69: South Africa Antiroll Tanks Revenue (million) Forecast, by Application 2020 & 2033
- Table 70: South Africa Antiroll Tanks Volume (K) Forecast, by Application 2020 & 2033
- Table 71: Rest of Middle East & Africa Antiroll Tanks Revenue (million) Forecast, by Application 2020 & 2033
- Table 72: Rest of Middle East & Africa Antiroll Tanks Volume (K) Forecast, by Application 2020 & 2033
- Table 73: Global Antiroll Tanks Revenue million Forecast, by Application 2020 & 2033
- Table 74: Global Antiroll Tanks Volume K Forecast, by Application 2020 & 2033
- Table 75: Global Antiroll Tanks Revenue million Forecast, by Type 2020 & 2033
- Table 76: Global Antiroll Tanks Volume K Forecast, by Type 2020 & 2033
- Table 77: Global Antiroll Tanks Revenue million Forecast, by Country 2020 & 2033
- Table 78: Global Antiroll Tanks Volume K Forecast, by Country 2020 & 2033
- Table 79: China Antiroll Tanks Revenue (million) Forecast, by Application 2020 & 2033
- Table 80: China Antiroll Tanks Volume (K) Forecast, by Application 2020 & 2033
- Table 81: India Antiroll Tanks Revenue (million) Forecast, by Application 2020 & 2033
- Table 82: India Antiroll Tanks Volume (K) Forecast, by Application 2020 & 2033
- Table 83: Japan Antiroll Tanks Revenue (million) Forecast, by Application 2020 & 2033
- Table 84: Japan Antiroll Tanks Volume (K) Forecast, by Application 2020 & 2033
- Table 85: South Korea Antiroll Tanks Revenue (million) Forecast, by Application 2020 & 2033
- Table 86: South Korea Antiroll Tanks Volume (K) Forecast, by Application 2020 & 2033
- Table 87: ASEAN Antiroll Tanks Revenue (million) Forecast, by Application 2020 & 2033
- Table 88: ASEAN Antiroll Tanks Volume (K) Forecast, by Application 2020 & 2033
- Table 89: Oceania Antiroll Tanks Revenue (million) Forecast, by Application 2020 & 2033
- Table 90: Oceania Antiroll Tanks Volume (K) Forecast, by Application 2020 & 2033
- Table 91: Rest of Asia Pacific Antiroll Tanks Revenue (million) Forecast, by Application 2020 & 2033
- Table 92: Rest of Asia Pacific Antiroll Tanks Volume (K) Forecast, by Application 2020 & 2033
Frequently Asked Questions
1. What is the projected Compound Annual Growth Rate (CAGR) of the Antiroll Tanks?
The projected CAGR is approximately XXX%.
2. Which companies are prominent players in the Antiroll Tanks?
Key companies in the market include Hoppe Marine, Wärtsilä, Cemre Shipyard, Seakeeper, UZMAR, Brown Brothers (Vickers PLC), Kongsberg Maritime, JFE, Niron Staal, CSIC, Seastel, Wuxi MNET.
3. What are the main segments of the Antiroll Tanks?
The market segments include Application, Type.
4. Can you provide details about the market size?
The market size is estimated to be USD XXX million as of 2022.
5. What are some drivers contributing to market growth?
N/A
6. What are the notable trends driving market growth?
N/A
7. Are there any restraints impacting market growth?
N/A
8. Can you provide examples of recent developments in the market?
N/A
9. What pricing options are available for accessing the report?
Pricing options include single-user, multi-user, and enterprise licenses priced at USD 3950.00, USD 5925.00, and USD 7900.00 respectively.
10. Is the market size provided in terms of value or volume?
The market size is provided in terms of value, measured in million and volume, measured in K.
11. Are there any specific market keywords associated with the report?
Yes, the market keyword associated with the report is "Antiroll Tanks," which aids in identifying and referencing the specific market segment covered.
12. How do I determine which pricing option suits my needs best?
The pricing options vary based on user requirements and access needs. Individual users may opt for single-user licenses, while businesses requiring broader access may choose multi-user or enterprise licenses for cost-effective access to the report.
13. Are there any additional resources or data provided in the Antiroll Tanks report?
While the report offers comprehensive insights, it's advisable to review the specific contents or supplementary materials provided to ascertain if additional resources or data are available.
14. How can I stay updated on further developments or reports in the Antiroll Tanks?
To stay informed about further developments, trends, and reports in the Antiroll Tanks, consider subscribing to industry newsletters, following relevant companies and organizations, or regularly checking reputable industry news sources and publications.
Methodology
Step 1 - Identification of Relevant Samples Size from Population Database


Step 2 - Approaches for Defining Global Market Size (Value, Volume* & Price*)

Note*: In applicable scenarios
Step 3 - Data Sources
Primary Research
- Web Analytics
- Survey Reports
- Research Institute
- Latest Research Reports
- Opinion Leaders
Secondary Research
- Annual Reports
- White Paper
- Latest Press Release
- Industry Association
- Paid Database
- Investor Presentations

Step 4 - Data Triangulation
Involves using different sources of information in order to increase the validity of a study
These sources are likely to be stakeholders in a program - participants, other researchers, program staff, other community members, and so on.
Then we put all data in single framework & apply various statistical tools to find out the dynamic on the market.
During the analysis stage, feedback from the stakeholder groups would be compared to determine areas of agreement as well as areas of divergence