

Key Insights
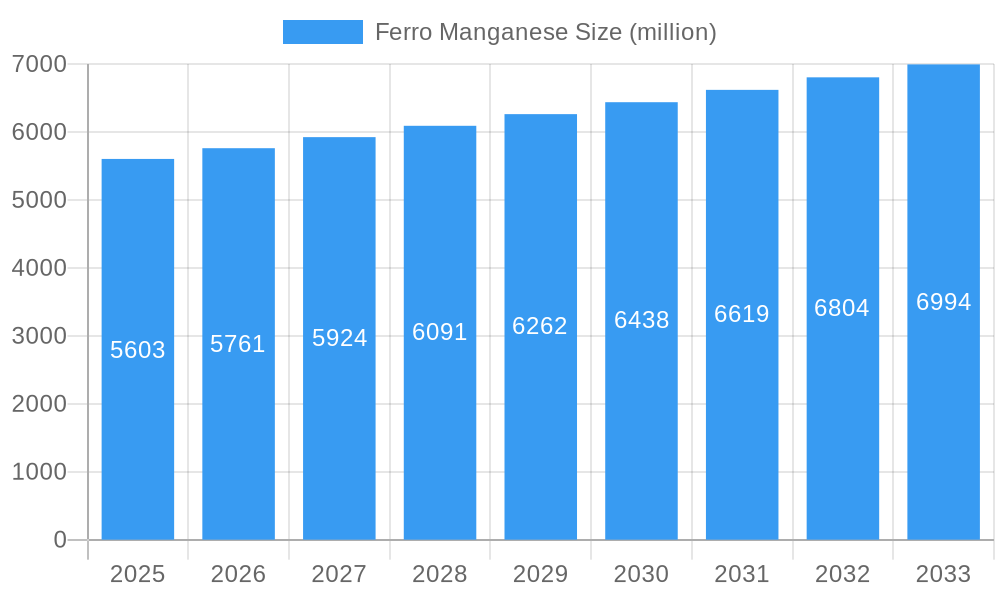
The global Ferro Manganese market is projected to reach a significant size, with an estimated market value of $5603 million in 2025. The market is expected to experience steady growth, exhibiting a Compound Annual Growth Rate (CAGR) of 2.8% during the forecast period of 2025-2033. This growth is underpinned by robust demand from key applications, primarily as a deoxidizer in steel manufacturing and as an essential alloying element additive, contributing to enhanced strength and durability of various metal alloys. The "Others" application segment also plays a crucial role, reflecting the diverse industrial uses of ferro manganese beyond its primary functions. The market is segmented by type into High Carbon, Medium Carbon, and Low Carbon ferro manganese, catering to a wide spectrum of industrial requirements and specific alloy compositions.
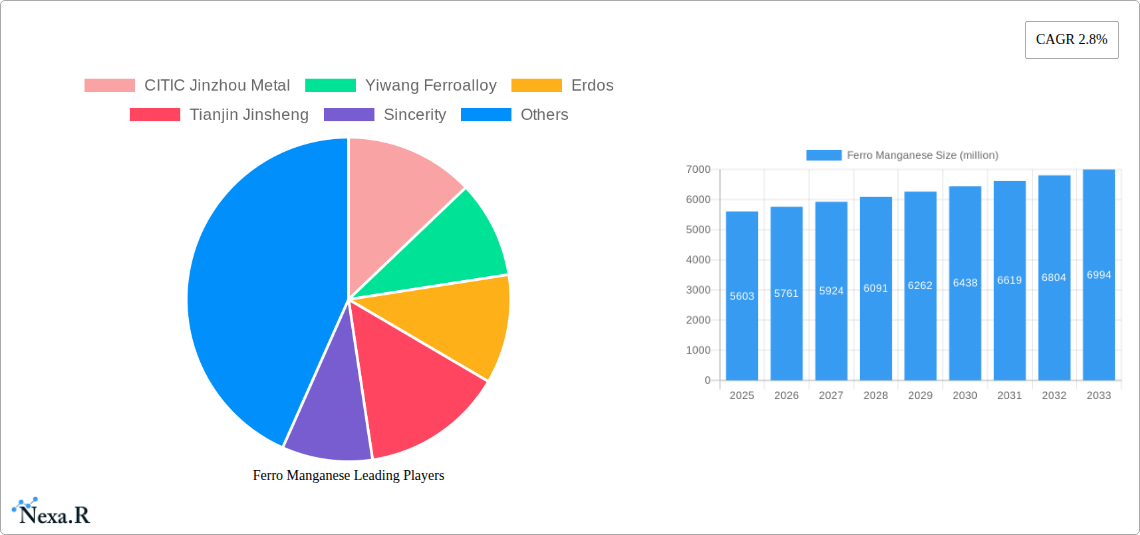
Ferro Manganese Market Size (In Billion)
The projected growth trajectory of the ferro manganese market is influenced by several key drivers. The continuous expansion of the global steel industry, a direct consumer of ferro manganese, is a primary impetus. Furthermore, the increasing demand for high-performance alloys in automotive, construction, and infrastructure projects necessitates the use of ferro manganese for its beneficial properties. Emerging economies, particularly in the Asia Pacific region, are anticipated to be significant growth engines due to rapid industrialization and infrastructure development. While the market is generally robust, potential restraints such as fluctuating raw material prices and environmental regulations related to manganese ore extraction and processing could pose challenges. However, advancements in production technologies and strategic partnerships among key players are expected to mitigate these restraints and ensure sustained market expansion. The competitive landscape features established entities like CITIC Jinzhou Metal, Glencore, and SAIL, alongside emerging players, all vying for market share through product innovation and geographical expansion.
Ferro Manganese Company Market Share
Ferro Manganese Market Outlook 2033: A Comprehensive Analysis of Global Demand, Supply, and Growth Trajectories
This in-depth report provides a definitive analysis of the global Ferro Manganese market, encompassing its intricate dynamics, growth trends, regional dominance, product landscape, and future outlook. Designed for industry professionals, investors, and strategic planners, this report offers granular insights into market segmentation, technological advancements, regulatory influences, and competitive strategies. With a study period spanning from 2019 to 2033, including a base year of 2025 and a forecast period of 2025–2033, this analysis delivers actionable intelligence for navigating the evolving ferro manganese landscape. We delve into the parent and child markets to provide a holistic view of demand and supply.
Ferro Manganese Market Dynamics & Structure
The global Ferro Manganese market exhibits a moderately concentrated structure, with a few key players dominating production and supply. Technological innovation, particularly in enhancing production efficiency and reducing environmental impact, serves as a significant driver. Regulatory frameworks, including environmental standards and trade policies, play a crucial role in shaping market access and operational costs. Competitive product substitutes, such as other manganese alloys or alternative deoxidizing agents, are present but often cannot match the cost-effectiveness and performance of ferro manganese in specific steelmaking applications. End-user demographics are primarily driven by the global steel industry's demand for high-quality steel products, influenced by construction, automotive, and infrastructure development. Mergers and Acquisitions (M&A) trends are observed as companies seek to consolidate market share, achieve economies of scale, and enhance their technological capabilities.
- Market Concentration: Leading companies hold approximately 60% of the global market share.
- Technological Innovation Drivers: Focus on energy-efficient smelting processes and advanced alloy formulations.
- Regulatory Frameworks: Stringent environmental regulations impacting emissions and waste management.
- Competitive Product Substitutes: Limited direct substitutes in mainstream steelmaking, but alternatives exist for niche applications.
- End-User Demographics: Primarily driven by steel producers for various grades of steel.
- M&A Trends: Consolidation efforts to gain vertical integration and market leverage.
Ferro Manganese Growth Trends & Insights
The global Ferro Manganese market is projected to witness steady growth, driven by the insatiable demand from the steel industry for enhanced metal properties. The market size, estimated at $XX million in 2025, is anticipated to expand at a Compound Annual Growth Rate (CAGR) of XX% through 2033, reaching an estimated $XX million. Adoption rates are closely tied to the expansion of steel production facilities globally, particularly in emerging economies. Technological disruptions are primarily focused on improving energy efficiency in the smelting process and developing ferro manganese grades with specialized properties to meet evolving steel requirements. Consumer behavior shifts are subtle but lean towards a preference for producers demonstrating commitment to sustainable practices and consistent product quality. The integration of advanced alloys for specialized steel grades is a key trend influencing demand.
- Market Size Evolution: From $XX million (2019) to an estimated $XX million (2025) and projected $XX million by 2033.
- CAGR: XX% during the forecast period (2025–2033).
- Adoption Rates: Closely follows global steel production output.
- Technological Disruptions: Emphasis on energy-saving smelting techniques and precise alloy composition.
- Consumer Behavior Shifts: Growing preference for sustainable production and high-purity products.
- Market Penetration: High penetration in carbon steel production, with increasing application in specialized alloys.
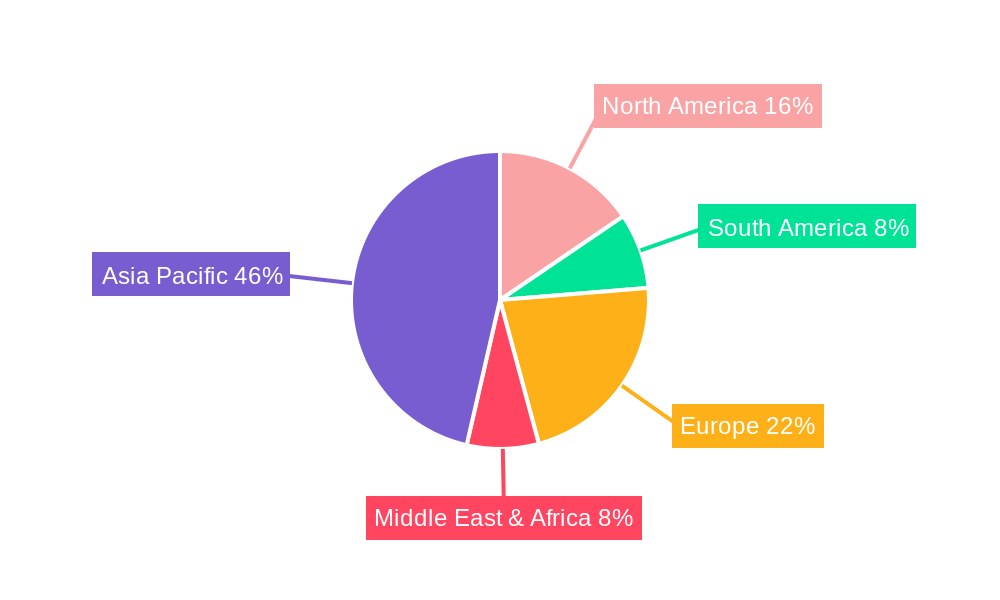
Dominant Regions, Countries, or Segments in Ferro Manganese
The High Carbon segment within the Ferro Manganese market is currently the dominant force, driven by its extensive application as a deoxidizer and alloying element in the production of a wide range of carbon steels. This segment's dominance is further bolstered by the sheer volume of carbon steel produced globally, especially in infrastructure development and basic manufacturing.
Asia Pacific, particularly China, stands out as the leading region and country in the Ferro Manganese market. This dominance is attributed to its colossal steel production capacity, robust industrial infrastructure, and significant domestic consumption. Government policies supporting industrial growth and substantial investments in steel manufacturing have solidified its position. The region's economic policies foster large-scale production and consumption, making it a critical hub for ferro manganese trade. The growth potential in Asia Pacific remains substantial due to ongoing urbanization and infrastructure projects.
- Dominant Segment: High Carbon Ferro Manganese, accounting for approximately XX% of the total market.
- Key Driver: Essential in the production of carbon steel, the most widely used steel type.
- Applications: Primarily used as a deoxidizer and alloying element.
- Market Share: Holds the largest share due to widespread steel production.
- Dominant Region: Asia Pacific.
- Key Drivers: Massive steel production, industrialization, and government support.
- Market Share: Accounts for over XX% of global ferro manganese consumption.
- Growth Potential: Continues to be a high-growth region due to ongoing development.
- Dominant Country: China.
- Key Drivers: World's largest steel producer, extensive manufacturing base.
- Economic Policies: Favorable policies for industrial expansion and resource utilization.
- Infrastructure: Extensive and modern infrastructure supporting steel production and logistics.
Ferro Manganese Product Landscape
The Ferro Manganese product landscape is characterized by its essential role as a key additive in steelmaking, significantly influencing the properties of the final steel product. High carbon ferro manganese remains the workhorse due to its cost-effectiveness and widespread use in deoxidation and alloying processes for carbon steels. Medium and low carbon variants cater to specialized steel grades requiring precise metallurgical control, such as stainless steel and alloy steels. Innovations are focused on optimizing manganese content, reducing impurities, and developing customized grades for specific performance requirements in advanced alloys. Unique selling propositions often revolve around consistent chemical composition, low impurity levels, and superior deoxidizing capabilities, leading to enhanced steel quality and reduced production defects.
Key Drivers, Barriers & Challenges in Ferro Manganese
Key Drivers:
- Robust Steel Demand: The global demand for steel, particularly for infrastructure, automotive, and construction, directly fuels ferro manganese consumption.
- Alloying and Deoxidizing Properties: Ferro manganese's indispensable role in enhancing steel strength, hardness, and resistance to corrosion.
- Economic Growth in Emerging Markets: Rapid industrialization in developing economies drives increased steel production and, consequently, ferro manganese demand.
- Technological Advancements in Steelmaking: Development of new steel grades requiring specific ferro manganese compositions.
Key Barriers & Challenges:
- Price Volatility of Raw Materials: Fluctuations in manganese ore and energy prices directly impact production costs and market prices.
- Environmental Regulations: Stringent environmental regulations regarding emissions and waste disposal increase operational costs and necessitate investment in cleaner technologies.
- Energy Intensity of Production: The smelting process is energy-intensive, making producers vulnerable to energy price shocks and sustainability pressures.
- Competition from Alternative Alloys: While direct substitutes are limited, other manganese alloys or additives can pose a competitive threat in certain applications.
- Supply Chain Disruptions: Geopolitical factors and logistical challenges can disrupt the supply of manganese ore and the distribution of ferro manganese.
- Capacity Utilization: Ensuring optimal capacity utilization among producers to maintain competitive pricing.
Emerging Opportunities in Ferro Manganese
Emerging opportunities in the Ferro Manganese market lie in the development of high-purity ferro manganese for specialized alloy applications, such as advanced high-strength steels (AHSS) used in the automotive industry for lightweighting and enhanced safety. The growing focus on sustainable production methods presents opportunities for companies investing in energy-efficient technologies and low-emission smelting processes. Furthermore, the untapped potential in emerging economies with developing industrial bases offers significant growth avenues. Evolving consumer preferences for eco-friendly products also create demand for ferro manganese produced with minimal environmental impact.
Growth Accelerators in the Ferro Manganese Industry
Technological breakthroughs in energy-efficient smelting processes, such as advanced furnace designs and renewable energy integration, are significant growth accelerators. Strategic partnerships between ferro manganese producers and major steel manufacturers can ensure long-term supply agreements and foster collaborative innovation. Market expansion strategies, including exploring new geographical markets and developing customized ferro manganese grades for nascent industries, will also drive growth. The increasing adoption of ferro manganese in the production of specialized steels for renewable energy infrastructure, such as wind turbines and solar panels, represents a significant growth catalyst.
Key Players Shaping the Ferro Manganese Market
- CITIC Jinzhou Metal
- Yiwang Ferroalloy
- Erdos
- Tianjin Jinsheng
- Sincerity
- Sanhuan
- Sheng Yan Group
- Glencore
- SAIL
- Nikopol
- Zaporozhye
Notable Milestones in Ferro Manganese Sector
- 2020: Increased investment in R&D for energy-efficient ferro manganese production following global environmental regulations.
- 2021: Glencore announces significant expansion in manganese ore sourcing, impacting upstream supply for ferro manganese.
- 2022: Several Chinese ferro manganese producers implement upgrades to reduce carbon emissions.
- 2023: SAIL reports record production of specialized alloy steels, boosting demand for higher-grade ferro manganese.
- 2024: Emerging markets show a substantial increase in steel production capacity, signaling future demand growth for ferro manganese.
- 2024 (Q4): Introduction of novel ferro manganese formulations with enhanced deoxidizing efficiency by Yiwang Ferroalloy.
In-Depth Ferro Manganese Market Outlook
The future outlook for the Ferro Manganese market is characterized by sustained growth, driven by the indispensable role of manganese in the global steel industry. Growth accelerators, including technological innovations in sustainable production and the increasing demand for specialized steel grades, will continue to shape the market. Strategic opportunities lie in catering to the burgeoning demand from developing economies and investing in research and development to create advanced ferro manganese products with superior performance characteristics. Companies that can navigate the complexities of raw material price volatility and increasingly stringent environmental regulations, while capitalizing on the expanding applications of steel, are poised for significant success. The integration of Industry 4.0 principles for enhanced production efficiency and supply chain management will also be a key differentiator.
Ferro Manganese Segmentation
-
1. Application
- 1.1. Deoxidizer
- 1.2. Alloying Element Additive
- 1.3. Others
-
2. Type
- 2.1. High Carbon
- 2.2. Medium Carbon
- 2.3. Low Carbon
Ferro Manganese Segmentation By Geography
-
1. North America
- 1.1. United States
- 1.2. Canada
- 1.3. Mexico
-
2. South America
- 2.1. Brazil
- 2.2. Argentina
- 2.3. Rest of South America
-
3. Europe
- 3.1. United Kingdom
- 3.2. Germany
- 3.3. France
- 3.4. Italy
- 3.5. Spain
- 3.6. Russia
- 3.7. Benelux
- 3.8. Nordics
- 3.9. Rest of Europe
-
4. Middle East & Africa
- 4.1. Turkey
- 4.2. Israel
- 4.3. GCC
- 4.4. North Africa
- 4.5. South Africa
- 4.6. Rest of Middle East & Africa
-
5. Asia Pacific
- 5.1. China
- 5.2. India
- 5.3. Japan
- 5.4. South Korea
- 5.5. ASEAN
- 5.6. Oceania
- 5.7. Rest of Asia Pacific
Ferro Manganese Regional Market Share
Geographic Coverage of Ferro Manganese
Ferro Manganese REPORT HIGHLIGHTS
| Aspects | Details |
|---|---|
| Study Period | 2020-2034 |
| Base Year | 2025 |
| Estimated Year | 2026 |
| Forecast Period | 2026-2034 |
| Historical Period | 2020-2025 |
| Growth Rate | CAGR of 2.8% from 2020-2034 |
| Segmentation |
|
Table of Contents
- 1. Introduction
- 1.1. Research Scope
- 1.2. Market Segmentation
- 1.3. Research Objective
- 1.4. Definitions and Assumptions
- 2. Executive Summary
- 2.1. Market Snapshot
- 3. Market Dynamics
- 3.1. Market Drivers
- 3.2. Market Restrains
- 3.3. Market Trends
- 3.4. Market Opportunities
- 4. Market Factor Analysis
- 4.1. Porters Five Forces
- 4.1.1. Bargaining Power of Suppliers
- 4.1.2. Bargaining Power of Buyers
- 4.1.3. Threat of New Entrants
- 4.1.4. Threat of Substitutes
- 4.1.5. Competitive Rivalry
- 4.2. PESTEL analysis
- 4.3. BCG Analysis
- 4.3.1. Stars (High Growth, High Market Share)
- 4.3.2. Cash Cows (Low Growth, High Market Share)
- 4.3.3. Question Mark (High Growth, Low Market Share)
- 4.3.4. Dogs (Low Growth, Low Market Share)
- 4.4. Ansoff Matrix Analysis
- 4.5. Supply Chain Analysis
- 4.6. Regulatory Landscape
- 4.7. Current Market Potential and Opportunity Assessment (TAM–SAM–SOM Framework)
- 4.8. NRP Analyst Note
- 4.1. Porters Five Forces
- 5. Market Analysis, Insights and Forecast 2021-2033
- 5.1. Market Analysis, Insights and Forecast - by Application
- 5.1.1. Deoxidizer
- 5.1.2. Alloying Element Additive
- 5.1.3. Others
- 5.2. Market Analysis, Insights and Forecast - by Type
- 5.2.1. High Carbon
- 5.2.2. Medium Carbon
- 5.2.3. Low Carbon
- 5.3. Market Analysis, Insights and Forecast - by Region
- 5.3.1. North America
- 5.3.2. South America
- 5.3.3. Europe
- 5.3.4. Middle East & Africa
- 5.3.5. Asia Pacific
- 5.1. Market Analysis, Insights and Forecast - by Application
- 6. Global Ferro Manganese Analysis, Insights and Forecast, 2021-2033
- 6.1. Market Analysis, Insights and Forecast - by Application
- 6.1.1. Deoxidizer
- 6.1.2. Alloying Element Additive
- 6.1.3. Others
- 6.2. Market Analysis, Insights and Forecast - by Type
- 6.2.1. High Carbon
- 6.2.2. Medium Carbon
- 6.2.3. Low Carbon
- 6.1. Market Analysis, Insights and Forecast - by Application
- 7. North America Ferro Manganese Analysis, Insights and Forecast, 2020-2032
- 7.1. Market Analysis, Insights and Forecast - by Application
- 7.1.1. Deoxidizer
- 7.1.2. Alloying Element Additive
- 7.1.3. Others
- 7.2. Market Analysis, Insights and Forecast - by Type
- 7.2.1. High Carbon
- 7.2.2. Medium Carbon
- 7.2.3. Low Carbon
- 7.1. Market Analysis, Insights and Forecast - by Application
- 8. South America Ferro Manganese Analysis, Insights and Forecast, 2020-2032
- 8.1. Market Analysis, Insights and Forecast - by Application
- 8.1.1. Deoxidizer
- 8.1.2. Alloying Element Additive
- 8.1.3. Others
- 8.2. Market Analysis, Insights and Forecast - by Type
- 8.2.1. High Carbon
- 8.2.2. Medium Carbon
- 8.2.3. Low Carbon
- 8.1. Market Analysis, Insights and Forecast - by Application
- 9. Europe Ferro Manganese Analysis, Insights and Forecast, 2020-2032
- 9.1. Market Analysis, Insights and Forecast - by Application
- 9.1.1. Deoxidizer
- 9.1.2. Alloying Element Additive
- 9.1.3. Others
- 9.2. Market Analysis, Insights and Forecast - by Type
- 9.2.1. High Carbon
- 9.2.2. Medium Carbon
- 9.2.3. Low Carbon
- 9.1. Market Analysis, Insights and Forecast - by Application
- 10. Middle East & Africa Ferro Manganese Analysis, Insights and Forecast, 2020-2032
- 10.1. Market Analysis, Insights and Forecast - by Application
- 10.1.1. Deoxidizer
- 10.1.2. Alloying Element Additive
- 10.1.3. Others
- 10.2. Market Analysis, Insights and Forecast - by Type
- 10.2.1. High Carbon
- 10.2.2. Medium Carbon
- 10.2.3. Low Carbon
- 10.1. Market Analysis, Insights and Forecast - by Application
- 11. Asia Pacific Ferro Manganese Analysis, Insights and Forecast, 2020-2032
- 11.1. Market Analysis, Insights and Forecast - by Application
- 11.1.1. Deoxidizer
- 11.1.2. Alloying Element Additive
- 11.1.3. Others
- 11.2. Market Analysis, Insights and Forecast - by Type
- 11.2.1. High Carbon
- 11.2.2. Medium Carbon
- 11.2.3. Low Carbon
- 11.1. Market Analysis, Insights and Forecast - by Application
- 12. Competitive Analysis
- 12.1. Company Profiles
- 12.1.1 CITIC Jinzhou Metal
- 12.1.1.1. Company Overview
- 12.1.1.2. Products
- 12.1.1.3. Company Financials
- 12.1.1.4. SWOT Analysis
- 12.1.2 Yiwang Ferroalloy
- 12.1.2.1. Company Overview
- 12.1.2.2. Products
- 12.1.2.3. Company Financials
- 12.1.2.4. SWOT Analysis
- 12.1.3 Erdos
- 12.1.3.1. Company Overview
- 12.1.3.2. Products
- 12.1.3.3. Company Financials
- 12.1.3.4. SWOT Analysis
- 12.1.4 Tianjin Jinsheng
- 12.1.4.1. Company Overview
- 12.1.4.2. Products
- 12.1.4.3. Company Financials
- 12.1.4.4. SWOT Analysis
- 12.1.5 Sincerity
- 12.1.5.1. Company Overview
- 12.1.5.2. Products
- 12.1.5.3. Company Financials
- 12.1.5.4. SWOT Analysis
- 12.1.6 Sanhuan
- 12.1.6.1. Company Overview
- 12.1.6.2. Products
- 12.1.6.3. Company Financials
- 12.1.6.4. SWOT Analysis
- 12.1.7 Sheng Yan Group
- 12.1.7.1. Company Overview
- 12.1.7.2. Products
- 12.1.7.3. Company Financials
- 12.1.7.4. SWOT Analysis
- 12.1.8 Glencore
- 12.1.8.1. Company Overview
- 12.1.8.2. Products
- 12.1.8.3. Company Financials
- 12.1.8.4. SWOT Analysis
- 12.1.9 SAIL
- 12.1.9.1. Company Overview
- 12.1.9.2. Products
- 12.1.9.3. Company Financials
- 12.1.9.4. SWOT Analysis
- 12.1.10 Nikopol
- 12.1.10.1. Company Overview
- 12.1.10.2. Products
- 12.1.10.3. Company Financials
- 12.1.10.4. SWOT Analysis
- 12.1.11 Zaporozhye
- 12.1.11.1. Company Overview
- 12.1.11.2. Products
- 12.1.11.3. Company Financials
- 12.1.11.4. SWOT Analysis
- 12.1.1 CITIC Jinzhou Metal
- 12.2. Market Entropy
- 12.2.1 Company's Key Areas Served
- 12.2.2 Recent Developments
- 12.3. Company Market Share Analysis 2025
- 12.3.1 Top 5 Companies Market Share Analysis
- 12.3.2 Top 3 Companies Market Share Analysis
- 12.4. List of Potential Customers
- 13. Research Methodology
List of Figures
- Figure 1: Global Ferro Manganese Revenue Breakdown (million, %) by Region 2025 & 2033
- Figure 2: North America Ferro Manganese Revenue (million), by Application 2025 & 2033
- Figure 3: North America Ferro Manganese Revenue Share (%), by Application 2025 & 2033
- Figure 4: North America Ferro Manganese Revenue (million), by Type 2025 & 2033
- Figure 5: North America Ferro Manganese Revenue Share (%), by Type 2025 & 2033
- Figure 6: North America Ferro Manganese Revenue (million), by Country 2025 & 2033
- Figure 7: North America Ferro Manganese Revenue Share (%), by Country 2025 & 2033
- Figure 8: South America Ferro Manganese Revenue (million), by Application 2025 & 2033
- Figure 9: South America Ferro Manganese Revenue Share (%), by Application 2025 & 2033
- Figure 10: South America Ferro Manganese Revenue (million), by Type 2025 & 2033
- Figure 11: South America Ferro Manganese Revenue Share (%), by Type 2025 & 2033
- Figure 12: South America Ferro Manganese Revenue (million), by Country 2025 & 2033
- Figure 13: South America Ferro Manganese Revenue Share (%), by Country 2025 & 2033
- Figure 14: Europe Ferro Manganese Revenue (million), by Application 2025 & 2033
- Figure 15: Europe Ferro Manganese Revenue Share (%), by Application 2025 & 2033
- Figure 16: Europe Ferro Manganese Revenue (million), by Type 2025 & 2033
- Figure 17: Europe Ferro Manganese Revenue Share (%), by Type 2025 & 2033
- Figure 18: Europe Ferro Manganese Revenue (million), by Country 2025 & 2033
- Figure 19: Europe Ferro Manganese Revenue Share (%), by Country 2025 & 2033
- Figure 20: Middle East & Africa Ferro Manganese Revenue (million), by Application 2025 & 2033
- Figure 21: Middle East & Africa Ferro Manganese Revenue Share (%), by Application 2025 & 2033
- Figure 22: Middle East & Africa Ferro Manganese Revenue (million), by Type 2025 & 2033
- Figure 23: Middle East & Africa Ferro Manganese Revenue Share (%), by Type 2025 & 2033
- Figure 24: Middle East & Africa Ferro Manganese Revenue (million), by Country 2025 & 2033
- Figure 25: Middle East & Africa Ferro Manganese Revenue Share (%), by Country 2025 & 2033
- Figure 26: Asia Pacific Ferro Manganese Revenue (million), by Application 2025 & 2033
- Figure 27: Asia Pacific Ferro Manganese Revenue Share (%), by Application 2025 & 2033
- Figure 28: Asia Pacific Ferro Manganese Revenue (million), by Type 2025 & 2033
- Figure 29: Asia Pacific Ferro Manganese Revenue Share (%), by Type 2025 & 2033
- Figure 30: Asia Pacific Ferro Manganese Revenue (million), by Country 2025 & 2033
- Figure 31: Asia Pacific Ferro Manganese Revenue Share (%), by Country 2025 & 2033
List of Tables
- Table 1: Global Ferro Manganese Revenue million Forecast, by Application 2020 & 2033
- Table 2: Global Ferro Manganese Revenue million Forecast, by Type 2020 & 2033
- Table 3: Global Ferro Manganese Revenue million Forecast, by Region 2020 & 2033
- Table 4: Global Ferro Manganese Revenue million Forecast, by Application 2020 & 2033
- Table 5: Global Ferro Manganese Revenue million Forecast, by Type 2020 & 2033
- Table 6: Global Ferro Manganese Revenue million Forecast, by Country 2020 & 2033
- Table 7: United States Ferro Manganese Revenue (million) Forecast, by Application 2020 & 2033
- Table 8: Canada Ferro Manganese Revenue (million) Forecast, by Application 2020 & 2033
- Table 9: Mexico Ferro Manganese Revenue (million) Forecast, by Application 2020 & 2033
- Table 10: Global Ferro Manganese Revenue million Forecast, by Application 2020 & 2033
- Table 11: Global Ferro Manganese Revenue million Forecast, by Type 2020 & 2033
- Table 12: Global Ferro Manganese Revenue million Forecast, by Country 2020 & 2033
- Table 13: Brazil Ferro Manganese Revenue (million) Forecast, by Application 2020 & 2033
- Table 14: Argentina Ferro Manganese Revenue (million) Forecast, by Application 2020 & 2033
- Table 15: Rest of South America Ferro Manganese Revenue (million) Forecast, by Application 2020 & 2033
- Table 16: Global Ferro Manganese Revenue million Forecast, by Application 2020 & 2033
- Table 17: Global Ferro Manganese Revenue million Forecast, by Type 2020 & 2033
- Table 18: Global Ferro Manganese Revenue million Forecast, by Country 2020 & 2033
- Table 19: United Kingdom Ferro Manganese Revenue (million) Forecast, by Application 2020 & 2033
- Table 20: Germany Ferro Manganese Revenue (million) Forecast, by Application 2020 & 2033
- Table 21: France Ferro Manganese Revenue (million) Forecast, by Application 2020 & 2033
- Table 22: Italy Ferro Manganese Revenue (million) Forecast, by Application 2020 & 2033
- Table 23: Spain Ferro Manganese Revenue (million) Forecast, by Application 2020 & 2033
- Table 24: Russia Ferro Manganese Revenue (million) Forecast, by Application 2020 & 2033
- Table 25: Benelux Ferro Manganese Revenue (million) Forecast, by Application 2020 & 2033
- Table 26: Nordics Ferro Manganese Revenue (million) Forecast, by Application 2020 & 2033
- Table 27: Rest of Europe Ferro Manganese Revenue (million) Forecast, by Application 2020 & 2033
- Table 28: Global Ferro Manganese Revenue million Forecast, by Application 2020 & 2033
- Table 29: Global Ferro Manganese Revenue million Forecast, by Type 2020 & 2033
- Table 30: Global Ferro Manganese Revenue million Forecast, by Country 2020 & 2033
- Table 31: Turkey Ferro Manganese Revenue (million) Forecast, by Application 2020 & 2033
- Table 32: Israel Ferro Manganese Revenue (million) Forecast, by Application 2020 & 2033
- Table 33: GCC Ferro Manganese Revenue (million) Forecast, by Application 2020 & 2033
- Table 34: North Africa Ferro Manganese Revenue (million) Forecast, by Application 2020 & 2033
- Table 35: South Africa Ferro Manganese Revenue (million) Forecast, by Application 2020 & 2033
- Table 36: Rest of Middle East & Africa Ferro Manganese Revenue (million) Forecast, by Application 2020 & 2033
- Table 37: Global Ferro Manganese Revenue million Forecast, by Application 2020 & 2033
- Table 38: Global Ferro Manganese Revenue million Forecast, by Type 2020 & 2033
- Table 39: Global Ferro Manganese Revenue million Forecast, by Country 2020 & 2033
- Table 40: China Ferro Manganese Revenue (million) Forecast, by Application 2020 & 2033
- Table 41: India Ferro Manganese Revenue (million) Forecast, by Application 2020 & 2033
- Table 42: Japan Ferro Manganese Revenue (million) Forecast, by Application 2020 & 2033
- Table 43: South Korea Ferro Manganese Revenue (million) Forecast, by Application 2020 & 2033
- Table 44: ASEAN Ferro Manganese Revenue (million) Forecast, by Application 2020 & 2033
- Table 45: Oceania Ferro Manganese Revenue (million) Forecast, by Application 2020 & 2033
- Table 46: Rest of Asia Pacific Ferro Manganese Revenue (million) Forecast, by Application 2020 & 2033
Frequently Asked Questions
1. What is the projected Compound Annual Growth Rate (CAGR) of the Ferro Manganese?
The projected CAGR is approximately 2.8%.
2. Which companies are prominent players in the Ferro Manganese?
Key companies in the market include CITIC Jinzhou Metal, Yiwang Ferroalloy, Erdos, Tianjin Jinsheng, Sincerity, Sanhuan, Sheng Yan Group, Glencore, SAIL, Nikopol, Zaporozhye.
3. What are the main segments of the Ferro Manganese?
The market segments include Application, Type.
4. Can you provide details about the market size?
The market size is estimated to be USD 5603 million as of 2022.
5. What are some drivers contributing to market growth?
N/A
6. What are the notable trends driving market growth?
N/A
7. Are there any restraints impacting market growth?
N/A
8. Can you provide examples of recent developments in the market?
N/A
9. What pricing options are available for accessing the report?
Pricing options include single-user, multi-user, and enterprise licenses priced at USD 4250.00, USD 6375.00, and USD 8500.00 respectively.
10. Is the market size provided in terms of value or volume?
The market size is provided in terms of value, measured in million.
11. Are there any specific market keywords associated with the report?
Yes, the market keyword associated with the report is "Ferro Manganese," which aids in identifying and referencing the specific market segment covered.
12. How do I determine which pricing option suits my needs best?
The pricing options vary based on user requirements and access needs. Individual users may opt for single-user licenses, while businesses requiring broader access may choose multi-user or enterprise licenses for cost-effective access to the report.
13. Are there any additional resources or data provided in the Ferro Manganese report?
While the report offers comprehensive insights, it's advisable to review the specific contents or supplementary materials provided to ascertain if additional resources or data are available.
14. How can I stay updated on further developments or reports in the Ferro Manganese?
To stay informed about further developments, trends, and reports in the Ferro Manganese, consider subscribing to industry newsletters, following relevant companies and organizations, or regularly checking reputable industry news sources and publications.
Methodology
Step 1 - Identification of Relevant Samples Size from Population Database


Step 2 - Approaches for Defining Global Market Size (Value, Volume* & Price*)

Note*: In applicable scenarios
Step 3 - Data Sources
Primary Research
- Web Analytics
- Survey Reports
- Research Institute
- Latest Research Reports
- Opinion Leaders
Secondary Research
- Annual Reports
- White Paper
- Latest Press Release
- Industry Association
- Paid Database
- Investor Presentations

Step 4 - Data Triangulation
Involves using different sources of information in order to increase the validity of a study
These sources are likely to be stakeholders in a program - participants, other researchers, program staff, other community members, and so on.
Then we put all data in single framework & apply various statistical tools to find out the dynamic on the market.
During the analysis stage, feedback from the stakeholder groups would be compared to determine areas of agreement as well as areas of divergence