

Key Insights
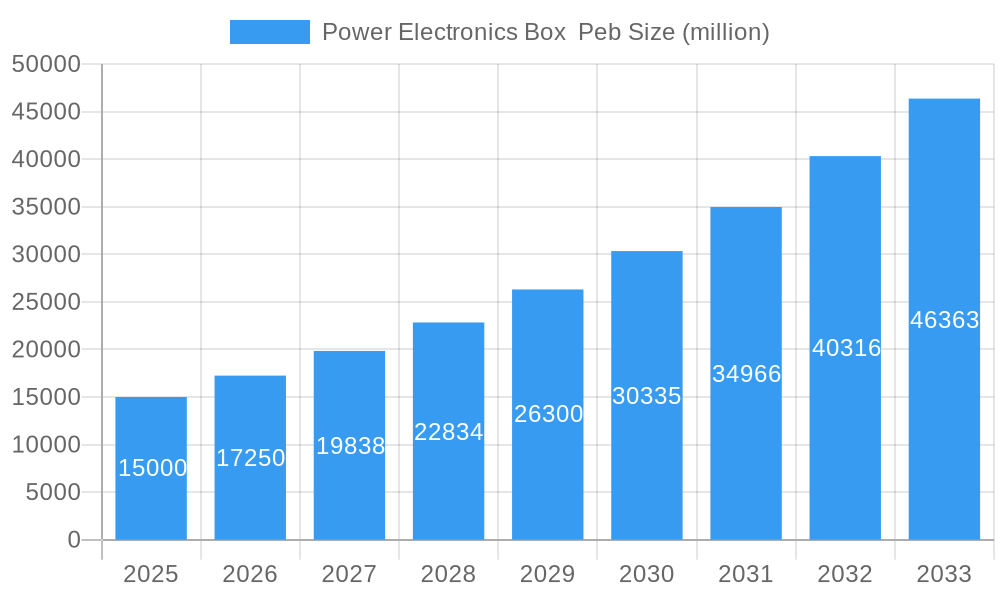
The Power Electronics Box (PEB) market is experiencing robust growth, driven by the increasing adoption of electric vehicles (EVs) and hybrid electric vehicles (HEVs). The rising demand for improved fuel efficiency and reduced emissions is a key catalyst, pushing automakers to integrate sophisticated power electronics systems. This market is projected to expand significantly over the next decade, with a Compound Annual Growth Rate (CAGR) estimated conservatively at 15% between 2025 and 2033. This growth is fueled by technological advancements leading to smaller, lighter, and more efficient PEBs, along with government regulations promoting electric mobility globally. Key players like Bosch, BorgWarner, and ZF Group are investing heavily in R&D to enhance PEB performance and reliability, further stimulating market expansion. Segmentation within the market is likely driven by vehicle type (EVs vs. HEVs), voltage levels, and geographical regions. Growth may be uneven across different regions, reflecting variations in EV adoption rates and government incentives. Challenges include the high initial investment costs associated with PEB technology and the need for robust thermal management systems to ensure optimal performance under diverse operating conditions.
Power Electronics Box Peb Market Size (In Billion)
The competitive landscape is characterized by both established automotive suppliers and emerging technology companies. Established players leverage their extensive experience in automotive electronics and global distribution networks, while newer entrants often focus on disruptive technologies like silicon carbide (SiC) power semiconductors and advanced control algorithms to enhance efficiency and power density. The market is witnessing increasing consolidation, with strategic alliances and acquisitions becoming prevalent. As the EV market matures, the demand for PEBs is expected to skyrocket, creating further opportunities for growth and innovation. Future trends include the integration of advanced driver-assistance systems (ADAS) functions within the PEB, contributing to its increased complexity and value. The ongoing development of next-generation battery technologies will also significantly influence the design and performance requirements of future PEB systems.
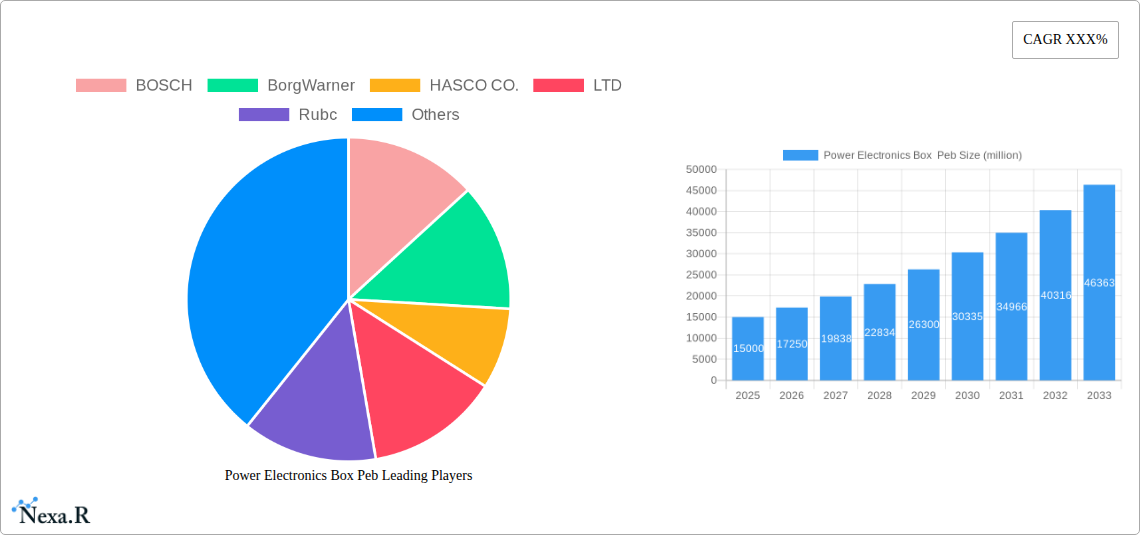
Power Electronics Box Peb Company Market Share
Power Electronics Box (PEB) Market Report: 2019-2033 - A Comprehensive Analysis
This comprehensive report provides an in-depth analysis of the global Power Electronics Box (PEB) market, encompassing market dynamics, growth trends, regional analysis, product landscape, key players, and future outlook. The study period covers 2019-2033, with 2025 as the base year and forecast period extending to 2033. The report caters to industry professionals, investors, and strategic decision-makers seeking a granular understanding of this rapidly evolving market. The parent market is the automotive industry, while the child market is powertrain electronics.
Power Electronics Box (PEB) Market Dynamics & Structure
This section analyzes the market's competitive landscape, technological advancements, regulatory environment, and market forces influencing the PEB industry. The market is characterized by moderate concentration, with key players like Bosch, BorgWarner, and ZF Group holding significant shares, estimated at xx% combined in 2025.
- Market Concentration: Moderate, with top 5 players holding approximately xx% market share in 2025.
- Technological Innovation: Driven by advancements in SiC and GaN power semiconductors, improving efficiency and power density. Innovation barriers include high R&D costs and the need for specialized manufacturing expertise.
- Regulatory Frameworks: Stringent emission standards (e.g., Euro 7, CA Clean Air Act) are major drivers, pushing adoption of efficient PEBs.
- Competitive Product Substitutes: Limited direct substitutes, but alternative powertrain technologies (e.g., fuel cells) pose indirect competition.
- End-User Demographics: Primarily focused on the automotive industry, with growth expected in electric vehicles (EVs), hybrid electric vehicles (HEVs), and commercial vehicles.
- M&A Trends: A moderate level of M&A activity is observed, with xx major deals recorded between 2019-2024, primarily focused on technology acquisition and market expansion.
Power Electronics Box (PEB) Growth Trends & Insights
The global Power Electronics Box (PEB) market is projected to experience significant growth, driven by the increasing adoption of electric and hybrid vehicles. The market size reached xx million units in 2025 and is forecast to reach xx million units by 2033, exhibiting a CAGR of xx% during the forecast period. Technological disruptions, such as the introduction of next-generation power semiconductors, are accelerating market expansion. Shifting consumer preferences towards sustainable mobility are also positively influencing adoption rates. Market penetration in the EV segment is expected to increase from xx% in 2025 to xx% by 2033.
Dominant Regions, Countries, or Segments in Power Electronics Box (PEB)
The Asia-Pacific region is expected to dominate the Power Electronics Box market, driven by robust EV adoption and government incentives promoting electrification. China and Japan are key contributors to regional growth.
- Key Drivers (Asia-Pacific):
- Strong government support for EV adoption through subsidies and tax breaks.
- Rapid growth of the EV manufacturing sector.
- Expanding charging infrastructure.
- Dominance Factors: High production volume of EVs, favorable government policies, and a large consumer base contribute to the region's dominance. The region holds approximately xx% market share in 2025. Growth potential is significant, driven by increasing demand for electrified transportation and expansion into other segments like industrial vehicles and renewable energy applications.
Power Electronics Box (PEB) Product Landscape
Power Electronics Boxes are undergoing continuous innovation, focusing on higher power density, efficiency, and thermal management. Miniaturization through advanced packaging technologies and the integration of multiple functions within a single unit are key trends. Unique selling propositions include improved fuel efficiency, enhanced performance, and compact designs.
Key Drivers, Barriers & Challenges in Power Electronics Box (PEB)
Key Drivers: The increasing demand for electric vehicles, stringent emission regulations, and advancements in power semiconductor technology are the primary growth drivers.
Challenges: High initial investment costs for advanced PEB technologies, potential supply chain disruptions related to raw materials (e.g., rare earth elements), and intense competition among established and emerging players pose significant challenges. The impact of these challenges is estimated to be a xx% reduction in overall market growth in 2028.
Emerging Opportunities in Power Electronics Box (PEB)
Emerging opportunities exist in the integration of PEBs with advanced driver-assistance systems (ADAS) and autonomous driving functionalities, as well as expansion into new applications such as energy storage systems and renewable energy integration.
Growth Accelerators in the Power Electronics Box (PEB) Industry
Technological advancements in power semiconductor devices, strategic partnerships between automotive manufacturers and PEB suppliers, and market expansion into new geographical regions are key growth accelerators. The increasing adoption of high-voltage architectures in EVs will further fuel market growth.
Key Players Shaping the Power Electronics Box (PEB) Market
- BOSCH
- BorgWarner
- HASCO CO.,LTD
- Rubc
- SAIC Motor
- ZF Group
- Vitesco Technologies
- Exro Technologies
Notable Milestones in Power Electronics Box (PEB) Sector
- 2021-Q3: Bosch launched a new generation of PEBs with enhanced efficiency.
- 2022-Q1: BorgWarner acquired a leading PEB technology company, expanding its market share.
- 2023-Q2: ZF Group announced a major investment in R&D for next-generation PEBs. (Further milestones need to be added based on available data).
In-Depth Power Electronics Box (PEB) Market Outlook
The Power Electronics Box market is poised for sustained growth, driven by technological innovations and the global shift towards electric mobility. Strategic partnerships, R&D investments, and expansion into new applications present significant opportunities for market players. The long-term outlook remains positive, with substantial potential for market expansion across various sectors.
Power Electronics Box Peb Segmentation
-
1. Application
- 1.1. Blade Electric Vehicles
- 1.2. Hybrid Electric Vehicle
- 1.3. Others
-
2. Type
- 2.1. Including Single Inverter
- 2.2. Including Dual Inverter
Power Electronics Box Peb Segmentation By Geography
-
1. North America
- 1.1. United States
- 1.2. Canada
- 1.3. Mexico
-
2. South America
- 2.1. Brazil
- 2.2. Argentina
- 2.3. Rest of South America
-
3. Europe
- 3.1. United Kingdom
- 3.2. Germany
- 3.3. France
- 3.4. Italy
- 3.5. Spain
- 3.6. Russia
- 3.7. Benelux
- 3.8. Nordics
- 3.9. Rest of Europe
-
4. Middle East & Africa
- 4.1. Turkey
- 4.2. Israel
- 4.3. GCC
- 4.4. North Africa
- 4.5. South Africa
- 4.6. Rest of Middle East & Africa
-
5. Asia Pacific
- 5.1. China
- 5.2. India
- 5.3. Japan
- 5.4. South Korea
- 5.5. ASEAN
- 5.6. Oceania
- 5.7. Rest of Asia Pacific
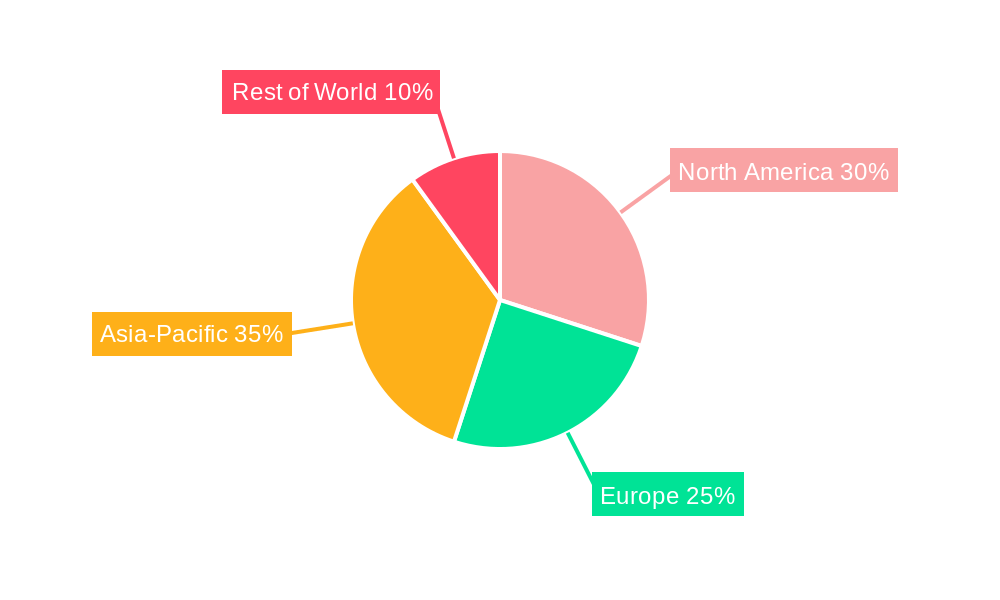
Power Electronics Box Peb Regional Market Share
Geographic Coverage of Power Electronics Box Peb
Power Electronics Box Peb REPORT HIGHLIGHTS
| Aspects | Details |
|---|---|
| Study Period | 2020-2034 |
| Base Year | 2025 |
| Estimated Year | 2026 |
| Forecast Period | 2026-2034 |
| Historical Period | 2020-2025 |
| Growth Rate | CAGR of XXX% from 2020-2034 |
| Segmentation |
|
Table of Contents
- 1. Introduction
- 1.1. Research Scope
- 1.2. Market Segmentation
- 1.3. Research Methodology
- 1.4. Definitions and Assumptions
- 2. Executive Summary
- 2.1. Introduction
- 3. Market Dynamics
- 3.1. Introduction
- 3.2. Market Drivers
- 3.3. Market Restrains
- 3.4. Market Trends
- 4. Market Factor Analysis
- 4.1. Porters Five Forces
- 4.2. Supply/Value Chain
- 4.3. PESTEL analysis
- 4.4. Market Entropy
- 4.5. Patent/Trademark Analysis
- 5. Global Power Electronics Box Peb Analysis, Insights and Forecast, 2020-2032
- 5.1. Market Analysis, Insights and Forecast - by Application
- 5.1.1. Blade Electric Vehicles
- 5.1.2. Hybrid Electric Vehicle
- 5.1.3. Others
- 5.2. Market Analysis, Insights and Forecast - by Type
- 5.2.1. Including Single Inverter
- 5.2.2. Including Dual Inverter
- 5.3. Market Analysis, Insights and Forecast - by Region
- 5.3.1. North America
- 5.3.2. South America
- 5.3.3. Europe
- 5.3.4. Middle East & Africa
- 5.3.5. Asia Pacific
- 5.1. Market Analysis, Insights and Forecast - by Application
- 6. North America Power Electronics Box Peb Analysis, Insights and Forecast, 2020-2032
- 6.1. Market Analysis, Insights and Forecast - by Application
- 6.1.1. Blade Electric Vehicles
- 6.1.2. Hybrid Electric Vehicle
- 6.1.3. Others
- 6.2. Market Analysis, Insights and Forecast - by Type
- 6.2.1. Including Single Inverter
- 6.2.2. Including Dual Inverter
- 6.1. Market Analysis, Insights and Forecast - by Application
- 7. South America Power Electronics Box Peb Analysis, Insights and Forecast, 2020-2032
- 7.1. Market Analysis, Insights and Forecast - by Application
- 7.1.1. Blade Electric Vehicles
- 7.1.2. Hybrid Electric Vehicle
- 7.1.3. Others
- 7.2. Market Analysis, Insights and Forecast - by Type
- 7.2.1. Including Single Inverter
- 7.2.2. Including Dual Inverter
- 7.1. Market Analysis, Insights and Forecast - by Application
- 8. Europe Power Electronics Box Peb Analysis, Insights and Forecast, 2020-2032
- 8.1. Market Analysis, Insights and Forecast - by Application
- 8.1.1. Blade Electric Vehicles
- 8.1.2. Hybrid Electric Vehicle
- 8.1.3. Others
- 8.2. Market Analysis, Insights and Forecast - by Type
- 8.2.1. Including Single Inverter
- 8.2.2. Including Dual Inverter
- 8.1. Market Analysis, Insights and Forecast - by Application
- 9. Middle East & Africa Power Electronics Box Peb Analysis, Insights and Forecast, 2020-2032
- 9.1. Market Analysis, Insights and Forecast - by Application
- 9.1.1. Blade Electric Vehicles
- 9.1.2. Hybrid Electric Vehicle
- 9.1.3. Others
- 9.2. Market Analysis, Insights and Forecast - by Type
- 9.2.1. Including Single Inverter
- 9.2.2. Including Dual Inverter
- 9.1. Market Analysis, Insights and Forecast - by Application
- 10. Asia Pacific Power Electronics Box Peb Analysis, Insights and Forecast, 2020-2032
- 10.1. Market Analysis, Insights and Forecast - by Application
- 10.1.1. Blade Electric Vehicles
- 10.1.2. Hybrid Electric Vehicle
- 10.1.3. Others
- 10.2. Market Analysis, Insights and Forecast - by Type
- 10.2.1. Including Single Inverter
- 10.2.2. Including Dual Inverter
- 10.1. Market Analysis, Insights and Forecast - by Application
- 11. Competitive Analysis
- 11.1. Global Market Share Analysis 2025
- 11.2. Company Profiles
- 11.2.1 BOSCH
- 11.2.1.1. Overview
- 11.2.1.2. Products
- 11.2.1.3. SWOT Analysis
- 11.2.1.4. Recent Developments
- 11.2.1.5. Financials (Based on Availability)
- 11.2.2 BorgWarner
- 11.2.2.1. Overview
- 11.2.2.2. Products
- 11.2.2.3. SWOT Analysis
- 11.2.2.4. Recent Developments
- 11.2.2.5. Financials (Based on Availability)
- 11.2.3 HASCO CO.
- 11.2.3.1. Overview
- 11.2.3.2. Products
- 11.2.3.3. SWOT Analysis
- 11.2.3.4. Recent Developments
- 11.2.3.5. Financials (Based on Availability)
- 11.2.4 LTD
- 11.2.4.1. Overview
- 11.2.4.2. Products
- 11.2.4.3. SWOT Analysis
- 11.2.4.4. Recent Developments
- 11.2.4.5. Financials (Based on Availability)
- 11.2.5 Rubc
- 11.2.5.1. Overview
- 11.2.5.2. Products
- 11.2.5.3. SWOT Analysis
- 11.2.5.4. Recent Developments
- 11.2.5.5. Financials (Based on Availability)
- 11.2.6 SAIC Motor
- 11.2.6.1. Overview
- 11.2.6.2. Products
- 11.2.6.3. SWOT Analysis
- 11.2.6.4. Recent Developments
- 11.2.6.5. Financials (Based on Availability)
- 11.2.7 ZF Group
- 11.2.7.1. Overview
- 11.2.7.2. Products
- 11.2.7.3. SWOT Analysis
- 11.2.7.4. Recent Developments
- 11.2.7.5. Financials (Based on Availability)
- 11.2.8 Vitesco Technologies
- 11.2.8.1. Overview
- 11.2.8.2. Products
- 11.2.8.3. SWOT Analysis
- 11.2.8.4. Recent Developments
- 11.2.8.5. Financials (Based on Availability)
- 11.2.9 Exro Technologies
- 11.2.9.1. Overview
- 11.2.9.2. Products
- 11.2.9.3. SWOT Analysis
- 11.2.9.4. Recent Developments
- 11.2.9.5. Financials (Based on Availability)
- 11.2.1 BOSCH
List of Figures
- Figure 1: Global Power Electronics Box Peb Revenue Breakdown (million, %) by Region 2025 & 2033
- Figure 2: North America Power Electronics Box Peb Revenue (million), by Application 2025 & 2033
- Figure 3: North America Power Electronics Box Peb Revenue Share (%), by Application 2025 & 2033
- Figure 4: North America Power Electronics Box Peb Revenue (million), by Type 2025 & 2033
- Figure 5: North America Power Electronics Box Peb Revenue Share (%), by Type 2025 & 2033
- Figure 6: North America Power Electronics Box Peb Revenue (million), by Country 2025 & 2033
- Figure 7: North America Power Electronics Box Peb Revenue Share (%), by Country 2025 & 2033
- Figure 8: South America Power Electronics Box Peb Revenue (million), by Application 2025 & 2033
- Figure 9: South America Power Electronics Box Peb Revenue Share (%), by Application 2025 & 2033
- Figure 10: South America Power Electronics Box Peb Revenue (million), by Type 2025 & 2033
- Figure 11: South America Power Electronics Box Peb Revenue Share (%), by Type 2025 & 2033
- Figure 12: South America Power Electronics Box Peb Revenue (million), by Country 2025 & 2033
- Figure 13: South America Power Electronics Box Peb Revenue Share (%), by Country 2025 & 2033
- Figure 14: Europe Power Electronics Box Peb Revenue (million), by Application 2025 & 2033
- Figure 15: Europe Power Electronics Box Peb Revenue Share (%), by Application 2025 & 2033
- Figure 16: Europe Power Electronics Box Peb Revenue (million), by Type 2025 & 2033
- Figure 17: Europe Power Electronics Box Peb Revenue Share (%), by Type 2025 & 2033
- Figure 18: Europe Power Electronics Box Peb Revenue (million), by Country 2025 & 2033
- Figure 19: Europe Power Electronics Box Peb Revenue Share (%), by Country 2025 & 2033
- Figure 20: Middle East & Africa Power Electronics Box Peb Revenue (million), by Application 2025 & 2033
- Figure 21: Middle East & Africa Power Electronics Box Peb Revenue Share (%), by Application 2025 & 2033
- Figure 22: Middle East & Africa Power Electronics Box Peb Revenue (million), by Type 2025 & 2033
- Figure 23: Middle East & Africa Power Electronics Box Peb Revenue Share (%), by Type 2025 & 2033
- Figure 24: Middle East & Africa Power Electronics Box Peb Revenue (million), by Country 2025 & 2033
- Figure 25: Middle East & Africa Power Electronics Box Peb Revenue Share (%), by Country 2025 & 2033
- Figure 26: Asia Pacific Power Electronics Box Peb Revenue (million), by Application 2025 & 2033
- Figure 27: Asia Pacific Power Electronics Box Peb Revenue Share (%), by Application 2025 & 2033
- Figure 28: Asia Pacific Power Electronics Box Peb Revenue (million), by Type 2025 & 2033
- Figure 29: Asia Pacific Power Electronics Box Peb Revenue Share (%), by Type 2025 & 2033
- Figure 30: Asia Pacific Power Electronics Box Peb Revenue (million), by Country 2025 & 2033
- Figure 31: Asia Pacific Power Electronics Box Peb Revenue Share (%), by Country 2025 & 2033
List of Tables
- Table 1: Global Power Electronics Box Peb Revenue million Forecast, by Application 2020 & 2033
- Table 2: Global Power Electronics Box Peb Revenue million Forecast, by Type 2020 & 2033
- Table 3: Global Power Electronics Box Peb Revenue million Forecast, by Region 2020 & 2033
- Table 4: Global Power Electronics Box Peb Revenue million Forecast, by Application 2020 & 2033
- Table 5: Global Power Electronics Box Peb Revenue million Forecast, by Type 2020 & 2033
- Table 6: Global Power Electronics Box Peb Revenue million Forecast, by Country 2020 & 2033
- Table 7: United States Power Electronics Box Peb Revenue (million) Forecast, by Application 2020 & 2033
- Table 8: Canada Power Electronics Box Peb Revenue (million) Forecast, by Application 2020 & 2033
- Table 9: Mexico Power Electronics Box Peb Revenue (million) Forecast, by Application 2020 & 2033
- Table 10: Global Power Electronics Box Peb Revenue million Forecast, by Application 2020 & 2033
- Table 11: Global Power Electronics Box Peb Revenue million Forecast, by Type 2020 & 2033
- Table 12: Global Power Electronics Box Peb Revenue million Forecast, by Country 2020 & 2033
- Table 13: Brazil Power Electronics Box Peb Revenue (million) Forecast, by Application 2020 & 2033
- Table 14: Argentina Power Electronics Box Peb Revenue (million) Forecast, by Application 2020 & 2033
- Table 15: Rest of South America Power Electronics Box Peb Revenue (million) Forecast, by Application 2020 & 2033
- Table 16: Global Power Electronics Box Peb Revenue million Forecast, by Application 2020 & 2033
- Table 17: Global Power Electronics Box Peb Revenue million Forecast, by Type 2020 & 2033
- Table 18: Global Power Electronics Box Peb Revenue million Forecast, by Country 2020 & 2033
- Table 19: United Kingdom Power Electronics Box Peb Revenue (million) Forecast, by Application 2020 & 2033
- Table 20: Germany Power Electronics Box Peb Revenue (million) Forecast, by Application 2020 & 2033
- Table 21: France Power Electronics Box Peb Revenue (million) Forecast, by Application 2020 & 2033
- Table 22: Italy Power Electronics Box Peb Revenue (million) Forecast, by Application 2020 & 2033
- Table 23: Spain Power Electronics Box Peb Revenue (million) Forecast, by Application 2020 & 2033
- Table 24: Russia Power Electronics Box Peb Revenue (million) Forecast, by Application 2020 & 2033
- Table 25: Benelux Power Electronics Box Peb Revenue (million) Forecast, by Application 2020 & 2033
- Table 26: Nordics Power Electronics Box Peb Revenue (million) Forecast, by Application 2020 & 2033
- Table 27: Rest of Europe Power Electronics Box Peb Revenue (million) Forecast, by Application 2020 & 2033
- Table 28: Global Power Electronics Box Peb Revenue million Forecast, by Application 2020 & 2033
- Table 29: Global Power Electronics Box Peb Revenue million Forecast, by Type 2020 & 2033
- Table 30: Global Power Electronics Box Peb Revenue million Forecast, by Country 2020 & 2033
- Table 31: Turkey Power Electronics Box Peb Revenue (million) Forecast, by Application 2020 & 2033
- Table 32: Israel Power Electronics Box Peb Revenue (million) Forecast, by Application 2020 & 2033
- Table 33: GCC Power Electronics Box Peb Revenue (million) Forecast, by Application 2020 & 2033
- Table 34: North Africa Power Electronics Box Peb Revenue (million) Forecast, by Application 2020 & 2033
- Table 35: South Africa Power Electronics Box Peb Revenue (million) Forecast, by Application 2020 & 2033
- Table 36: Rest of Middle East & Africa Power Electronics Box Peb Revenue (million) Forecast, by Application 2020 & 2033
- Table 37: Global Power Electronics Box Peb Revenue million Forecast, by Application 2020 & 2033
- Table 38: Global Power Electronics Box Peb Revenue million Forecast, by Type 2020 & 2033
- Table 39: Global Power Electronics Box Peb Revenue million Forecast, by Country 2020 & 2033
- Table 40: China Power Electronics Box Peb Revenue (million) Forecast, by Application 2020 & 2033
- Table 41: India Power Electronics Box Peb Revenue (million) Forecast, by Application 2020 & 2033
- Table 42: Japan Power Electronics Box Peb Revenue (million) Forecast, by Application 2020 & 2033
- Table 43: South Korea Power Electronics Box Peb Revenue (million) Forecast, by Application 2020 & 2033
- Table 44: ASEAN Power Electronics Box Peb Revenue (million) Forecast, by Application 2020 & 2033
- Table 45: Oceania Power Electronics Box Peb Revenue (million) Forecast, by Application 2020 & 2033
- Table 46: Rest of Asia Pacific Power Electronics Box Peb Revenue (million) Forecast, by Application 2020 & 2033
Frequently Asked Questions
1. What is the projected Compound Annual Growth Rate (CAGR) of the Power Electronics Box Peb?
The projected CAGR is approximately XXX%.
2. Which companies are prominent players in the Power Electronics Box Peb?
Key companies in the market include BOSCH, BorgWarner, HASCO CO., LTD, Rubc, SAIC Motor, ZF Group, Vitesco Technologies, Exro Technologies.
3. What are the main segments of the Power Electronics Box Peb?
The market segments include Application, Type.
4. Can you provide details about the market size?
The market size is estimated to be USD XXX million as of 2022.
5. What are some drivers contributing to market growth?
N/A
6. What are the notable trends driving market growth?
N/A
7. Are there any restraints impacting market growth?
N/A
8. Can you provide examples of recent developments in the market?
N/A
9. What pricing options are available for accessing the report?
Pricing options include single-user, multi-user, and enterprise licenses priced at USD 2900.00, USD 4350.00, and USD 5800.00 respectively.
10. Is the market size provided in terms of value or volume?
The market size is provided in terms of value, measured in million.
11. Are there any specific market keywords associated with the report?
Yes, the market keyword associated with the report is "Power Electronics Box Peb," which aids in identifying and referencing the specific market segment covered.
12. How do I determine which pricing option suits my needs best?
The pricing options vary based on user requirements and access needs. Individual users may opt for single-user licenses, while businesses requiring broader access may choose multi-user or enterprise licenses for cost-effective access to the report.
13. Are there any additional resources or data provided in the Power Electronics Box Peb report?
While the report offers comprehensive insights, it's advisable to review the specific contents or supplementary materials provided to ascertain if additional resources or data are available.
14. How can I stay updated on further developments or reports in the Power Electronics Box Peb?
To stay informed about further developments, trends, and reports in the Power Electronics Box Peb, consider subscribing to industry newsletters, following relevant companies and organizations, or regularly checking reputable industry news sources and publications.
Methodology
Step 1 - Identification of Relevant Samples Size from Population Database


Step 2 - Approaches for Defining Global Market Size (Value, Volume* & Price*)

Note*: In applicable scenarios
Step 3 - Data Sources
Primary Research
- Web Analytics
- Survey Reports
- Research Institute
- Latest Research Reports
- Opinion Leaders
Secondary Research
- Annual Reports
- White Paper
- Latest Press Release
- Industry Association
- Paid Database
- Investor Presentations

Step 4 - Data Triangulation
Involves using different sources of information in order to increase the validity of a study
These sources are likely to be stakeholders in a program - participants, other researchers, program staff, other community members, and so on.
Then we put all data in single framework & apply various statistical tools to find out the dynamic on the market.
During the analysis stage, feedback from the stakeholder groups would be compared to determine areas of agreement as well as areas of divergence