

Key Insights
The global anti-counterfeit packaging market is poised for substantial expansion, driven by heightened consumer awareness of counterfeit goods and increasingly rigorous government regulations designed to protect brand integrity and public safety. The market, projected to reach $204.08 billion by 2025, is forecasted to grow at a compound annual growth rate (CAGR) of 9.4% from 2025 to 2033. This robust growth is underpinned by several key drivers. The widespread adoption of advanced technologies, including track and trace solutions, tamper-evident packaging, and forensic markers, equips brands with sophisticated tools to authenticate products and actively deter counterfeiting. Concurrently, the burgeoning e-commerce sector, inherently susceptible to counterfeit infiltration, is generating significant demand for advanced anti-counterfeit solutions. The food and beverage, healthcare and pharmaceuticals, and consumer electronics industries are primary contributors to market growth, emphasizing product authenticity to ensure consumer safety and preserve brand reputation.
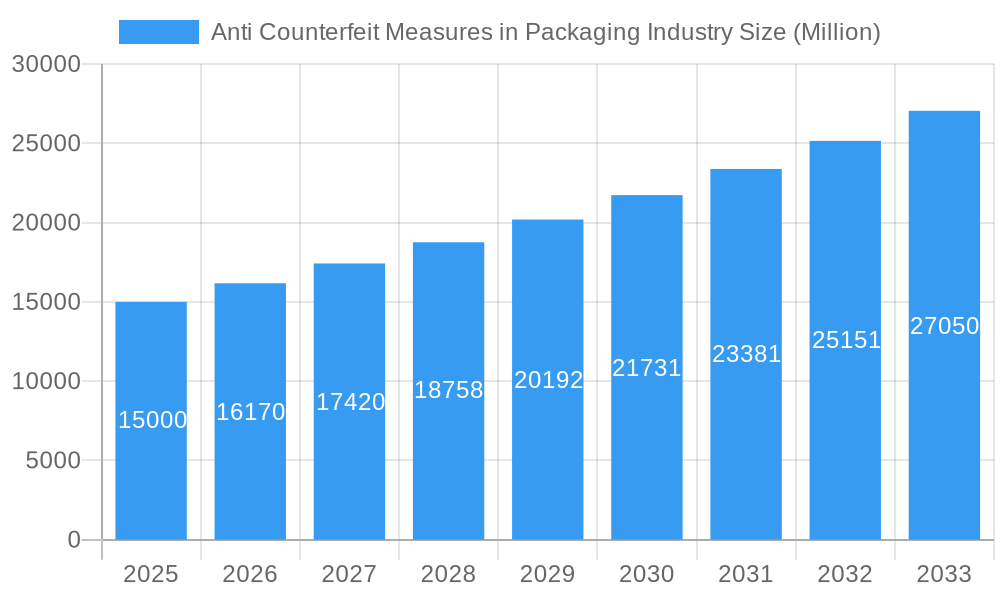
Anti Counterfeit Measures in Packaging Industry Market Size (In Billion)
Market segmentation highlights considerable opportunities across diverse technologies and end-user sectors. Track and trace solutions, facilitating real-time product monitoring and verification, are experiencing escalating adoption, closely followed by tamper-evident packaging, which provides immediate visual indication of unauthorized access. Geographically, North America and Europe currently command substantial market shares, attributed to well-established regulatory frameworks and elevated consumer awareness. Nevertheless, the Asia-Pacific region is anticipated to experience significant growth, fueled by increasing consumer expenditure and rising counterfeiting activities in emerging economies. Leading market participants are committed to continuous innovation, developing advanced and cost-effective solutions to address the evolving requirements of various industries and consumers. Intense competition fosters the development of novel technologies, further accelerating market expansion.
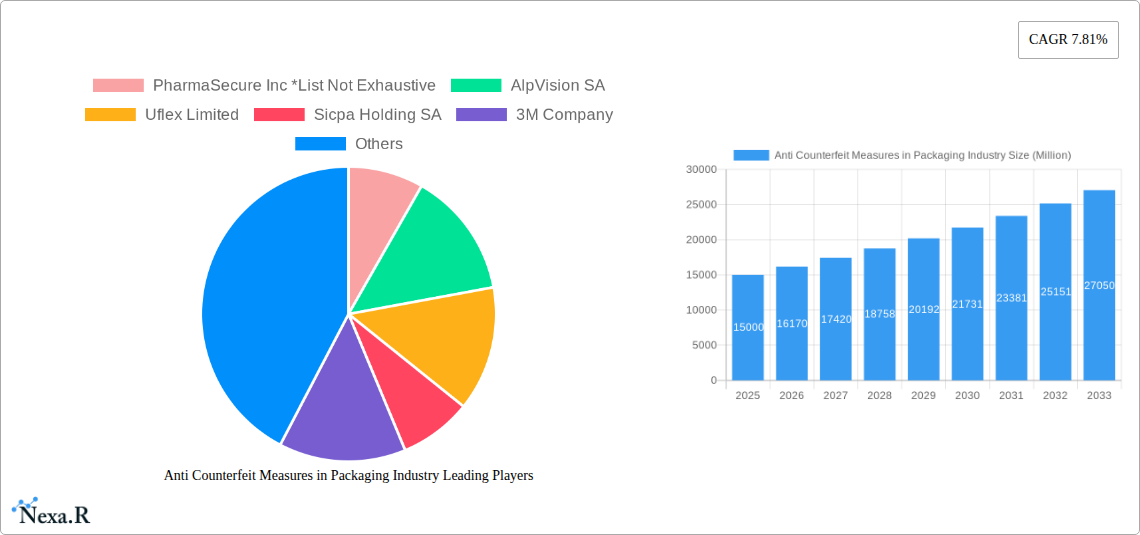
Anti Counterfeit Measures in Packaging Industry Company Market Share
Anti-Counterfeit Measures in Packaging Industry Market Report: 2019-2033
This comprehensive report provides an in-depth analysis of the Anti-Counterfeit Measures in Packaging Industry, encompassing market dynamics, growth trends, regional dominance, product landscape, key players, and future outlook. The study covers the period 2019-2033, with a base year of 2025 and a forecast period of 2025-2033. This report is crucial for industry professionals, investors, and strategic decision-makers seeking a clear understanding of this rapidly evolving market. The market size is predicted to reach xx Million units by 2033.
Anti-Counterfeit Measures in Packaging Industry Market Dynamics & Structure
The anti-counterfeit measures market is characterized by a moderately concentrated landscape, with key players like PharmaSecure Inc, AlpVision SA, Uflex Limited, Sicpa Holding SA, and 3M Company holding significant market share. Technological innovation, particularly in trace and track technologies, is a major driver. Stringent regulatory frameworks, especially within the pharmaceutical and food & beverage sectors, are pushing adoption. Competitive substitutes include traditional security features, but advanced technologies are gaining prominence. The end-user demographic is expanding across diverse industries. M&A activity, exemplified by Avery Dennison's acquisition of Vestcom in 2021 for USD 1.45 billion, signals consolidation and expansion strategies.
- Market Concentration: Moderately concentrated, with top 5 players holding approximately xx% market share in 2024.
- Technological Innovation: Significant advancements in RFID, blockchain, and digital watermarking are driving growth.
- Regulatory Landscape: Stringent regulations in pharmaceuticals and food & beverage sectors are major catalysts.
- Competitive Substitutes: Traditional security features (holograms, seals) face competition from advanced technologies.
- End-User Demographics: Expanding across diverse sectors, including healthcare, food & beverage, and consumer electronics.
- M&A Activity: Significant M&A activity indicates industry consolidation and expansion strategies (xx deals in 2019-2024).
Anti-Counterfeit Measures in Packaging Industry Growth Trends & Insights
The anti-counterfeit measures market is experiencing robust growth, driven by increasing counterfeiting activities and rising consumer demand for authenticity. The market size exhibited a CAGR of xx% during the historical period (2019-2024), and is projected to grow at a CAGR of xx% during the forecast period (2025-2033). This growth is fueled by technological advancements, rising adoption rates across various end-user segments, and increasing consumer awareness about counterfeit products. Market penetration is expected to increase significantly, especially in developing economies. Technological disruptions, such as the integration of AI and IoT, are further accelerating growth and creating new market opportunities.
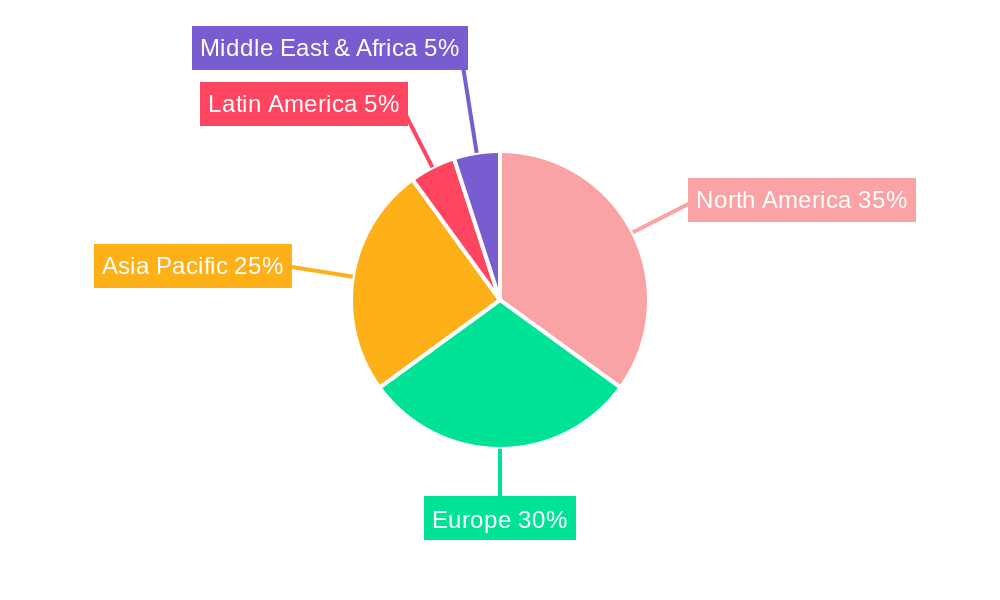
Dominant Regions, Countries, or Segments in Anti-Counterfeit Measures in Packaging Industry
North America and Europe currently dominate the market, driven by robust regulatory frameworks and high consumer awareness. However, Asia-Pacific is experiencing rapid growth due to increasing counterfeiting activities and rising disposable incomes. Within technology segments, Trace and Track solutions hold the largest market share, followed by tamper-evident and overt technologies. In end-user segments, Healthcare and Pharmaceuticals and Food and Beverage are the leading drivers.
- Leading Region: North America (xx% market share in 2024)
- Fastest Growing Region: Asia-Pacific (xx% CAGR projected for 2025-2033)
- Dominant Technology Segment: Trace and Track (xx% market share in 2024)
- Leading End-User Segment: Healthcare and Pharmaceuticals (xx% market share in 2024)
- Key Drivers: Stringent regulations (North America, Europe), rising consumer awareness, economic growth (Asia-Pacific).
Anti-Counterfeit Measures in Packaging Industry Product Landscape
The product landscape is characterized by a wide range of technologies, including RFID tags, holograms, unique identifiers, and forensic markers. Recent innovations focus on enhancing security, improving traceability, and simplifying verification processes. Companies are emphasizing user-friendly solutions that integrate seamlessly into existing packaging workflows. Performance metrics focus on detection accuracy, ease of use, and cost-effectiveness. Unique selling propositions include improved security features, enhanced traceability, and real-time verification capabilities.
Key Drivers, Barriers & Challenges in Anti-Counterfeit Measures in Packaging Industry
Key Drivers: Increasing instances of product counterfeiting, stringent government regulations, rising consumer demand for authenticity, and technological advancements (e.g., blockchain, AI).
Key Challenges & Restraints: High implementation costs, lack of standardization across industries, complexities in integrating new technologies into existing supply chains, and the potential for counterfeiters to adapt to new technologies. These challenges could potentially reduce market growth by approximately xx% by 2033 if not addressed effectively.
Emerging Opportunities in Anti Counterfeit Measures in Packaging Industry
Untapped markets in developing economies present significant opportunities. Growth is also expected in innovative applications, such as using advanced materials and integrating anti-counterfeiting measures directly into product design. The rising demand for sustainable packaging solutions is creating opportunities for eco-friendly anti-counterfeiting technologies.
Growth Accelerators in the Anti Counterfeit Measures in Packaging Industry Industry
Technological breakthroughs, particularly in areas like AI and blockchain, are key growth accelerators. Strategic partnerships between technology providers and packaging companies will further stimulate market expansion. Expansion into new geographic markets, especially in developing countries with high counterfeiting rates, represents significant growth potential.
Key Players Shaping the Anti Counterfeit Measures in Packaging Industry Market
- PharmaSecure Inc
- AlpVision SA
- Uflex Limited
- Sicpa Holding SA
- 3M Company
- CCL Industries Inc
- Avery Dennison Corporation
- Applied DNA Sciences Inc
- Authentix Inc
- Zebra Technologies Corporation
- E I Du Pont De Nemours and Company
- Ampacet Corporation
Notable Milestones in Anti Counterfeit Measures in Packaging Industry Sector
- August 2021: Avery Dennison Corporation acquired Vestcom for USD 1.45 billion, expanding its branded labeling offerings.
In-Depth Anti Counterfeit Measures in Packaging Industry Market Outlook
The anti-counterfeit measures market is poised for significant growth, driven by continuous technological innovation, increasing regulatory pressures, and rising consumer demand for product authenticity. Strategic partnerships, market expansion into new geographic territories, and the development of sustainable solutions will be key factors in shaping the market's future. The market holds immense potential for growth in the coming years, presenting lucrative opportunities for both established players and new entrants.
Anti Counterfeit Measures in Packaging Industry Segmentation
-
1. Technology
- 1.1. Trace and Track
- 1.2. Tamper-evident
- 1.3. Covert
- 1.4. Overt
- 1.5. Forensic Markers
-
2. End User
- 2.1. Food and Beverage
- 2.2. Healthcare and Pharmaceuticals
- 2.3. Industrial and Automotive
- 2.4. Consumer Electronics
- 2.5. Other End Users
Anti Counterfeit Measures in Packaging Industry Segmentation By Geography
-
1. North America
- 1.1. United States
- 1.2. Canada
-
2. Europe
- 2.1. United Kingdom
- 2.2. Germany
- 2.3. France
- 2.4. Italy
- 2.5. Spain
- 2.6. Rest of Europe
-
3. Asia Pacific
- 3.1. China
- 3.2. India
- 3.3. Japan
- 3.4. Australia
- 3.5. Rest of Asia Pacific
-
4. Latin America
- 4.1. Brazil
- 4.2. Argentina
- 4.3. Rest of Latin America
- 5. Middle East
-
6. South Africa
- 6.1. United Arab Emirates
- 6.2. Rest of Middle East
Anti Counterfeit Measures in Packaging Industry Regional Market Share
Geographic Coverage of Anti Counterfeit Measures in Packaging Industry
Anti Counterfeit Measures in Packaging Industry REPORT HIGHLIGHTS
| Aspects | Details |
|---|---|
| Study Period | 2020-2034 |
| Base Year | 2025 |
| Estimated Year | 2026 |
| Forecast Period | 2026-2034 |
| Historical Period | 2020-2025 |
| Growth Rate | CAGR of 9.4% from 2020-2034 |
| Segmentation |
|
Table of Contents
- 1. Introduction
- 1.1. Research Scope
- 1.2. Market Segmentation
- 1.3. Research Objective
- 1.4. Definitions and Assumptions
- 2. Executive Summary
- 2.1. Market Snapshot
- 3. Market Dynamics
- 3.1. Market Drivers
- 3.2. Market Restrains
- 3.3. Market Trends
- 3.4. Market Opportunities
- 4. Market Factor Analysis
- 4.1. Porters Five Forces
- 4.1.1. Bargaining Power of Suppliers
- 4.1.2. Bargaining Power of Buyers
- 4.1.3. Threat of New Entrants
- 4.1.4. Threat of Substitutes
- 4.1.5. Competitive Rivalry
- 4.2. PESTEL analysis
- 4.3. BCG Analysis
- 4.3.1. Stars (High Growth, High Market Share)
- 4.3.2. Cash Cows (Low Growth, High Market Share)
- 4.3.3. Question Mark (High Growth, Low Market Share)
- 4.3.4. Dogs (Low Growth, Low Market Share)
- 4.4. Ansoff Matrix Analysis
- 4.5. Supply Chain Analysis
- 4.6. Regulatory Landscape
- 4.7. Current Market Potential and Opportunity Assessment (TAM–SAM–SOM Framework)
- 4.8. NRP Analyst Note
- 4.1. Porters Five Forces
- 5. Market Analysis, Insights and Forecast 2021-2033
- 5.1. Market Analysis, Insights and Forecast - by Technology
- 5.1.1. Trace and Track
- 5.1.2. Tamper-evident
- 5.1.3. Covert
- 5.1.4. Overt
- 5.1.5. Forensic Markers
- 5.2. Market Analysis, Insights and Forecast - by End User
- 5.2.1. Food and Beverage
- 5.2.2. Healthcare and Pharmaceuticals
- 5.2.3. Industrial and Automotive
- 5.2.4. Consumer Electronics
- 5.2.5. Other End Users
- 5.3. Market Analysis, Insights and Forecast - by Region
- 5.3.1. North America
- 5.3.2. Europe
- 5.3.3. Asia Pacific
- 5.3.4. Latin America
- 5.3.5. Middle East
- 5.3.6. South Africa
- 5.1. Market Analysis, Insights and Forecast - by Technology
- 6. Global Anti Counterfeit Measures in Packaging Industry Analysis, Insights and Forecast, 2021-2033
- 6.1. Market Analysis, Insights and Forecast - by Technology
- 6.1.1. Trace and Track
- 6.1.2. Tamper-evident
- 6.1.3. Covert
- 6.1.4. Overt
- 6.1.5. Forensic Markers
- 6.2. Market Analysis, Insights and Forecast - by End User
- 6.2.1. Food and Beverage
- 6.2.2. Healthcare and Pharmaceuticals
- 6.2.3. Industrial and Automotive
- 6.2.4. Consumer Electronics
- 6.2.5. Other End Users
- 6.1. Market Analysis, Insights and Forecast - by Technology
- 7. North America Anti Counterfeit Measures in Packaging Industry Analysis, Insights and Forecast, 2020-2032
- 7.1. Market Analysis, Insights and Forecast - by Technology
- 7.1.1. Trace and Track
- 7.1.2. Tamper-evident
- 7.1.3. Covert
- 7.1.4. Overt
- 7.1.5. Forensic Markers
- 7.2. Market Analysis, Insights and Forecast - by End User
- 7.2.1. Food and Beverage
- 7.2.2. Healthcare and Pharmaceuticals
- 7.2.3. Industrial and Automotive
- 7.2.4. Consumer Electronics
- 7.2.5. Other End Users
- 7.1. Market Analysis, Insights and Forecast - by Technology
- 8. Europe Anti Counterfeit Measures in Packaging Industry Analysis, Insights and Forecast, 2020-2032
- 8.1. Market Analysis, Insights and Forecast - by Technology
- 8.1.1. Trace and Track
- 8.1.2. Tamper-evident
- 8.1.3. Covert
- 8.1.4. Overt
- 8.1.5. Forensic Markers
- 8.2. Market Analysis, Insights and Forecast - by End User
- 8.2.1. Food and Beverage
- 8.2.2. Healthcare and Pharmaceuticals
- 8.2.3. Industrial and Automotive
- 8.2.4. Consumer Electronics
- 8.2.5. Other End Users
- 8.1. Market Analysis, Insights and Forecast - by Technology
- 9. Asia Pacific Anti Counterfeit Measures in Packaging Industry Analysis, Insights and Forecast, 2020-2032
- 9.1. Market Analysis, Insights and Forecast - by Technology
- 9.1.1. Trace and Track
- 9.1.2. Tamper-evident
- 9.1.3. Covert
- 9.1.4. Overt
- 9.1.5. Forensic Markers
- 9.2. Market Analysis, Insights and Forecast - by End User
- 9.2.1. Food and Beverage
- 9.2.2. Healthcare and Pharmaceuticals
- 9.2.3. Industrial and Automotive
- 9.2.4. Consumer Electronics
- 9.2.5. Other End Users
- 9.1. Market Analysis, Insights and Forecast - by Technology
- 10. Latin America Anti Counterfeit Measures in Packaging Industry Analysis, Insights and Forecast, 2020-2032
- 10.1. Market Analysis, Insights and Forecast - by Technology
- 10.1.1. Trace and Track
- 10.1.2. Tamper-evident
- 10.1.3. Covert
- 10.1.4. Overt
- 10.1.5. Forensic Markers
- 10.2. Market Analysis, Insights and Forecast - by End User
- 10.2.1. Food and Beverage
- 10.2.2. Healthcare and Pharmaceuticals
- 10.2.3. Industrial and Automotive
- 10.2.4. Consumer Electronics
- 10.2.5. Other End Users
- 10.1. Market Analysis, Insights and Forecast - by Technology
- 11. Middle East Anti Counterfeit Measures in Packaging Industry Analysis, Insights and Forecast, 2020-2032
- 11.1. Market Analysis, Insights and Forecast - by Technology
- 11.1.1. Trace and Track
- 11.1.2. Tamper-evident
- 11.1.3. Covert
- 11.1.4. Overt
- 11.1.5. Forensic Markers
- 11.2. Market Analysis, Insights and Forecast - by End User
- 11.2.1. Food and Beverage
- 11.2.2. Healthcare and Pharmaceuticals
- 11.2.3. Industrial and Automotive
- 11.2.4. Consumer Electronics
- 11.2.5. Other End Users
- 11.1. Market Analysis, Insights and Forecast - by Technology
- 12. South Africa Anti Counterfeit Measures in Packaging Industry Analysis, Insights and Forecast, 2020-2032
- 12.1. Market Analysis, Insights and Forecast - by Technology
- 12.1.1. Trace and Track
- 12.1.2. Tamper-evident
- 12.1.3. Covert
- 12.1.4. Overt
- 12.1.5. Forensic Markers
- 12.2. Market Analysis, Insights and Forecast - by End User
- 12.2.1. Food and Beverage
- 12.2.2. Healthcare and Pharmaceuticals
- 12.2.3. Industrial and Automotive
- 12.2.4. Consumer Electronics
- 12.2.5. Other End Users
- 12.1. Market Analysis, Insights and Forecast - by Technology
- 13. Competitive Analysis
- 13.1. Company Profiles
- 13.1.1 PharmaSecure Inc *List Not Exhaustive
- 13.1.1.1. Company Overview
- 13.1.1.2. Products
- 13.1.1.3. Company Financials
- 13.1.1.4. SWOT Analysis
- 13.1.2 AlpVision SA
- 13.1.2.1. Company Overview
- 13.1.2.2. Products
- 13.1.2.3. Company Financials
- 13.1.2.4. SWOT Analysis
- 13.1.3 Uflex Limited
- 13.1.3.1. Company Overview
- 13.1.3.2. Products
- 13.1.3.3. Company Financials
- 13.1.3.4. SWOT Analysis
- 13.1.4 Sicpa Holding SA
- 13.1.4.1. Company Overview
- 13.1.4.2. Products
- 13.1.4.3. Company Financials
- 13.1.4.4. SWOT Analysis
- 13.1.5 3M Company
- 13.1.5.1. Company Overview
- 13.1.5.2. Products
- 13.1.5.3. Company Financials
- 13.1.5.4. SWOT Analysis
- 13.1.6 CCL Industries Inc
- 13.1.6.1. Company Overview
- 13.1.6.2. Products
- 13.1.6.3. Company Financials
- 13.1.6.4. SWOT Analysis
- 13.1.7 Avery Dennison Corporation
- 13.1.7.1. Company Overview
- 13.1.7.2. Products
- 13.1.7.3. Company Financials
- 13.1.7.4. SWOT Analysis
- 13.1.8 Applied Dna Sciences Inc
- 13.1.8.1. Company Overview
- 13.1.8.2. Products
- 13.1.8.3. Company Financials
- 13.1.8.4. SWOT Analysis
- 13.1.9 Authentix Inc
- 13.1.9.1. Company Overview
- 13.1.9.2. Products
- 13.1.9.3. Company Financials
- 13.1.9.4. SWOT Analysis
- 13.1.10 Zebra Technologies Corporation
- 13.1.10.1. Company Overview
- 13.1.10.2. Products
- 13.1.10.3. Company Financials
- 13.1.10.4. SWOT Analysis
- 13.1.11 E I Du Pont De Nemours and Company
- 13.1.11.1. Company Overview
- 13.1.11.2. Products
- 13.1.11.3. Company Financials
- 13.1.11.4. SWOT Analysis
- 13.1.12 Ampacet Corporation
- 13.1.12.1. Company Overview
- 13.1.12.2. Products
- 13.1.12.3. Company Financials
- 13.1.12.4. SWOT Analysis
- 13.1.1 PharmaSecure Inc *List Not Exhaustive
- 13.2. Market Entropy
- 13.2.1 Company's Key Areas Served
- 13.2.2 Recent Developments
- 13.3. Company Market Share Analysis 2025
- 13.3.1 Top 5 Companies Market Share Analysis
- 13.3.2 Top 3 Companies Market Share Analysis
- 13.4. List of Potential Customers
- 14. Research Methodology
List of Figures
- Figure 1: Global Anti Counterfeit Measures in Packaging Industry Revenue Breakdown (billion, %) by Region 2025 & 2033
- Figure 2: North America Anti Counterfeit Measures in Packaging Industry Revenue (billion), by Technology 2025 & 2033
- Figure 3: North America Anti Counterfeit Measures in Packaging Industry Revenue Share (%), by Technology 2025 & 2033
- Figure 4: North America Anti Counterfeit Measures in Packaging Industry Revenue (billion), by End User 2025 & 2033
- Figure 5: North America Anti Counterfeit Measures in Packaging Industry Revenue Share (%), by End User 2025 & 2033
- Figure 6: North America Anti Counterfeit Measures in Packaging Industry Revenue (billion), by Country 2025 & 2033
- Figure 7: North America Anti Counterfeit Measures in Packaging Industry Revenue Share (%), by Country 2025 & 2033
- Figure 8: Europe Anti Counterfeit Measures in Packaging Industry Revenue (billion), by Technology 2025 & 2033
- Figure 9: Europe Anti Counterfeit Measures in Packaging Industry Revenue Share (%), by Technology 2025 & 2033
- Figure 10: Europe Anti Counterfeit Measures in Packaging Industry Revenue (billion), by End User 2025 & 2033
- Figure 11: Europe Anti Counterfeit Measures in Packaging Industry Revenue Share (%), by End User 2025 & 2033
- Figure 12: Europe Anti Counterfeit Measures in Packaging Industry Revenue (billion), by Country 2025 & 2033
- Figure 13: Europe Anti Counterfeit Measures in Packaging Industry Revenue Share (%), by Country 2025 & 2033
- Figure 14: Asia Pacific Anti Counterfeit Measures in Packaging Industry Revenue (billion), by Technology 2025 & 2033
- Figure 15: Asia Pacific Anti Counterfeit Measures in Packaging Industry Revenue Share (%), by Technology 2025 & 2033
- Figure 16: Asia Pacific Anti Counterfeit Measures in Packaging Industry Revenue (billion), by End User 2025 & 2033
- Figure 17: Asia Pacific Anti Counterfeit Measures in Packaging Industry Revenue Share (%), by End User 2025 & 2033
- Figure 18: Asia Pacific Anti Counterfeit Measures in Packaging Industry Revenue (billion), by Country 2025 & 2033
- Figure 19: Asia Pacific Anti Counterfeit Measures in Packaging Industry Revenue Share (%), by Country 2025 & 2033
- Figure 20: Latin America Anti Counterfeit Measures in Packaging Industry Revenue (billion), by Technology 2025 & 2033
- Figure 21: Latin America Anti Counterfeit Measures in Packaging Industry Revenue Share (%), by Technology 2025 & 2033
- Figure 22: Latin America Anti Counterfeit Measures in Packaging Industry Revenue (billion), by End User 2025 & 2033
- Figure 23: Latin America Anti Counterfeit Measures in Packaging Industry Revenue Share (%), by End User 2025 & 2033
- Figure 24: Latin America Anti Counterfeit Measures in Packaging Industry Revenue (billion), by Country 2025 & 2033
- Figure 25: Latin America Anti Counterfeit Measures in Packaging Industry Revenue Share (%), by Country 2025 & 2033
- Figure 26: Middle East Anti Counterfeit Measures in Packaging Industry Revenue (billion), by Technology 2025 & 2033
- Figure 27: Middle East Anti Counterfeit Measures in Packaging Industry Revenue Share (%), by Technology 2025 & 2033
- Figure 28: Middle East Anti Counterfeit Measures in Packaging Industry Revenue (billion), by End User 2025 & 2033
- Figure 29: Middle East Anti Counterfeit Measures in Packaging Industry Revenue Share (%), by End User 2025 & 2033
- Figure 30: Middle East Anti Counterfeit Measures in Packaging Industry Revenue (billion), by Country 2025 & 2033
- Figure 31: Middle East Anti Counterfeit Measures in Packaging Industry Revenue Share (%), by Country 2025 & 2033
- Figure 32: South Africa Anti Counterfeit Measures in Packaging Industry Revenue (billion), by Technology 2025 & 2033
- Figure 33: South Africa Anti Counterfeit Measures in Packaging Industry Revenue Share (%), by Technology 2025 & 2033
- Figure 34: South Africa Anti Counterfeit Measures in Packaging Industry Revenue (billion), by End User 2025 & 2033
- Figure 35: South Africa Anti Counterfeit Measures in Packaging Industry Revenue Share (%), by End User 2025 & 2033
- Figure 36: South Africa Anti Counterfeit Measures in Packaging Industry Revenue (billion), by Country 2025 & 2033
- Figure 37: South Africa Anti Counterfeit Measures in Packaging Industry Revenue Share (%), by Country 2025 & 2033
List of Tables
- Table 1: Global Anti Counterfeit Measures in Packaging Industry Revenue billion Forecast, by Technology 2020 & 2033
- Table 2: Global Anti Counterfeit Measures in Packaging Industry Revenue billion Forecast, by End User 2020 & 2033
- Table 3: Global Anti Counterfeit Measures in Packaging Industry Revenue billion Forecast, by Region 2020 & 2033
- Table 4: Global Anti Counterfeit Measures in Packaging Industry Revenue billion Forecast, by Technology 2020 & 2033
- Table 5: Global Anti Counterfeit Measures in Packaging Industry Revenue billion Forecast, by End User 2020 & 2033
- Table 6: Global Anti Counterfeit Measures in Packaging Industry Revenue billion Forecast, by Country 2020 & 2033
- Table 7: United States Anti Counterfeit Measures in Packaging Industry Revenue (billion) Forecast, by Application 2020 & 2033
- Table 8: Canada Anti Counterfeit Measures in Packaging Industry Revenue (billion) Forecast, by Application 2020 & 2033
- Table 9: Global Anti Counterfeit Measures in Packaging Industry Revenue billion Forecast, by Technology 2020 & 2033
- Table 10: Global Anti Counterfeit Measures in Packaging Industry Revenue billion Forecast, by End User 2020 & 2033
- Table 11: Global Anti Counterfeit Measures in Packaging Industry Revenue billion Forecast, by Country 2020 & 2033
- Table 12: United Kingdom Anti Counterfeit Measures in Packaging Industry Revenue (billion) Forecast, by Application 2020 & 2033
- Table 13: Germany Anti Counterfeit Measures in Packaging Industry Revenue (billion) Forecast, by Application 2020 & 2033
- Table 14: France Anti Counterfeit Measures in Packaging Industry Revenue (billion) Forecast, by Application 2020 & 2033
- Table 15: Italy Anti Counterfeit Measures in Packaging Industry Revenue (billion) Forecast, by Application 2020 & 2033
- Table 16: Spain Anti Counterfeit Measures in Packaging Industry Revenue (billion) Forecast, by Application 2020 & 2033
- Table 17: Rest of Europe Anti Counterfeit Measures in Packaging Industry Revenue (billion) Forecast, by Application 2020 & 2033
- Table 18: Global Anti Counterfeit Measures in Packaging Industry Revenue billion Forecast, by Technology 2020 & 2033
- Table 19: Global Anti Counterfeit Measures in Packaging Industry Revenue billion Forecast, by End User 2020 & 2033
- Table 20: Global Anti Counterfeit Measures in Packaging Industry Revenue billion Forecast, by Country 2020 & 2033
- Table 21: China Anti Counterfeit Measures in Packaging Industry Revenue (billion) Forecast, by Application 2020 & 2033
- Table 22: India Anti Counterfeit Measures in Packaging Industry Revenue (billion) Forecast, by Application 2020 & 2033
- Table 23: Japan Anti Counterfeit Measures in Packaging Industry Revenue (billion) Forecast, by Application 2020 & 2033
- Table 24: Australia Anti Counterfeit Measures in Packaging Industry Revenue (billion) Forecast, by Application 2020 & 2033
- Table 25: Rest of Asia Pacific Anti Counterfeit Measures in Packaging Industry Revenue (billion) Forecast, by Application 2020 & 2033
- Table 26: Global Anti Counterfeit Measures in Packaging Industry Revenue billion Forecast, by Technology 2020 & 2033
- Table 27: Global Anti Counterfeit Measures in Packaging Industry Revenue billion Forecast, by End User 2020 & 2033
- Table 28: Global Anti Counterfeit Measures in Packaging Industry Revenue billion Forecast, by Country 2020 & 2033
- Table 29: Brazil Anti Counterfeit Measures in Packaging Industry Revenue (billion) Forecast, by Application 2020 & 2033
- Table 30: Argentina Anti Counterfeit Measures in Packaging Industry Revenue (billion) Forecast, by Application 2020 & 2033
- Table 31: Rest of Latin America Anti Counterfeit Measures in Packaging Industry Revenue (billion) Forecast, by Application 2020 & 2033
- Table 32: Global Anti Counterfeit Measures in Packaging Industry Revenue billion Forecast, by Technology 2020 & 2033
- Table 33: Global Anti Counterfeit Measures in Packaging Industry Revenue billion Forecast, by End User 2020 & 2033
- Table 34: Global Anti Counterfeit Measures in Packaging Industry Revenue billion Forecast, by Country 2020 & 2033
- Table 35: Global Anti Counterfeit Measures in Packaging Industry Revenue billion Forecast, by Technology 2020 & 2033
- Table 36: Global Anti Counterfeit Measures in Packaging Industry Revenue billion Forecast, by End User 2020 & 2033
- Table 37: Global Anti Counterfeit Measures in Packaging Industry Revenue billion Forecast, by Country 2020 & 2033
- Table 38: United Arab Emirates Anti Counterfeit Measures in Packaging Industry Revenue (billion) Forecast, by Application 2020 & 2033
- Table 39: Rest of Middle East Anti Counterfeit Measures in Packaging Industry Revenue (billion) Forecast, by Application 2020 & 2033
Frequently Asked Questions
1. What is the projected Compound Annual Growth Rate (CAGR) of the Anti Counterfeit Measures in Packaging Industry?
The projected CAGR is approximately 9.4%.
2. Which companies are prominent players in the Anti Counterfeit Measures in Packaging Industry?
Key companies in the market include PharmaSecure Inc *List Not Exhaustive, AlpVision SA, Uflex Limited, Sicpa Holding SA, 3M Company, CCL Industries Inc, Avery Dennison Corporation, Applied Dna Sciences Inc, Authentix Inc, Zebra Technologies Corporation, E I Du Pont De Nemours and Company, Ampacet Corporation.
3. What are the main segments of the Anti Counterfeit Measures in Packaging Industry?
The market segments include Technology, End User.
4. Can you provide details about the market size?
The market size is estimated to be USD 204.08 billion as of 2022.
5. What are some drivers contributing to market growth?
Booming E-commerce Industry; Increasing Focus of Manufacturers on Brand Protection.
6. What are the notable trends driving market growth?
Pharmaceuticals and Healthcare to Drive the Market Demand.
7. Are there any restraints impacting market growth?
High-initial Costs.
8. Can you provide examples of recent developments in the market?
In August 2021, - Avery Dennison Corporation acquired Vestcom for an investment of USD 1.45 billion. The acquisition will help the company expand its branded labeling offerings for retail and consumer packaged goods industries.
9. What pricing options are available for accessing the report?
Pricing options include single-user, multi-user, and enterprise licenses priced at USD 4750, USD 5250, and USD 8750 respectively.
10. Is the market size provided in terms of value or volume?
The market size is provided in terms of value, measured in billion.
11. Are there any specific market keywords associated with the report?
Yes, the market keyword associated with the report is "Anti Counterfeit Measures in Packaging Industry," which aids in identifying and referencing the specific market segment covered.
12. How do I determine which pricing option suits my needs best?
The pricing options vary based on user requirements and access needs. Individual users may opt for single-user licenses, while businesses requiring broader access may choose multi-user or enterprise licenses for cost-effective access to the report.
13. Are there any additional resources or data provided in the Anti Counterfeit Measures in Packaging Industry report?
While the report offers comprehensive insights, it's advisable to review the specific contents or supplementary materials provided to ascertain if additional resources or data are available.
14. How can I stay updated on further developments or reports in the Anti Counterfeit Measures in Packaging Industry?
To stay informed about further developments, trends, and reports in the Anti Counterfeit Measures in Packaging Industry, consider subscribing to industry newsletters, following relevant companies and organizations, or regularly checking reputable industry news sources and publications.
Methodology
Step 1 - Identification of Relevant Samples Size from Population Database


Step 2 - Approaches for Defining Global Market Size (Value, Volume* & Price*)

Note*: In applicable scenarios
Step 3 - Data Sources
Primary Research
- Web Analytics
- Survey Reports
- Research Institute
- Latest Research Reports
- Opinion Leaders
Secondary Research
- Annual Reports
- White Paper
- Latest Press Release
- Industry Association
- Paid Database
- Investor Presentations

Step 4 - Data Triangulation
Involves using different sources of information in order to increase the validity of a study
These sources are likely to be stakeholders in a program - participants, other researchers, program staff, other community members, and so on.
Then we put all data in single framework & apply various statistical tools to find out the dynamic on the market.
During the analysis stage, feedback from the stakeholder groups would be compared to determine areas of agreement as well as areas of divergence