

Key Insights
The Asia Pacific metal cans market is poised for significant expansion, fueled by robust demand for packaged food and beverages, including alcoholic and non-alcoholic drinks, and aerosol products. Key growth drivers include a burgeoning population, rising disposable incomes, and a consumer preference for convenient, shelf-stable packaging. Aluminum is a dominant material, favored for its lightweight properties and recyclability, alongside steel. China, India, and South Korea are major contributors due to their substantial manufacturing and consumer bases. Potential challenges include volatile raw material prices and waste management concerns. Leading players such as Ball Corporation, Amcor, and Crown Holdings, along with regional manufacturers, are actively competing. Strategic investments in innovative designs, sustainable solutions, and advanced production are essential for sustained growth.
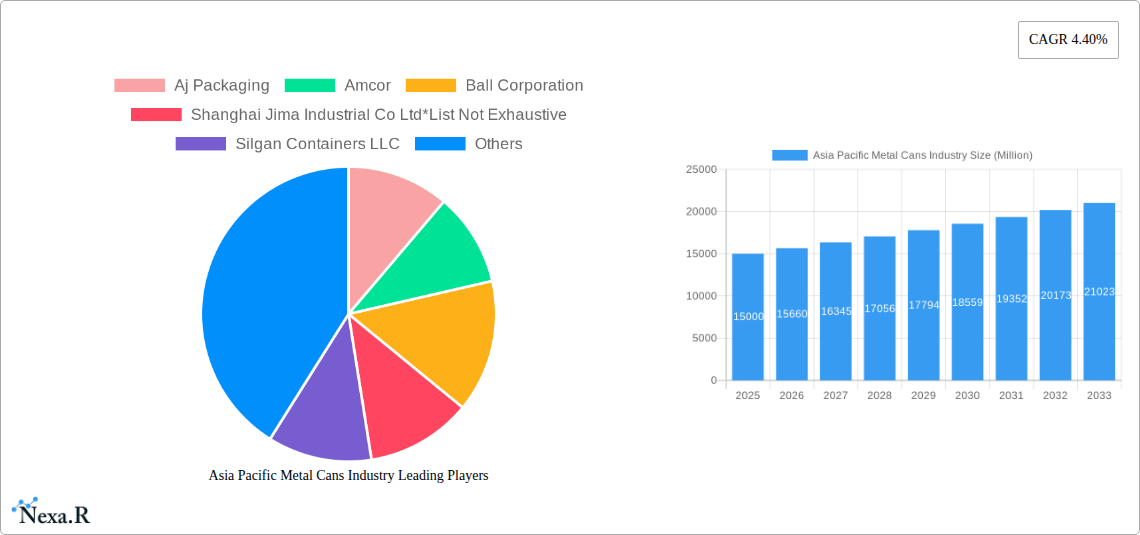
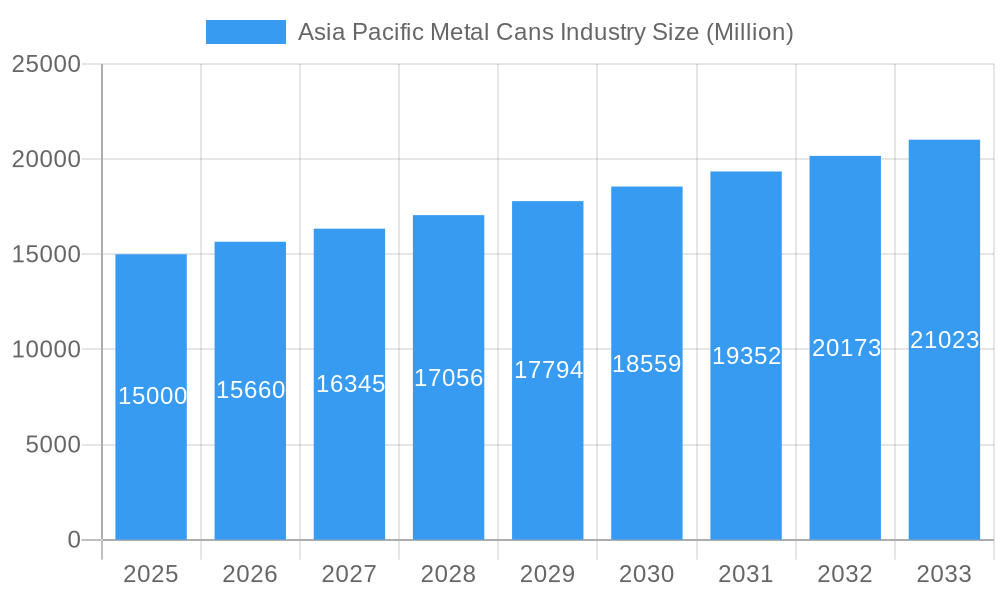
Asia Pacific Metal Cans Industry Market Size (In Billion)
The Asia Pacific metal cans market is projected to achieve a Compound Annual Growth Rate (CAGR) of 6.9%. The market size was estimated at 16098.8 million in the base year of 2024. Continued strong growth drivers and regional dynamics will propel the market. The focus on sustainable practices by key industry participants is vital for addressing environmental considerations and ensuring long-term market viability. Intense competition necessitates ongoing innovation and adaptation to evolving consumer demands and technological advancements.
Asia Pacific Metal Cans Industry Company Market Share
Asia Pacific Metal Cans Industry: Market Analysis Report (2019-2033)
This comprehensive report provides a detailed analysis of the Asia Pacific metal cans industry, encompassing market dynamics, growth trends, key players, and future outlook. The study period covers 2019-2033, with a base year of 2025 and a forecast period of 2025-2033. This report is invaluable for industry professionals, investors, and strategic decision-makers seeking a deep understanding of this dynamic market. The report analyzes key segments including food cans, beverage cans (alcoholic and non-alcoholic), aerosol cans, and other end-use industries, across major countries like India, China, and South Korea, and materials like aluminum and steel.
Asia Pacific Metal Cans Industry Market Dynamics & Structure
The Asia Pacific metal cans industry is characterized by a moderately concentrated market structure with key players such as Amcor, Ball Corporation, Crown Holdings, and Silgan Containers LLC holding significant market share. Technological innovation, driven by the need for cost reduction and sustainability, is a primary market driver. Stringent regulatory frameworks regarding food safety and environmental concerns influence manufacturing processes and material selection. The industry faces competition from alternative packaging solutions, such as plastic and flexible packaging. The end-user demographics are diverse, spanning food and beverage companies, personal care brands, and other industrial applications. M&A activity has been moderate, with strategic acquisitions focused on expanding geographic reach and product portfolios. The estimated market size in 2025 is xx million units.
- Market Concentration: Moderately concentrated, with top players holding approximately xx% market share in 2025.
- Technological Innovation: Focus on lightweighting, improved coatings, and sustainable materials.
- Regulatory Landscape: Stringent food safety regulations and environmental compliance standards.
- Competitive Substitutes: Plastic and flexible packaging pose a significant competitive threat.
- M&A Activity: Moderate level of mergers and acquisitions aimed at expansion and diversification.
- Innovation Barriers: High R&D costs and the need for specialized equipment.
Asia Pacific Metal Cans Industry Growth Trends & Insights
The Asia Pacific metal cans market has experienced robust growth over the historical period (2019-2024), driven by rising consumption of packaged food and beverages, particularly in developing economies like India and China. The market is projected to maintain a healthy Compound Annual Growth Rate (CAGR) of xx% during the forecast period (2025-2033), reaching xx million units by 2033. This growth is fueled by increasing urbanization, changing lifestyles, and rising disposable incomes. Technological advancements, such as the adoption of lightweighting technologies and improved can coatings, contribute to enhanced efficiency and sustainability. Shifting consumer preferences towards convenient and safe packaging solutions also boost market demand. Market penetration in several segments remains relatively high, indicating further growth potential lies in market expansion and innovation.
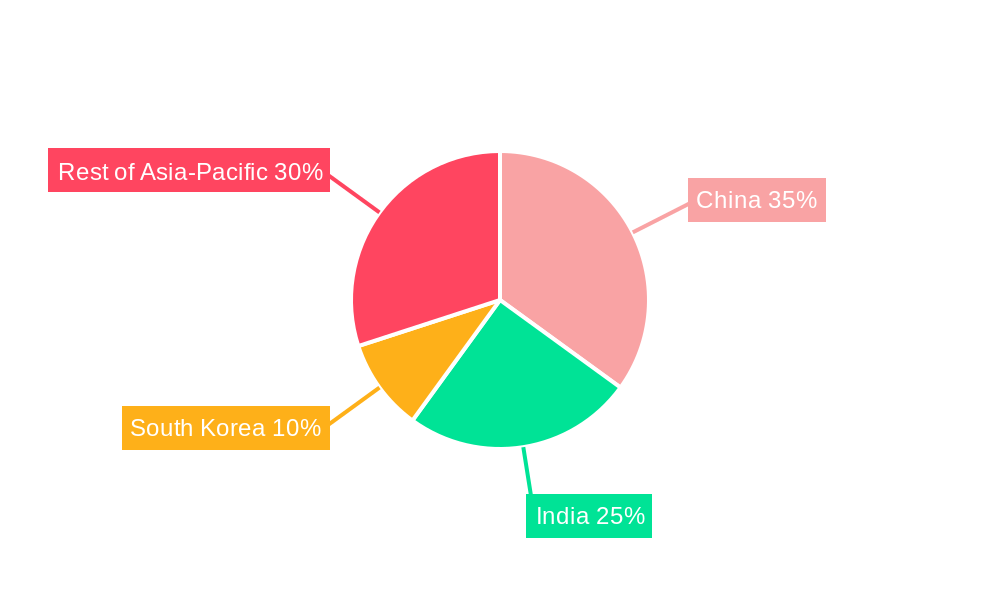
Dominant Regions, Countries, or Segments in Asia Pacific Metal Cans Industry
China dominates the Asia Pacific metal cans market, accounting for the largest market share in 2025 (xx%). This dominance stems from a large and growing population, a robust food and beverage industry, and significant manufacturing capacity. India represents another major market with high growth potential due to rapid economic development and rising consumer spending. Within product segments, food cans hold the largest market share, followed by beverage cans and aerosol cans. Aluminum is currently the more prevalent material.
- Key Drivers for China: Large consumer base, extensive manufacturing infrastructure, and robust food and beverage sector.
- Key Drivers for India: Rapid economic growth, rising disposable incomes, and increasing urbanization.
- Segment Dominance: Food cans (xx million units in 2025) leading the market due to extensive use in food preservation and distribution.
- Material Type: Aluminum and steel are the major materials, with aluminum gaining traction due to its lightweight nature and recyclability.
Asia Pacific Metal Cans Industry Product Landscape
The Asia Pacific metal cans industry features a diverse range of products, catering to various end-user needs. Innovations include lightweight cans, improved coatings for enhanced shelf life and durability, and easy-open features. These advancements focus on improving product performance, reducing material usage, and enhancing sustainability. Unique selling propositions include superior barrier properties, ensuring product freshness and quality, while technological advancements drive down production costs and enhance environmental performance.
Key Drivers, Barriers & Challenges in Asia Pacific Metal Cans Industry
Key Drivers:
- Increasing demand for packaged food and beverages
- Growing popularity of convenient and ready-to-eat meals
- Technological advancements in can manufacturing and design
- Favorable government regulations and policies
Key Challenges:
- Fluctuations in raw material prices (e.g., aluminum and steel)
- Intense competition from alternative packaging materials
- Environmental concerns and the need for sustainable packaging solutions
- Supply chain disruptions
Emerging Opportunities in Asia Pacific Metal Cans Industry
Emerging opportunities include expanding into untapped markets in Southeast Asia, developing innovative can designs for niche products, and focusing on sustainable and eco-friendly packaging solutions. The rising demand for premium and functional beverages is driving innovation and opening up new market segments for metal cans. Furthermore, the increasing adoption of e-commerce and online food delivery services presents opportunities for customized can designs and logistical improvements.
Growth Accelerators in the Asia Pacific Metal Cans Industry
Long-term growth will be driven by technological breakthroughs in lightweighting and sustainable materials, strategic partnerships with major food and beverage companies, and targeted market expansion strategies into high-growth economies. Innovation in can coatings and functional designs will further enhance the attractiveness of metal cans.
Key Players Shaping the Asia Pacific Metal Cans Industry Market
- Aj Packaging
- Amcor
- Ball Corporation
- Shanghai Jima Industrial Co Ltd
- Silgan Containers LLC
- Crown Holdings
- EBI Packaging
- BWAY
Notable Milestones in Asia Pacific Metal Cans Industry Sector
- February 2021: Sunrise Group's can testing laboratory achieves PepsiCo accreditation, driving industry-wide focus on cost reduction and technological advancements in can production.
In-Depth Asia Pacific Metal Cans Industry Market Outlook
The Asia Pacific metal cans industry is poised for continued growth, driven by rising consumption, technological innovation, and strategic investments. Opportunities exist in sustainable packaging solutions, niche market penetration, and strategic partnerships to capture increased market share. The focus on lightweighting, improved barrier properties, and eco-friendly designs will further propel market growth and enhance the competitiveness of metal cans in the broader packaging landscape.
Asia Pacific Metal Cans Industry Segmentation
-
1. Material Type
- 1.1. Aluminum
- 1.2. Steel
-
2. Can Types
-
2.1. Food
- 2.1.1. Vegetables
- 2.1.2. Fruits
- 2.1.3. Pet Food
- 2.1.4. Soups
- 2.1.5. Coffee
- 2.1.6. Other Types of Food Cans
-
2.2. Beverage
- 2.2.1. Alcoholic Beverages
- 2.2.2. Non-alcoholic Beverages
-
2.3. Aerosol
- 2.3.1. Cosmetic and Personal Care
- 2.3.2. Household
- 2.3.3. Pharmaceutical/Veterinary
- 2.3.4. Paints and Varnishes
- 2.3.5. Automotive/Industrial
- 2.3.6. Other End-user Industries
- 2.4. Other Can Types
-
2.1. Food
Asia Pacific Metal Cans Industry Segmentation By Geography
-
1. Asia Pacific
- 1.1. China
- 1.2. Japan
- 1.3. South Korea
- 1.4. India
- 1.5. Australia
- 1.6. New Zealand
- 1.7. Indonesia
- 1.8. Malaysia
- 1.9. Singapore
- 1.10. Thailand
- 1.11. Vietnam
- 1.12. Philippines
Asia Pacific Metal Cans Industry Regional Market Share
Geographic Coverage of Asia Pacific Metal Cans Industry
Asia Pacific Metal Cans Industry REPORT HIGHLIGHTS
| Aspects | Details |
|---|---|
| Study Period | 2020-2034 |
| Base Year | 2025 |
| Estimated Year | 2026 |
| Forecast Period | 2026-2034 |
| Historical Period | 2020-2025 |
| Growth Rate | CAGR of 6.9% from 2020-2034 |
| Segmentation |
|
Table of Contents
- 1. Introduction
- 1.1. Research Scope
- 1.2. Market Segmentation
- 1.3. Research Objective
- 1.4. Definitions and Assumptions
- 2. Executive Summary
- 2.1. Market Snapshot
- 3. Market Dynamics
- 3.1. Market Drivers
- 3.2. Market Restrains
- 3.3. Market Trends
- 3.4. Market Opportunities
- 4. Market Factor Analysis
- 4.1. Porters Five Forces
- 4.1.1. Bargaining Power of Suppliers
- 4.1.2. Bargaining Power of Buyers
- 4.1.3. Threat of New Entrants
- 4.1.4. Threat of Substitutes
- 4.1.5. Competitive Rivalry
- 4.2. PESTEL analysis
- 4.3. BCG Analysis
- 4.3.1. Stars (High Growth, High Market Share)
- 4.3.2. Cash Cows (Low Growth, High Market Share)
- 4.3.3. Question Mark (High Growth, Low Market Share)
- 4.3.4. Dogs (Low Growth, Low Market Share)
- 4.4. Ansoff Matrix Analysis
- 4.5. Supply Chain Analysis
- 4.6. Regulatory Landscape
- 4.7. Current Market Potential and Opportunity Assessment (TAM–SAM–SOM Framework)
- 4.8. NRP Analyst Note
- 4.1. Porters Five Forces
- 5. Market Analysis, Insights and Forecast 2021-2033
- 5.1. Market Analysis, Insights and Forecast - by Material Type
- 5.1.1. Aluminum
- 5.1.2. Steel
- 5.2. Market Analysis, Insights and Forecast - by Can Types
- 5.2.1. Food
- 5.2.1.1. Vegetables
- 5.2.1.2. Fruits
- 5.2.1.3. Pet Food
- 5.2.1.4. Soups
- 5.2.1.5. Coffee
- 5.2.1.6. Other Types of Food Cans
- 5.2.2. Beverage
- 5.2.2.1. Alcoholic Beverages
- 5.2.2.2. Non-alcoholic Beverages
- 5.2.3. Aerosol
- 5.2.3.1. Cosmetic and Personal Care
- 5.2.3.2. Household
- 5.2.3.3. Pharmaceutical/Veterinary
- 5.2.3.4. Paints and Varnishes
- 5.2.3.5. Automotive/Industrial
- 5.2.3.6. Other End-user Industries
- 5.2.4. Other Can Types
- 5.2.1. Food
- 5.3. Market Analysis, Insights and Forecast - by Region
- 5.3.1. Asia Pacific
- 5.1. Market Analysis, Insights and Forecast - by Material Type
- 6. Asia Pacific Metal Cans Industry Analysis, Insights and Forecast, 2021-2033
- 6.1. Market Analysis, Insights and Forecast - by Material Type
- 6.1.1. Aluminum
- 6.1.2. Steel
- 6.2. Market Analysis, Insights and Forecast - by Can Types
- 6.2.1. Food
- 6.2.1.1. Vegetables
- 6.2.1.2. Fruits
- 6.2.1.3. Pet Food
- 6.2.1.4. Soups
- 6.2.1.5. Coffee
- 6.2.1.6. Other Types of Food Cans
- 6.2.2. Beverage
- 6.2.2.1. Alcoholic Beverages
- 6.2.2.2. Non-alcoholic Beverages
- 6.2.3. Aerosol
- 6.2.3.1. Cosmetic and Personal Care
- 6.2.3.2. Household
- 6.2.3.3. Pharmaceutical/Veterinary
- 6.2.3.4. Paints and Varnishes
- 6.2.3.5. Automotive/Industrial
- 6.2.3.6. Other End-user Industries
- 6.2.4. Other Can Types
- 6.2.1. Food
- 6.1. Market Analysis, Insights and Forecast - by Material Type
- 7. Competitive Analysis
- 7.1. Company Profiles
- 7.1.1 Aj Packaging
- 7.1.1.1. Company Overview
- 7.1.1.2. Products
- 7.1.1.3. Company Financials
- 7.1.1.4. SWOT Analysis
- 7.1.2 Amcor
- 7.1.2.1. Company Overview
- 7.1.2.2. Products
- 7.1.2.3. Company Financials
- 7.1.2.4. SWOT Analysis
- 7.1.3 Ball Corporation
- 7.1.3.1. Company Overview
- 7.1.3.2. Products
- 7.1.3.3. Company Financials
- 7.1.3.4. SWOT Analysis
- 7.1.4 Shanghai Jima Industrial Co Ltd*List Not Exhaustive
- 7.1.4.1. Company Overview
- 7.1.4.2. Products
- 7.1.4.3. Company Financials
- 7.1.4.4. SWOT Analysis
- 7.1.5 Silgan Containers LLC
- 7.1.5.1. Company Overview
- 7.1.5.2. Products
- 7.1.5.3. Company Financials
- 7.1.5.4. SWOT Analysis
- 7.1.6 Crown Holdings
- 7.1.6.1. Company Overview
- 7.1.6.2. Products
- 7.1.6.3. Company Financials
- 7.1.6.4. SWOT Analysis
- 7.1.7 EBI Packaging
- 7.1.7.1. Company Overview
- 7.1.7.2. Products
- 7.1.7.3. Company Financials
- 7.1.7.4. SWOT Analysis
- 7.1.8 BWAY
- 7.1.8.1. Company Overview
- 7.1.8.2. Products
- 7.1.8.3. Company Financials
- 7.1.8.4. SWOT Analysis
- 7.1.1 Aj Packaging
- 7.2. Market Entropy
- 7.2.1 Company's Key Areas Served
- 7.2.2 Recent Developments
- 7.3. Company Market Share Analysis 2025
- 7.3.1 Top 5 Companies Market Share Analysis
- 7.3.2 Top 3 Companies Market Share Analysis
- 7.4. List of Potential Customers
- 8. Research Methodology
List of Figures
- Figure 1: Asia Pacific Metal Cans Industry Revenue Breakdown (million, %) by Product 2025 & 2033
- Figure 2: Asia Pacific Metal Cans Industry Share (%) by Company 2025
List of Tables
- Table 1: Asia Pacific Metal Cans Industry Revenue million Forecast, by Material Type 2020 & 2033
- Table 2: Asia Pacific Metal Cans Industry Revenue million Forecast, by Can Types 2020 & 2033
- Table 3: Asia Pacific Metal Cans Industry Revenue million Forecast, by Region 2020 & 2033
- Table 4: Asia Pacific Metal Cans Industry Revenue million Forecast, by Material Type 2020 & 2033
- Table 5: Asia Pacific Metal Cans Industry Revenue million Forecast, by Can Types 2020 & 2033
- Table 6: Asia Pacific Metal Cans Industry Revenue million Forecast, by Country 2020 & 2033
- Table 7: China Asia Pacific Metal Cans Industry Revenue (million) Forecast, by Application 2020 & 2033
- Table 8: Japan Asia Pacific Metal Cans Industry Revenue (million) Forecast, by Application 2020 & 2033
- Table 9: South Korea Asia Pacific Metal Cans Industry Revenue (million) Forecast, by Application 2020 & 2033
- Table 10: India Asia Pacific Metal Cans Industry Revenue (million) Forecast, by Application 2020 & 2033
- Table 11: Australia Asia Pacific Metal Cans Industry Revenue (million) Forecast, by Application 2020 & 2033
- Table 12: New Zealand Asia Pacific Metal Cans Industry Revenue (million) Forecast, by Application 2020 & 2033
- Table 13: Indonesia Asia Pacific Metal Cans Industry Revenue (million) Forecast, by Application 2020 & 2033
- Table 14: Malaysia Asia Pacific Metal Cans Industry Revenue (million) Forecast, by Application 2020 & 2033
- Table 15: Singapore Asia Pacific Metal Cans Industry Revenue (million) Forecast, by Application 2020 & 2033
- Table 16: Thailand Asia Pacific Metal Cans Industry Revenue (million) Forecast, by Application 2020 & 2033
- Table 17: Vietnam Asia Pacific Metal Cans Industry Revenue (million) Forecast, by Application 2020 & 2033
- Table 18: Philippines Asia Pacific Metal Cans Industry Revenue (million) Forecast, by Application 2020 & 2033
Frequently Asked Questions
1. What is the projected Compound Annual Growth Rate (CAGR) of the Asia Pacific Metal Cans Industry?
The projected CAGR is approximately 6.9%.
2. Which companies are prominent players in the Asia Pacific Metal Cans Industry?
Key companies in the market include Aj Packaging, Amcor, Ball Corporation, Shanghai Jima Industrial Co Ltd*List Not Exhaustive, Silgan Containers LLC, Crown Holdings, EBI Packaging, BWAY.
3. What are the main segments of the Asia Pacific Metal Cans Industry?
The market segments include Material Type, Can Types.
4. Can you provide details about the market size?
The market size is estimated to be USD 16098.8 million as of 2022.
5. What are some drivers contributing to market growth?
High Recyclability Rates of Metal Packaging; Convenience and Lower Price Offered by Canned Food.
6. What are the notable trends driving market growth?
Canned Food to dominate market share.
7. Are there any restraints impacting market growth?
Presence of Alternate Packaging Solutions.
8. Can you provide examples of recent developments in the market?
February 2021 - the central can testing laboratory of China's Sunrise Group, formerly the Shengxing Group, in Anhui, was officially accredited by global food and drinks giant PepsiCo, and it became the first company in China to achieve this status. Therefore, companies are targeting to cut the cost of metal can production through the introduction of new technologies by building the required infrastructure for R&D and testing.
9. What pricing options are available for accessing the report?
Pricing options include single-user, multi-user, and enterprise licenses priced at USD 4750, USD 4950, and USD 6800 respectively.
10. Is the market size provided in terms of value or volume?
The market size is provided in terms of value, measured in million.
11. Are there any specific market keywords associated with the report?
Yes, the market keyword associated with the report is "Asia Pacific Metal Cans Industry," which aids in identifying and referencing the specific market segment covered.
12. How do I determine which pricing option suits my needs best?
The pricing options vary based on user requirements and access needs. Individual users may opt for single-user licenses, while businesses requiring broader access may choose multi-user or enterprise licenses for cost-effective access to the report.
13. Are there any additional resources or data provided in the Asia Pacific Metal Cans Industry report?
While the report offers comprehensive insights, it's advisable to review the specific contents or supplementary materials provided to ascertain if additional resources or data are available.
14. How can I stay updated on further developments or reports in the Asia Pacific Metal Cans Industry?
To stay informed about further developments, trends, and reports in the Asia Pacific Metal Cans Industry, consider subscribing to industry newsletters, following relevant companies and organizations, or regularly checking reputable industry news sources and publications.
Methodology
Step 1 - Identification of Relevant Samples Size from Population Database


Step 2 - Approaches for Defining Global Market Size (Value, Volume* & Price*)

Note*: In applicable scenarios
Step 3 - Data Sources
Primary Research
- Web Analytics
- Survey Reports
- Research Institute
- Latest Research Reports
- Opinion Leaders
Secondary Research
- Annual Reports
- White Paper
- Latest Press Release
- Industry Association
- Paid Database
- Investor Presentations

Step 4 - Data Triangulation
Involves using different sources of information in order to increase the validity of a study
These sources are likely to be stakeholders in a program - participants, other researchers, program staff, other community members, and so on.
Then we put all data in single framework & apply various statistical tools to find out the dynamic on the market.
During the analysis stage, feedback from the stakeholder groups would be compared to determine areas of agreement as well as areas of divergence