

Key Insights
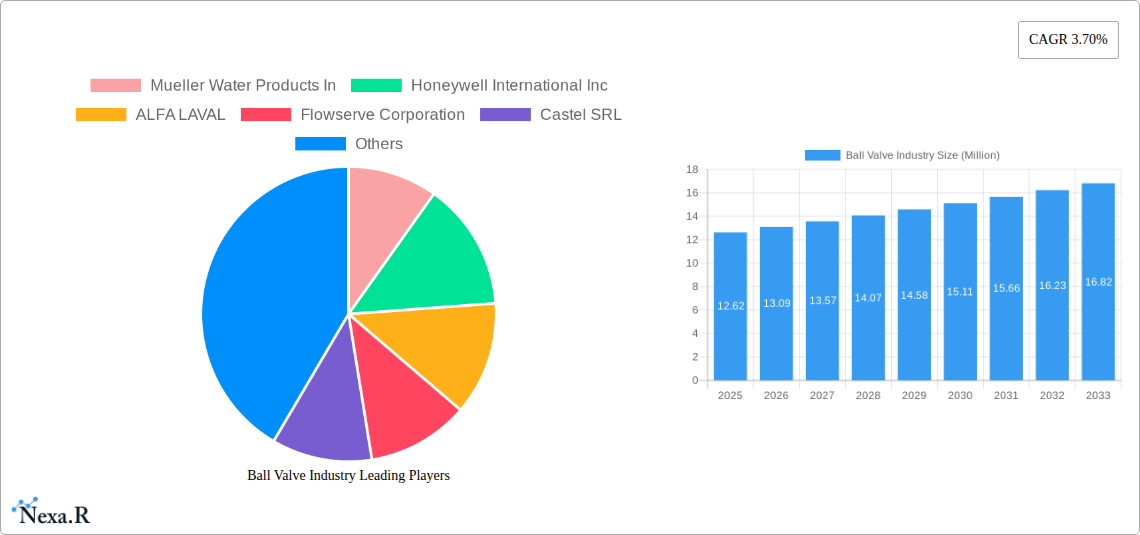
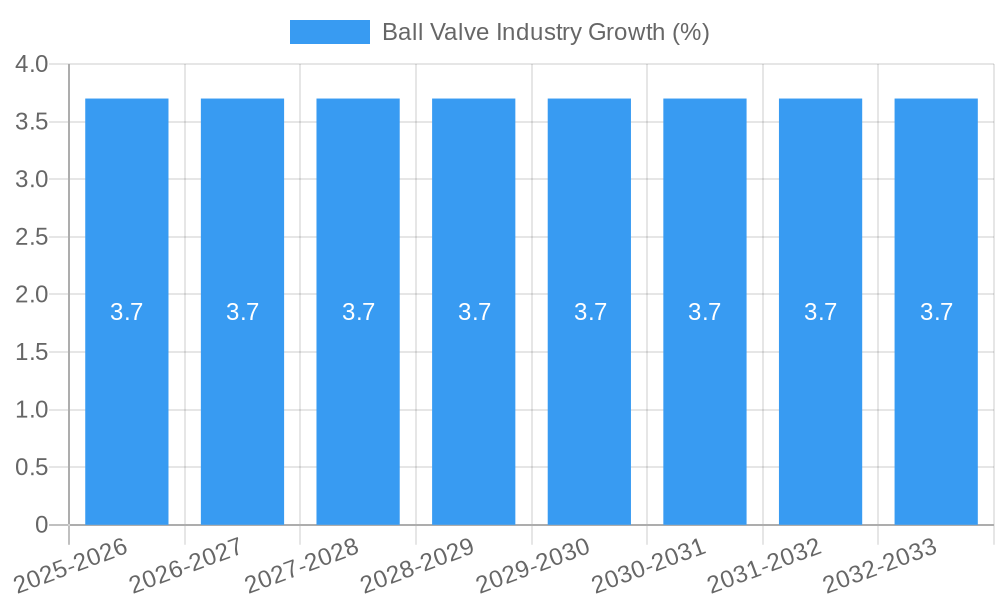
The global ball valve market is poised for steady expansion, with a projected market size of $12.62 million and a Compound Annual Growth Rate (CAGR) of 3.70% from 2025 to 2033. This growth is fueled by robust demand across critical industrial sectors, including oil and gas, chemicals, and water and wastewater management. The increasing need for efficient fluid control solutions in these industries, coupled with ongoing infrastructure development and expansion projects worldwide, are significant drivers. Furthermore, advancements in material science, leading to the development of more durable and corrosion-resistant ball valves made from steel and alloy-based materials, are contributing to market penetration. The shift towards smart manufacturing and the integration of IoT in industrial processes are also creating opportunities for advanced ball valve solutions with enhanced monitoring and control capabilities.
Despite a generally positive outlook, the market faces certain restraints that could temper growth. These include fluctuating raw material prices, particularly for metals like steel and alloys, which can impact manufacturing costs and ultimately the price of ball valves. Stringent environmental regulations in certain regions may also necessitate higher upfront investment in specialized, compliant valve systems. However, the broad applicability of ball valves across a diverse range of applications, from high-pressure industrial settings to more standard utility functions, ensures sustained demand. The increasing focus on water conservation and the expansion of wastewater treatment facilities globally are expected to be particularly strong growth segments, alongside the ever-present needs of the oil and gas and chemical processing industries. Leading companies are actively investing in research and development to offer innovative products that address these evolving industry demands and regulatory landscapes.
Ball Valve Industry Report: Market Size, Trends, Growth & Forecast (2019-2033)
Unlock critical insights into the global ball valve market, a vital component across numerous industrial applications. This comprehensive report delves into the intricate dynamics, growth trajectories, and future outlook of the industrial valve sector, with a specific focus on quarter-turn valves. Analyzing from 2019 to 2033, with a base year of 2025, this study provides an unparalleled understanding of market evolution, key players, and emerging opportunities. Discover the parent market of industrial valves and its significant child market, the ball valve segment, and their interplay. We present all monetary values in Million Units for clarity and actionable insights.
Ball Valve Industry Market Dynamics & Structure
The global ball valve market exhibits a moderately consolidated structure, characterized by intense competition and strategic alliances. Key market drivers include robust demand from the oil and gas industry, stringent environmental regulations driving the adoption of leak-proof valve solutions, and continuous technological advancements in materials and actuation. The chemical processing industry also represents a significant consumer, requiring high-performance valves for corrosive media. Regulatory frameworks, particularly concerning safety and emission standards, play a crucial role in shaping product development and market entry. Competitive product substitutes, such as gate valves and butterfly valves, present ongoing challenges, yet the inherent benefits of ball valves, like quick shut-off and durability, maintain their dominant position. End-user demographics are shifting towards industries prioritizing automation, digitalization, and predictive maintenance, influencing valve design and connectivity. Mergers and acquisitions (M&A) trends are active, as larger players consolidate to expand their product portfolios and geographic reach.
- Market Concentration: Moderate, with leading players holding significant market share.
- Technological Innovation Drivers: Enhanced sealing technologies, advanced materials (e.g., alloy-based for extreme environments), smart valve functionalities, and energy-efficient designs.
- Regulatory Frameworks: Increasing emphasis on fugitive emission control (API standards), safety interlocks, and material compliance for specific industries (e.g., FDA for food and beverage).
- Competitive Product Substitutes: Gate valves, butterfly valves, plug valves, focusing on specific application requirements.
- End-User Demographics: Growing demand from upstream and downstream oil and gas, chemical manufacturing, water treatment plants, and renewable energy projects.
- M&A Trends: Strategic acquisitions to gain market share, access new technologies, or expand into emerging geographies. For example, acquisitions by Emerson Electric Co. or Flowserve Corporation.
Ball Valve Industry Growth Trends & Insights
The ball valve industry is poised for sustained growth, driven by increasing industrialization, infrastructure development, and the ongoing need for reliable fluid control solutions. The market size is projected to witness a significant expansion from 2025 to 2033, fueled by accelerating adoption rates in emerging economies and the upgrade of existing industrial facilities. Technological disruptions, such as the integration of IoT sensors for real-time monitoring and predictive maintenance, are revolutionizing valve performance and application. Consumer behavior is increasingly influenced by the demand for energy efficiency, reduced downtime, and enhanced operational safety, pushing manufacturers to develop more sophisticated and intelligent ball valve systems. The global ball valve market size is expected to reach significant valuations, with a robust Compound Annual Growth Rate (CAGR) anticipated over the forecast period. Market penetration is deepening across various end-user sectors, particularly in those undergoing digital transformation.
- Market Size Evolution: Steady upward trend driven by industrial expansion and modernization.
- Adoption Rates: Increasing across all major end-user industries, with higher adoption in sectors prioritizing process control and safety.
- Technological Disruptions: Integration of smart features, advanced materials, and automated actuation systems for enhanced performance and reduced operational costs.
- Consumer Behavior Shifts: Growing preference for smart, durable, and energy-efficient valve solutions, with an emphasis on reduced total cost of ownership.
- CAGR Projection: Expected to remain strong, reflecting sustained demand.
- Market Penetration: Deepening across key sectors like oil & gas, chemical, and water treatment.
Dominant Regions, Countries, or Segments in Ball Valve Industry
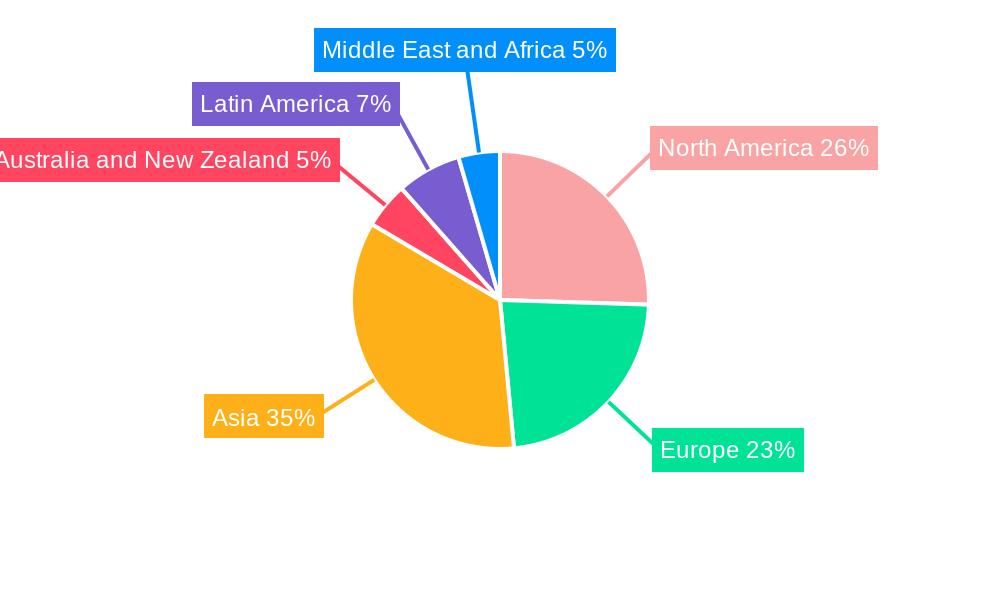
The North America region, particularly the United States, stands as a dominant force in the global ball valve market. This leadership is attributed to its mature and expansive oil and gas industry, substantial investments in chemical processing, and robust infrastructure development in water and waste water management. The region's stringent environmental regulations further drive the demand for high-performance, leak-proof ball valves. The power generation sector, encompassing both traditional and renewable energy sources, also contributes significantly to regional demand.
- Dominant Region: North America.
- Key Country: United States.
- Dominant End-User Industry: Oil and Gas.
- Driving Factors in North America:
- Extensive upstream and downstream operations in the oil and gas sector.
- Significant presence of advanced chemical manufacturing facilities.
- Continuous investment in water and wastewater treatment infrastructure.
- Strict environmental regulations promoting the use of reliable valve technology.
- Strong focus on technological innovation and smart valve solutions.
- Market Share & Growth Potential: North America holds a substantial market share and is expected to maintain strong growth due to ongoing energy projects and infrastructure upgrades.
- Dominant Material Segment: Steel and Alloy Based materials are particularly dominant in North America due to the demanding environments in oil and gas and chemical processing, requiring corrosion resistance and high-pressure capabilities. Cast Iron finds significant application in water and wastewater.
Ball Valve Industry Product Landscape
The ball valve product landscape is characterized by continuous innovation in materials, designs, and functionalities. Manufacturers like Emerson Electric Co. and Flowserve Corporation are at the forefront of developing advanced trunnion ball valves, floating ball valves, and specialty designs for extreme temperature and pressure applications. Product innovations include self-cleaning ball valves, cryogenic ball valves for liquefied gases, and high-cycle life valves for automated processes. These valves are integral to a wide array of applications, from critical shut-off in pipelines to precise flow control in chemical reactors and pharmaceutical manufacturing. Performance metrics are increasingly focused on sealing integrity, longevity, and reduced fugitive emissions, ensuring compliance with evolving industry standards.
- Product Innovations: Trunnion and floating ball valve designs, specialty materials for corrosive and high-temperature environments, integrated actuation and control systems.
- Applications: Pipeline transportation, chemical processing, water treatment, power generation, food & beverage, and pharmaceutical industries.
- Performance Metrics: Enhanced sealing efficiency, extended service life, low fugitive emissions, and compatibility with smart monitoring systems.
Key Drivers, Barriers & Challenges in Ball Valve Industry
The ball valve industry is propelled by the ever-growing demand for efficient fluid management across core industrial sectors. Technological advancements, such as the development of advanced sealing materials and smart functionalities, are key drivers. Increasing global energy demand and infrastructure development projects, especially in emerging economies, further stimulate market growth. Stringent environmental regulations globally are also a significant catalyst, compelling industries to adopt reliable and leak-free valve solutions.
- Key Drivers:
- Robust demand from the oil & gas and chemical industries.
- Infrastructure development and modernization projects.
- Increasing emphasis on environmental compliance and emission reduction.
- Technological innovation in materials and smart valve features.
- Growth in the pharmaceutical and food & beverage sectors.
Conversely, the industry faces several barriers and challenges. Volatility in raw material prices, particularly for steel and specialized alloys, can impact manufacturing costs and profitability. Intense competition and price pressures from both established players and emerging manufacturers present a significant challenge. Supply chain disruptions, as witnessed in recent global events, can lead to production delays and increased lead times. Furthermore, the development and implementation of highly sophisticated smart valve technologies require significant R&D investment and skilled labor, posing a barrier for smaller entities.
- Key Challenges & Restraints:
- Volatility in raw material prices (steel, alloys).
- Intense competition and price erosion.
- Supply chain vulnerabilities and logistical complexities.
- High R&D costs for advanced technologies.
- Skilled labor shortages for complex valve manufacturing and maintenance.
Emerging Opportunities in Ball Valve Industry
The ball valve industry is ripe with emerging opportunities, particularly in the burgeoning renewable energy sector, including solar, wind, and hydrogen production, which require specialized and robust valve solutions. The growing adoption of Industry 4.0 technologies presents a significant avenue for growth through the development and integration of smart, connected ball valves with advanced diagnostic capabilities for predictive maintenance. Untapped markets in developing economies, driven by rapid industrialization and infrastructure development, offer substantial expansion potential. Evolving consumer preferences for sustainable and energy-efficient solutions are also creating demand for innovative valve designs that minimize energy consumption.
- Untapped Markets: Developing economies in Asia, Africa, and Latin America.
- Innovative Applications: Hydrogen pipelines, carbon capture technologies, advanced water purification systems, and specialized applications in the pharmaceutical and biotech sectors.
- Evolving Consumer Preferences: Demand for smart, connected, and sustainable valve solutions.
Growth Accelerators in the Ball Valve Industry Industry
Several key catalysts are accelerating long-term growth in the ball valve industry. Technological breakthroughs in material science are enabling the development of valves that can withstand more extreme temperatures, pressures, and corrosive environments, expanding their application scope. Strategic partnerships and collaborations between valve manufacturers and automation providers are fostering the integration of advanced control systems and digital technologies, leading to the creation of intelligent valve solutions. Furthermore, market expansion strategies, including penetration into new geographic regions and diversification of product portfolios to serve niche industrial needs, are driving sustained growth. The increasing focus on industrial safety and environmental protection globally will continue to be a significant growth accelerator, pushing the demand for reliable and high-performance ball valves.
- Technological Breakthroughs: Advanced alloys, self-healing coatings, and digital twin capabilities for valves.
- Strategic Partnerships: Collaborations with IoT providers, AI developers, and system integrators.
- Market Expansion Strategies: Entry into emerging industrial hubs and focus on specialized valve solutions.
Key Players Shaping the Ball Valve Industry Market
- Mueller Water Products Inc.
- Honeywell International Inc.
- ALFA LAVAL
- Flowserve Corporation
- Castel SRL
- Georg Fischer Ltd
- Hitachi Ltd
- Emerson Electric Co.
- CIRCOR International Inc.
- Crane Co.
- Danfoss A/S
- Curtiss-Wright Corporation
- KITZ Corporation
- Sanhua USA
Notable Milestones in Ball Valve Industry Sector
- November 2024: Heap and Partners designed and manufactured 12 of its Phase trunnion ball valves for a Serica Energy maintenance campaign at the Bruce Field facilities in the UK North Sea. The 16-inch valves were the largest produced by the company, weighing under four metric tons.
- December 2023: Allied Valve Inc. partnered with REXA as the exclusive sales and service partner for several US states, expanding REXA's reach in the oil and gas, power, and metals industries.
- January 2024: Total Valve Systems announced its partnership with Crane ChemPharma & Energy, a business of Crane Company, to distribute and be an authorized service center for various valve products.
In-Depth Ball Valve Industry Market Outlook
The ball valve industry is projected for robust future growth, driven by a confluence of accelerating factors. The increasing global demand for energy and the ongoing expansion of industrial infrastructure, particularly in emerging economies, will continue to fuel the need for reliable fluid control solutions. Technological advancements, including the integration of IoT and AI for smart valve functionalities and predictive maintenance, will redefine operational efficiencies and safety standards, creating new market opportunities. Strategic partnerships and collaborations will play a crucial role in developing innovative products and expanding market reach. The sustained global emphasis on environmental regulations and sustainability will further propel the demand for high-performance, leak-free ball valves. The market outlook is highly positive, with significant potential for innovation and expansion across diverse end-user industries.
Ball Valve Industry Segmentation
-
1. Material (Qualitative Analysis)
- 1.1. Cast Iron
- 1.2. Steel
- 1.3. Alloy Based
- 1.4. Other Materials
-
2. End-User Industry
- 2.1. Oil and Gas
- 2.2. Chemicals
- 2.3. Water and Waste Water
- 2.4. Power
- 2.5. Food and Beverage
- 2.6. Pharmaceutical
- 2.7. Other End-User Industries
Ball Valve Industry Segmentation By Geography
- 1. North America
- 2. Europe
- 3. Asia
- 4. Australia and New Zealand
- 5. Latin America
- 6. Middle East and Africa
Ball Valve Industry REPORT HIGHLIGHTS
| Aspects | Details |
|---|---|
| Study Period | 2019-2033 |
| Base Year | 2024 |
| Estimated Year | 2025 |
| Forecast Period | 2025-2033 |
| Historical Period | 2019-2024 |
| Growth Rate | CAGR of 3.70% from 2019-2033 |
| Segmentation |
|
Table of Contents
- 1. Introduction
- 1.1. Research Scope
- 1.2. Market Segmentation
- 1.3. Research Methodology
- 1.4. Definitions and Assumptions
- 2. Executive Summary
- 2.1. Introduction
- 3. Market Dynamics
- 3.1. Introduction
- 3.2. Market Drivers
- 3.2.1. Growing Industrialization in Various Countries; Growing Demand for ProcessSafety
- 3.3. Market Restrains
- 3.3.1. Trade-offs between privacy/security and regulatory constraints
- 3.4. Market Trends
- 3.4.1. Food Processing Industry Expected to Have Significant Applications
- 4. Market Factor Analysis
- 4.1. Porters Five Forces
- 4.2. Supply/Value Chain
- 4.3. PESTEL analysis
- 4.4. Market Entropy
- 4.5. Patent/Trademark Analysis
- 5. Global Ball Valve Industry Analysis, Insights and Forecast, 2019-2031
- 5.1. Market Analysis, Insights and Forecast - by Material (Qualitative Analysis)
- 5.1.1. Cast Iron
- 5.1.2. Steel
- 5.1.3. Alloy Based
- 5.1.4. Other Materials
- 5.2. Market Analysis, Insights and Forecast - by End-User Industry
- 5.2.1. Oil and Gas
- 5.2.2. Chemicals
- 5.2.3. Water and Waste Water
- 5.2.4. Power
- 5.2.5. Food and Beverage
- 5.2.6. Pharmaceutical
- 5.2.7. Other End-User Industries
- 5.3. Market Analysis, Insights and Forecast - by Region
- 5.3.1. North America
- 5.3.2. Europe
- 5.3.3. Asia
- 5.3.4. Australia and New Zealand
- 5.3.5. Latin America
- 5.3.6. Middle East and Africa
- 5.1. Market Analysis, Insights and Forecast - by Material (Qualitative Analysis)
- 6. North America Ball Valve Industry Analysis, Insights and Forecast, 2019-2031
- 6.1. Market Analysis, Insights and Forecast - by Material (Qualitative Analysis)
- 6.1.1. Cast Iron
- 6.1.2. Steel
- 6.1.3. Alloy Based
- 6.1.4. Other Materials
- 6.2. Market Analysis, Insights and Forecast - by End-User Industry
- 6.2.1. Oil and Gas
- 6.2.2. Chemicals
- 6.2.3. Water and Waste Water
- 6.2.4. Power
- 6.2.5. Food and Beverage
- 6.2.6. Pharmaceutical
- 6.2.7. Other End-User Industries
- 6.1. Market Analysis, Insights and Forecast - by Material (Qualitative Analysis)
- 7. Europe Ball Valve Industry Analysis, Insights and Forecast, 2019-2031
- 7.1. Market Analysis, Insights and Forecast - by Material (Qualitative Analysis)
- 7.1.1. Cast Iron
- 7.1.2. Steel
- 7.1.3. Alloy Based
- 7.1.4. Other Materials
- 7.2. Market Analysis, Insights and Forecast - by End-User Industry
- 7.2.1. Oil and Gas
- 7.2.2. Chemicals
- 7.2.3. Water and Waste Water
- 7.2.4. Power
- 7.2.5. Food and Beverage
- 7.2.6. Pharmaceutical
- 7.2.7. Other End-User Industries
- 7.1. Market Analysis, Insights and Forecast - by Material (Qualitative Analysis)
- 8. Asia Ball Valve Industry Analysis, Insights and Forecast, 2019-2031
- 8.1. Market Analysis, Insights and Forecast - by Material (Qualitative Analysis)
- 8.1.1. Cast Iron
- 8.1.2. Steel
- 8.1.3. Alloy Based
- 8.1.4. Other Materials
- 8.2. Market Analysis, Insights and Forecast - by End-User Industry
- 8.2.1. Oil and Gas
- 8.2.2. Chemicals
- 8.2.3. Water and Waste Water
- 8.2.4. Power
- 8.2.5. Food and Beverage
- 8.2.6. Pharmaceutical
- 8.2.7. Other End-User Industries
- 8.1. Market Analysis, Insights and Forecast - by Material (Qualitative Analysis)
- 9. Australia and New Zealand Ball Valve Industry Analysis, Insights and Forecast, 2019-2031
- 9.1. Market Analysis, Insights and Forecast - by Material (Qualitative Analysis)
- 9.1.1. Cast Iron
- 9.1.2. Steel
- 9.1.3. Alloy Based
- 9.1.4. Other Materials
- 9.2. Market Analysis, Insights and Forecast - by End-User Industry
- 9.2.1. Oil and Gas
- 9.2.2. Chemicals
- 9.2.3. Water and Waste Water
- 9.2.4. Power
- 9.2.5. Food and Beverage
- 9.2.6. Pharmaceutical
- 9.2.7. Other End-User Industries
- 9.1. Market Analysis, Insights and Forecast - by Material (Qualitative Analysis)
- 10. Latin America Ball Valve Industry Analysis, Insights and Forecast, 2019-2031
- 10.1. Market Analysis, Insights and Forecast - by Material (Qualitative Analysis)
- 10.1.1. Cast Iron
- 10.1.2. Steel
- 10.1.3. Alloy Based
- 10.1.4. Other Materials
- 10.2. Market Analysis, Insights and Forecast - by End-User Industry
- 10.2.1. Oil and Gas
- 10.2.2. Chemicals
- 10.2.3. Water and Waste Water
- 10.2.4. Power
- 10.2.5. Food and Beverage
- 10.2.6. Pharmaceutical
- 10.2.7. Other End-User Industries
- 10.1. Market Analysis, Insights and Forecast - by Material (Qualitative Analysis)
- 11. Middle East and Africa Ball Valve Industry Analysis, Insights and Forecast, 2019-2031
- 11.1. Market Analysis, Insights and Forecast - by Material (Qualitative Analysis)
- 11.1.1. Cast Iron
- 11.1.2. Steel
- 11.1.3. Alloy Based
- 11.1.4. Other Materials
- 11.2. Market Analysis, Insights and Forecast - by End-User Industry
- 11.2.1. Oil and Gas
- 11.2.2. Chemicals
- 11.2.3. Water and Waste Water
- 11.2.4. Power
- 11.2.5. Food and Beverage
- 11.2.6. Pharmaceutical
- 11.2.7. Other End-User Industries
- 11.1. Market Analysis, Insights and Forecast - by Material (Qualitative Analysis)
- 12. North America Ball Valve Industry Analysis, Insights and Forecast, 2019-2031
- 12.1. Market Analysis, Insights and Forecast - By Country/Sub-region
- 12.1.1 United States
- 12.1.2 Canada
- 12.1.3 Mexico
- 13. Europe Ball Valve Industry Analysis, Insights and Forecast, 2019-2031
- 13.1. Market Analysis, Insights and Forecast - By Country/Sub-region
- 13.1.1 Germany
- 13.1.2 United Kingdom
- 13.1.3 France
- 13.1.4 Spain
- 13.1.5 Italy
- 13.1.6 Spain
- 13.1.7 Belgium
- 13.1.8 Netherland
- 13.1.9 Nordics
- 13.1.10 Rest of Europe
- 14. Asia Pacific Ball Valve Industry Analysis, Insights and Forecast, 2019-2031
- 14.1. Market Analysis, Insights and Forecast - By Country/Sub-region
- 14.1.1 China
- 14.1.2 Japan
- 14.1.3 India
- 14.1.4 South Korea
- 14.1.5 Southeast Asia
- 14.1.6 Australia
- 14.1.7 Indonesia
- 14.1.8 Phillipes
- 14.1.9 Singapore
- 14.1.10 Thailandc
- 14.1.11 Rest of Asia Pacific
- 15. South America Ball Valve Industry Analysis, Insights and Forecast, 2019-2031
- 15.1. Market Analysis, Insights and Forecast - By Country/Sub-region
- 15.1.1 Brazil
- 15.1.2 Argentina
- 15.1.3 Peru
- 15.1.4 Chile
- 15.1.5 Colombia
- 15.1.6 Ecuador
- 15.1.7 Venezuela
- 15.1.8 Rest of South America
- 16. North America Ball Valve Industry Analysis, Insights and Forecast, 2019-2031
- 16.1. Market Analysis, Insights and Forecast - By Country/Sub-region
- 16.1.1 United States
- 16.1.2 Canada
- 16.1.3 Mexico
- 17. MEA Ball Valve Industry Analysis, Insights and Forecast, 2019-2031
- 17.1. Market Analysis, Insights and Forecast - By Country/Sub-region
- 17.1.1 United Arab Emirates
- 17.1.2 Saudi Arabia
- 17.1.3 South Africa
- 17.1.4 Rest of Middle East and Africa
- 18. Competitive Analysis
- 18.1. Global Market Share Analysis 2024
- 18.2. Company Profiles
- 18.2.1 Mueller Water Products In
- 18.2.1.1. Overview
- 18.2.1.2. Products
- 18.2.1.3. SWOT Analysis
- 18.2.1.4. Recent Developments
- 18.2.1.5. Financials (Based on Availability)
- 18.2.2 Honeywell International Inc
- 18.2.2.1. Overview
- 18.2.2.2. Products
- 18.2.2.3. SWOT Analysis
- 18.2.2.4. Recent Developments
- 18.2.2.5. Financials (Based on Availability)
- 18.2.3 ALFA LAVAL
- 18.2.3.1. Overview
- 18.2.3.2. Products
- 18.2.3.3. SWOT Analysis
- 18.2.3.4. Recent Developments
- 18.2.3.5. Financials (Based on Availability)
- 18.2.4 Flowserve Corporation
- 18.2.4.1. Overview
- 18.2.4.2. Products
- 18.2.4.3. SWOT Analysis
- 18.2.4.4. Recent Developments
- 18.2.4.5. Financials (Based on Availability)
- 18.2.5 Castel SRL
- 18.2.5.1. Overview
- 18.2.5.2. Products
- 18.2.5.3. SWOT Analysis
- 18.2.5.4. Recent Developments
- 18.2.5.5. Financials (Based on Availability)
- 18.2.6 Georg Fischer Ltd
- 18.2.6.1. Overview
- 18.2.6.2. Products
- 18.2.6.3. SWOT Analysis
- 18.2.6.4. Recent Developments
- 18.2.6.5. Financials (Based on Availability)
- 18.2.7 Hitachi Ltd
- 18.2.7.1. Overview
- 18.2.7.2. Products
- 18.2.7.3. SWOT Analysis
- 18.2.7.4. Recent Developments
- 18.2.7.5. Financials (Based on Availability)
- 18.2.8 Emerson Electric Co
- 18.2.8.1. Overview
- 18.2.8.2. Products
- 18.2.8.3. SWOT Analysis
- 18.2.8.4. Recent Developments
- 18.2.8.5. Financials (Based on Availability)
- 18.2.9 CIRCOR International Inc
- 18.2.9.1. Overview
- 18.2.9.2. Products
- 18.2.9.3. SWOT Analysis
- 18.2.9.4. Recent Developments
- 18.2.9.5. Financials (Based on Availability)
- 18.2.10 Crane Co
- 18.2.10.1. Overview
- 18.2.10.2. Products
- 18.2.10.3. SWOT Analysis
- 18.2.10.4. Recent Developments
- 18.2.10.5. Financials (Based on Availability)
- 18.2.11 Danfoss A/S
- 18.2.11.1. Overview
- 18.2.11.2. Products
- 18.2.11.3. SWOT Analysis
- 18.2.11.4. Recent Developments
- 18.2.11.5. Financials (Based on Availability)
- 18.2.12 Curtiss-Wright Corporation
- 18.2.12.1. Overview
- 18.2.12.2. Products
- 18.2.12.3. SWOT Analysis
- 18.2.12.4. Recent Developments
- 18.2.12.5. Financials (Based on Availability)
- 18.2.13 KITZ Corporation
- 18.2.13.1. Overview
- 18.2.13.2. Products
- 18.2.13.3. SWOT Analysis
- 18.2.13.4. Recent Developments
- 18.2.13.5. Financials (Based on Availability)
- 18.2.14 Sanhua USA
- 18.2.14.1. Overview
- 18.2.14.2. Products
- 18.2.14.3. SWOT Analysis
- 18.2.14.4. Recent Developments
- 18.2.14.5. Financials (Based on Availability)
- 18.2.1 Mueller Water Products In
List of Figures
- Figure 1: Global Ball Valve Industry Revenue Breakdown (Million, %) by Region 2024 & 2032
- Figure 2: Global Ball Valve Industry Volume Breakdown (K Unit, %) by Region 2024 & 2032
- Figure 3: North America Ball Valve Industry Revenue (Million), by Country 2024 & 2032
- Figure 4: North America Ball Valve Industry Volume (K Unit), by Country 2024 & 2032
- Figure 5: North America Ball Valve Industry Revenue Share (%), by Country 2024 & 2032
- Figure 6: North America Ball Valve Industry Volume Share (%), by Country 2024 & 2032
- Figure 7: Europe Ball Valve Industry Revenue (Million), by Country 2024 & 2032
- Figure 8: Europe Ball Valve Industry Volume (K Unit), by Country 2024 & 2032
- Figure 9: Europe Ball Valve Industry Revenue Share (%), by Country 2024 & 2032
- Figure 10: Europe Ball Valve Industry Volume Share (%), by Country 2024 & 2032
- Figure 11: Asia Pacific Ball Valve Industry Revenue (Million), by Country 2024 & 2032
- Figure 12: Asia Pacific Ball Valve Industry Volume (K Unit), by Country 2024 & 2032
- Figure 13: Asia Pacific Ball Valve Industry Revenue Share (%), by Country 2024 & 2032
- Figure 14: Asia Pacific Ball Valve Industry Volume Share (%), by Country 2024 & 2032
- Figure 15: South America Ball Valve Industry Revenue (Million), by Country 2024 & 2032
- Figure 16: South America Ball Valve Industry Volume (K Unit), by Country 2024 & 2032
- Figure 17: South America Ball Valve Industry Revenue Share (%), by Country 2024 & 2032
- Figure 18: South America Ball Valve Industry Volume Share (%), by Country 2024 & 2032
- Figure 19: North America Ball Valve Industry Revenue (Million), by Country 2024 & 2032
- Figure 20: North America Ball Valve Industry Volume (K Unit), by Country 2024 & 2032
- Figure 21: North America Ball Valve Industry Revenue Share (%), by Country 2024 & 2032
- Figure 22: North America Ball Valve Industry Volume Share (%), by Country 2024 & 2032
- Figure 23: MEA Ball Valve Industry Revenue (Million), by Country 2024 & 2032
- Figure 24: MEA Ball Valve Industry Volume (K Unit), by Country 2024 & 2032
- Figure 25: MEA Ball Valve Industry Revenue Share (%), by Country 2024 & 2032
- Figure 26: MEA Ball Valve Industry Volume Share (%), by Country 2024 & 2032
- Figure 27: North America Ball Valve Industry Revenue (Million), by Material (Qualitative Analysis) 2024 & 2032
- Figure 28: North America Ball Valve Industry Volume (K Unit), by Material (Qualitative Analysis) 2024 & 2032
- Figure 29: North America Ball Valve Industry Revenue Share (%), by Material (Qualitative Analysis) 2024 & 2032
- Figure 30: North America Ball Valve Industry Volume Share (%), by Material (Qualitative Analysis) 2024 & 2032
- Figure 31: North America Ball Valve Industry Revenue (Million), by End-User Industry 2024 & 2032
- Figure 32: North America Ball Valve Industry Volume (K Unit), by End-User Industry 2024 & 2032
- Figure 33: North America Ball Valve Industry Revenue Share (%), by End-User Industry 2024 & 2032
- Figure 34: North America Ball Valve Industry Volume Share (%), by End-User Industry 2024 & 2032
- Figure 35: North America Ball Valve Industry Revenue (Million), by Country 2024 & 2032
- Figure 36: North America Ball Valve Industry Volume (K Unit), by Country 2024 & 2032
- Figure 37: North America Ball Valve Industry Revenue Share (%), by Country 2024 & 2032
- Figure 38: North America Ball Valve Industry Volume Share (%), by Country 2024 & 2032
- Figure 39: Europe Ball Valve Industry Revenue (Million), by Material (Qualitative Analysis) 2024 & 2032
- Figure 40: Europe Ball Valve Industry Volume (K Unit), by Material (Qualitative Analysis) 2024 & 2032
- Figure 41: Europe Ball Valve Industry Revenue Share (%), by Material (Qualitative Analysis) 2024 & 2032
- Figure 42: Europe Ball Valve Industry Volume Share (%), by Material (Qualitative Analysis) 2024 & 2032
- Figure 43: Europe Ball Valve Industry Revenue (Million), by End-User Industry 2024 & 2032
- Figure 44: Europe Ball Valve Industry Volume (K Unit), by End-User Industry 2024 & 2032
- Figure 45: Europe Ball Valve Industry Revenue Share (%), by End-User Industry 2024 & 2032
- Figure 46: Europe Ball Valve Industry Volume Share (%), by End-User Industry 2024 & 2032
- Figure 47: Europe Ball Valve Industry Revenue (Million), by Country 2024 & 2032
- Figure 48: Europe Ball Valve Industry Volume (K Unit), by Country 2024 & 2032
- Figure 49: Europe Ball Valve Industry Revenue Share (%), by Country 2024 & 2032
- Figure 50: Europe Ball Valve Industry Volume Share (%), by Country 2024 & 2032
- Figure 51: Asia Ball Valve Industry Revenue (Million), by Material (Qualitative Analysis) 2024 & 2032
- Figure 52: Asia Ball Valve Industry Volume (K Unit), by Material (Qualitative Analysis) 2024 & 2032
- Figure 53: Asia Ball Valve Industry Revenue Share (%), by Material (Qualitative Analysis) 2024 & 2032
- Figure 54: Asia Ball Valve Industry Volume Share (%), by Material (Qualitative Analysis) 2024 & 2032
- Figure 55: Asia Ball Valve Industry Revenue (Million), by End-User Industry 2024 & 2032
- Figure 56: Asia Ball Valve Industry Volume (K Unit), by End-User Industry 2024 & 2032
- Figure 57: Asia Ball Valve Industry Revenue Share (%), by End-User Industry 2024 & 2032
- Figure 58: Asia Ball Valve Industry Volume Share (%), by End-User Industry 2024 & 2032
- Figure 59: Asia Ball Valve Industry Revenue (Million), by Country 2024 & 2032
- Figure 60: Asia Ball Valve Industry Volume (K Unit), by Country 2024 & 2032
- Figure 61: Asia Ball Valve Industry Revenue Share (%), by Country 2024 & 2032
- Figure 62: Asia Ball Valve Industry Volume Share (%), by Country 2024 & 2032
- Figure 63: Australia and New Zealand Ball Valve Industry Revenue (Million), by Material (Qualitative Analysis) 2024 & 2032
- Figure 64: Australia and New Zealand Ball Valve Industry Volume (K Unit), by Material (Qualitative Analysis) 2024 & 2032
- Figure 65: Australia and New Zealand Ball Valve Industry Revenue Share (%), by Material (Qualitative Analysis) 2024 & 2032
- Figure 66: Australia and New Zealand Ball Valve Industry Volume Share (%), by Material (Qualitative Analysis) 2024 & 2032
- Figure 67: Australia and New Zealand Ball Valve Industry Revenue (Million), by End-User Industry 2024 & 2032
- Figure 68: Australia and New Zealand Ball Valve Industry Volume (K Unit), by End-User Industry 2024 & 2032
- Figure 69: Australia and New Zealand Ball Valve Industry Revenue Share (%), by End-User Industry 2024 & 2032
- Figure 70: Australia and New Zealand Ball Valve Industry Volume Share (%), by End-User Industry 2024 & 2032
- Figure 71: Australia and New Zealand Ball Valve Industry Revenue (Million), by Country 2024 & 2032
- Figure 72: Australia and New Zealand Ball Valve Industry Volume (K Unit), by Country 2024 & 2032
- Figure 73: Australia and New Zealand Ball Valve Industry Revenue Share (%), by Country 2024 & 2032
- Figure 74: Australia and New Zealand Ball Valve Industry Volume Share (%), by Country 2024 & 2032
- Figure 75: Latin America Ball Valve Industry Revenue (Million), by Material (Qualitative Analysis) 2024 & 2032
- Figure 76: Latin America Ball Valve Industry Volume (K Unit), by Material (Qualitative Analysis) 2024 & 2032
- Figure 77: Latin America Ball Valve Industry Revenue Share (%), by Material (Qualitative Analysis) 2024 & 2032
- Figure 78: Latin America Ball Valve Industry Volume Share (%), by Material (Qualitative Analysis) 2024 & 2032
- Figure 79: Latin America Ball Valve Industry Revenue (Million), by End-User Industry 2024 & 2032
- Figure 80: Latin America Ball Valve Industry Volume (K Unit), by End-User Industry 2024 & 2032
- Figure 81: Latin America Ball Valve Industry Revenue Share (%), by End-User Industry 2024 & 2032
- Figure 82: Latin America Ball Valve Industry Volume Share (%), by End-User Industry 2024 & 2032
- Figure 83: Latin America Ball Valve Industry Revenue (Million), by Country 2024 & 2032
- Figure 84: Latin America Ball Valve Industry Volume (K Unit), by Country 2024 & 2032
- Figure 85: Latin America Ball Valve Industry Revenue Share (%), by Country 2024 & 2032
- Figure 86: Latin America Ball Valve Industry Volume Share (%), by Country 2024 & 2032
- Figure 87: Middle East and Africa Ball Valve Industry Revenue (Million), by Material (Qualitative Analysis) 2024 & 2032
- Figure 88: Middle East and Africa Ball Valve Industry Volume (K Unit), by Material (Qualitative Analysis) 2024 & 2032
- Figure 89: Middle East and Africa Ball Valve Industry Revenue Share (%), by Material (Qualitative Analysis) 2024 & 2032
- Figure 90: Middle East and Africa Ball Valve Industry Volume Share (%), by Material (Qualitative Analysis) 2024 & 2032
- Figure 91: Middle East and Africa Ball Valve Industry Revenue (Million), by End-User Industry 2024 & 2032
- Figure 92: Middle East and Africa Ball Valve Industry Volume (K Unit), by End-User Industry 2024 & 2032
- Figure 93: Middle East and Africa Ball Valve Industry Revenue Share (%), by End-User Industry 2024 & 2032
- Figure 94: Middle East and Africa Ball Valve Industry Volume Share (%), by End-User Industry 2024 & 2032
- Figure 95: Middle East and Africa Ball Valve Industry Revenue (Million), by Country 2024 & 2032
- Figure 96: Middle East and Africa Ball Valve Industry Volume (K Unit), by Country 2024 & 2032
- Figure 97: Middle East and Africa Ball Valve Industry Revenue Share (%), by Country 2024 & 2032
- Figure 98: Middle East and Africa Ball Valve Industry Volume Share (%), by Country 2024 & 2032
List of Tables
- Table 1: Global Ball Valve Industry Revenue Million Forecast, by Region 2019 & 2032
- Table 2: Global Ball Valve Industry Volume K Unit Forecast, by Region 2019 & 2032
- Table 3: Global Ball Valve Industry Revenue Million Forecast, by Material (Qualitative Analysis) 2019 & 2032
- Table 4: Global Ball Valve Industry Volume K Unit Forecast, by Material (Qualitative Analysis) 2019 & 2032
- Table 5: Global Ball Valve Industry Revenue Million Forecast, by End-User Industry 2019 & 2032
- Table 6: Global Ball Valve Industry Volume K Unit Forecast, by End-User Industry 2019 & 2032
- Table 7: Global Ball Valve Industry Revenue Million Forecast, by Region 2019 & 2032
- Table 8: Global Ball Valve Industry Volume K Unit Forecast, by Region 2019 & 2032
- Table 9: Global Ball Valve Industry Revenue Million Forecast, by Country 2019 & 2032
- Table 10: Global Ball Valve Industry Volume K Unit Forecast, by Country 2019 & 2032
- Table 11: United States Ball Valve Industry Revenue (Million) Forecast, by Application 2019 & 2032
- Table 12: United States Ball Valve Industry Volume (K Unit) Forecast, by Application 2019 & 2032
- Table 13: Canada Ball Valve Industry Revenue (Million) Forecast, by Application 2019 & 2032
- Table 14: Canada Ball Valve Industry Volume (K Unit) Forecast, by Application 2019 & 2032
- Table 15: Mexico Ball Valve Industry Revenue (Million) Forecast, by Application 2019 & 2032
- Table 16: Mexico Ball Valve Industry Volume (K Unit) Forecast, by Application 2019 & 2032
- Table 17: Global Ball Valve Industry Revenue Million Forecast, by Country 2019 & 2032
- Table 18: Global Ball Valve Industry Volume K Unit Forecast, by Country 2019 & 2032
- Table 19: Germany Ball Valve Industry Revenue (Million) Forecast, by Application 2019 & 2032
- Table 20: Germany Ball Valve Industry Volume (K Unit) Forecast, by Application 2019 & 2032
- Table 21: United Kingdom Ball Valve Industry Revenue (Million) Forecast, by Application 2019 & 2032
- Table 22: United Kingdom Ball Valve Industry Volume (K Unit) Forecast, by Application 2019 & 2032
- Table 23: France Ball Valve Industry Revenue (Million) Forecast, by Application 2019 & 2032
- Table 24: France Ball Valve Industry Volume (K Unit) Forecast, by Application 2019 & 2032
- Table 25: Spain Ball Valve Industry Revenue (Million) Forecast, by Application 2019 & 2032
- Table 26: Spain Ball Valve Industry Volume (K Unit) Forecast, by Application 2019 & 2032
- Table 27: Italy Ball Valve Industry Revenue (Million) Forecast, by Application 2019 & 2032
- Table 28: Italy Ball Valve Industry Volume (K Unit) Forecast, by Application 2019 & 2032
- Table 29: Spain Ball Valve Industry Revenue (Million) Forecast, by Application 2019 & 2032
- Table 30: Spain Ball Valve Industry Volume (K Unit) Forecast, by Application 2019 & 2032
- Table 31: Belgium Ball Valve Industry Revenue (Million) Forecast, by Application 2019 & 2032
- Table 32: Belgium Ball Valve Industry Volume (K Unit) Forecast, by Application 2019 & 2032
- Table 33: Netherland Ball Valve Industry Revenue (Million) Forecast, by Application 2019 & 2032
- Table 34: Netherland Ball Valve Industry Volume (K Unit) Forecast, by Application 2019 & 2032
- Table 35: Nordics Ball Valve Industry Revenue (Million) Forecast, by Application 2019 & 2032
- Table 36: Nordics Ball Valve Industry Volume (K Unit) Forecast, by Application 2019 & 2032
- Table 37: Rest of Europe Ball Valve Industry Revenue (Million) Forecast, by Application 2019 & 2032
- Table 38: Rest of Europe Ball Valve Industry Volume (K Unit) Forecast, by Application 2019 & 2032
- Table 39: Global Ball Valve Industry Revenue Million Forecast, by Country 2019 & 2032
- Table 40: Global Ball Valve Industry Volume K Unit Forecast, by Country 2019 & 2032
- Table 41: China Ball Valve Industry Revenue (Million) Forecast, by Application 2019 & 2032
- Table 42: China Ball Valve Industry Volume (K Unit) Forecast, by Application 2019 & 2032
- Table 43: Japan Ball Valve Industry Revenue (Million) Forecast, by Application 2019 & 2032
- Table 44: Japan Ball Valve Industry Volume (K Unit) Forecast, by Application 2019 & 2032
- Table 45: India Ball Valve Industry Revenue (Million) Forecast, by Application 2019 & 2032
- Table 46: India Ball Valve Industry Volume (K Unit) Forecast, by Application 2019 & 2032
- Table 47: South Korea Ball Valve Industry Revenue (Million) Forecast, by Application 2019 & 2032
- Table 48: South Korea Ball Valve Industry Volume (K Unit) Forecast, by Application 2019 & 2032
- Table 49: Southeast Asia Ball Valve Industry Revenue (Million) Forecast, by Application 2019 & 2032
- Table 50: Southeast Asia Ball Valve Industry Volume (K Unit) Forecast, by Application 2019 & 2032
- Table 51: Australia Ball Valve Industry Revenue (Million) Forecast, by Application 2019 & 2032
- Table 52: Australia Ball Valve Industry Volume (K Unit) Forecast, by Application 2019 & 2032
- Table 53: Indonesia Ball Valve Industry Revenue (Million) Forecast, by Application 2019 & 2032
- Table 54: Indonesia Ball Valve Industry Volume (K Unit) Forecast, by Application 2019 & 2032
- Table 55: Phillipes Ball Valve Industry Revenue (Million) Forecast, by Application 2019 & 2032
- Table 56: Phillipes Ball Valve Industry Volume (K Unit) Forecast, by Application 2019 & 2032
- Table 57: Singapore Ball Valve Industry Revenue (Million) Forecast, by Application 2019 & 2032
- Table 58: Singapore Ball Valve Industry Volume (K Unit) Forecast, by Application 2019 & 2032
- Table 59: Thailandc Ball Valve Industry Revenue (Million) Forecast, by Application 2019 & 2032
- Table 60: Thailandc Ball Valve Industry Volume (K Unit) Forecast, by Application 2019 & 2032
- Table 61: Rest of Asia Pacific Ball Valve Industry Revenue (Million) Forecast, by Application 2019 & 2032
- Table 62: Rest of Asia Pacific Ball Valve Industry Volume (K Unit) Forecast, by Application 2019 & 2032
- Table 63: Global Ball Valve Industry Revenue Million Forecast, by Country 2019 & 2032
- Table 64: Global Ball Valve Industry Volume K Unit Forecast, by Country 2019 & 2032
- Table 65: Brazil Ball Valve Industry Revenue (Million) Forecast, by Application 2019 & 2032
- Table 66: Brazil Ball Valve Industry Volume (K Unit) Forecast, by Application 2019 & 2032
- Table 67: Argentina Ball Valve Industry Revenue (Million) Forecast, by Application 2019 & 2032
- Table 68: Argentina Ball Valve Industry Volume (K Unit) Forecast, by Application 2019 & 2032
- Table 69: Peru Ball Valve Industry Revenue (Million) Forecast, by Application 2019 & 2032
- Table 70: Peru Ball Valve Industry Volume (K Unit) Forecast, by Application 2019 & 2032
- Table 71: Chile Ball Valve Industry Revenue (Million) Forecast, by Application 2019 & 2032
- Table 72: Chile Ball Valve Industry Volume (K Unit) Forecast, by Application 2019 & 2032
- Table 73: Colombia Ball Valve Industry Revenue (Million) Forecast, by Application 2019 & 2032
- Table 74: Colombia Ball Valve Industry Volume (K Unit) Forecast, by Application 2019 & 2032
- Table 75: Ecuador Ball Valve Industry Revenue (Million) Forecast, by Application 2019 & 2032
- Table 76: Ecuador Ball Valve Industry Volume (K Unit) Forecast, by Application 2019 & 2032
- Table 77: Venezuela Ball Valve Industry Revenue (Million) Forecast, by Application 2019 & 2032
- Table 78: Venezuela Ball Valve Industry Volume (K Unit) Forecast, by Application 2019 & 2032
- Table 79: Rest of South America Ball Valve Industry Revenue (Million) Forecast, by Application 2019 & 2032
- Table 80: Rest of South America Ball Valve Industry Volume (K Unit) Forecast, by Application 2019 & 2032
- Table 81: Global Ball Valve Industry Revenue Million Forecast, by Country 2019 & 2032
- Table 82: Global Ball Valve Industry Volume K Unit Forecast, by Country 2019 & 2032
- Table 83: United States Ball Valve Industry Revenue (Million) Forecast, by Application 2019 & 2032
- Table 84: United States Ball Valve Industry Volume (K Unit) Forecast, by Application 2019 & 2032
- Table 85: Canada Ball Valve Industry Revenue (Million) Forecast, by Application 2019 & 2032
- Table 86: Canada Ball Valve Industry Volume (K Unit) Forecast, by Application 2019 & 2032
- Table 87: Mexico Ball Valve Industry Revenue (Million) Forecast, by Application 2019 & 2032
- Table 88: Mexico Ball Valve Industry Volume (K Unit) Forecast, by Application 2019 & 2032
- Table 89: Global Ball Valve Industry Revenue Million Forecast, by Country 2019 & 2032
- Table 90: Global Ball Valve Industry Volume K Unit Forecast, by Country 2019 & 2032
- Table 91: United Arab Emirates Ball Valve Industry Revenue (Million) Forecast, by Application 2019 & 2032
- Table 92: United Arab Emirates Ball Valve Industry Volume (K Unit) Forecast, by Application 2019 & 2032
- Table 93: Saudi Arabia Ball Valve Industry Revenue (Million) Forecast, by Application 2019 & 2032
- Table 94: Saudi Arabia Ball Valve Industry Volume (K Unit) Forecast, by Application 2019 & 2032
- Table 95: South Africa Ball Valve Industry Revenue (Million) Forecast, by Application 2019 & 2032
- Table 96: South Africa Ball Valve Industry Volume (K Unit) Forecast, by Application 2019 & 2032
- Table 97: Rest of Middle East and Africa Ball Valve Industry Revenue (Million) Forecast, by Application 2019 & 2032
- Table 98: Rest of Middle East and Africa Ball Valve Industry Volume (K Unit) Forecast, by Application 2019 & 2032
- Table 99: Global Ball Valve Industry Revenue Million Forecast, by Material (Qualitative Analysis) 2019 & 2032
- Table 100: Global Ball Valve Industry Volume K Unit Forecast, by Material (Qualitative Analysis) 2019 & 2032
- Table 101: Global Ball Valve Industry Revenue Million Forecast, by End-User Industry 2019 & 2032
- Table 102: Global Ball Valve Industry Volume K Unit Forecast, by End-User Industry 2019 & 2032
- Table 103: Global Ball Valve Industry Revenue Million Forecast, by Country 2019 & 2032
- Table 104: Global Ball Valve Industry Volume K Unit Forecast, by Country 2019 & 2032
- Table 105: Global Ball Valve Industry Revenue Million Forecast, by Material (Qualitative Analysis) 2019 & 2032
- Table 106: Global Ball Valve Industry Volume K Unit Forecast, by Material (Qualitative Analysis) 2019 & 2032
- Table 107: Global Ball Valve Industry Revenue Million Forecast, by End-User Industry 2019 & 2032
- Table 108: Global Ball Valve Industry Volume K Unit Forecast, by End-User Industry 2019 & 2032
- Table 109: Global Ball Valve Industry Revenue Million Forecast, by Country 2019 & 2032
- Table 110: Global Ball Valve Industry Volume K Unit Forecast, by Country 2019 & 2032
- Table 111: Global Ball Valve Industry Revenue Million Forecast, by Material (Qualitative Analysis) 2019 & 2032
- Table 112: Global Ball Valve Industry Volume K Unit Forecast, by Material (Qualitative Analysis) 2019 & 2032
- Table 113: Global Ball Valve Industry Revenue Million Forecast, by End-User Industry 2019 & 2032
- Table 114: Global Ball Valve Industry Volume K Unit Forecast, by End-User Industry 2019 & 2032
- Table 115: Global Ball Valve Industry Revenue Million Forecast, by Country 2019 & 2032
- Table 116: Global Ball Valve Industry Volume K Unit Forecast, by Country 2019 & 2032
- Table 117: Global Ball Valve Industry Revenue Million Forecast, by Material (Qualitative Analysis) 2019 & 2032
- Table 118: Global Ball Valve Industry Volume K Unit Forecast, by Material (Qualitative Analysis) 2019 & 2032
- Table 119: Global Ball Valve Industry Revenue Million Forecast, by End-User Industry 2019 & 2032
- Table 120: Global Ball Valve Industry Volume K Unit Forecast, by End-User Industry 2019 & 2032
- Table 121: Global Ball Valve Industry Revenue Million Forecast, by Country 2019 & 2032
- Table 122: Global Ball Valve Industry Volume K Unit Forecast, by Country 2019 & 2032
- Table 123: Global Ball Valve Industry Revenue Million Forecast, by Material (Qualitative Analysis) 2019 & 2032
- Table 124: Global Ball Valve Industry Volume K Unit Forecast, by Material (Qualitative Analysis) 2019 & 2032
- Table 125: Global Ball Valve Industry Revenue Million Forecast, by End-User Industry 2019 & 2032
- Table 126: Global Ball Valve Industry Volume K Unit Forecast, by End-User Industry 2019 & 2032
- Table 127: Global Ball Valve Industry Revenue Million Forecast, by Country 2019 & 2032
- Table 128: Global Ball Valve Industry Volume K Unit Forecast, by Country 2019 & 2032
- Table 129: Global Ball Valve Industry Revenue Million Forecast, by Material (Qualitative Analysis) 2019 & 2032
- Table 130: Global Ball Valve Industry Volume K Unit Forecast, by Material (Qualitative Analysis) 2019 & 2032
- Table 131: Global Ball Valve Industry Revenue Million Forecast, by End-User Industry 2019 & 2032
- Table 132: Global Ball Valve Industry Volume K Unit Forecast, by End-User Industry 2019 & 2032
- Table 133: Global Ball Valve Industry Revenue Million Forecast, by Country 2019 & 2032
- Table 134: Global Ball Valve Industry Volume K Unit Forecast, by Country 2019 & 2032
Frequently Asked Questions
1. What is the projected Compound Annual Growth Rate (CAGR) of the Ball Valve Industry?
The projected CAGR is approximately 3.70%.
2. Which companies are prominent players in the Ball Valve Industry?
Key companies in the market include Mueller Water Products In, Honeywell International Inc, ALFA LAVAL, Flowserve Corporation, Castel SRL, Georg Fischer Ltd, Hitachi Ltd, Emerson Electric Co, CIRCOR International Inc, Crane Co, Danfoss A/S, Curtiss-Wright Corporation, KITZ Corporation, Sanhua USA.
3. What are the main segments of the Ball Valve Industry?
The market segments include Material (Qualitative Analysis), End-User Industry.
4. Can you provide details about the market size?
The market size is estimated to be USD 12.62 Million as of 2022.
5. What are some drivers contributing to market growth?
Growing Industrialization in Various Countries; Growing Demand for ProcessSafety.
6. What are the notable trends driving market growth?
Food Processing Industry Expected to Have Significant Applications.
7. Are there any restraints impacting market growth?
Trade-offs between privacy/security and regulatory constraints.
8. Can you provide examples of recent developments in the market?
November 2024 - Heap and Partners has designed and manufactured 12 of its Phase trunnion ball valves for a Serica Energy maintenance campaign this year at the Bruce Field facilities in the UK North Sea. The 16-inch valves were the largest produced by the company, weighing under four metric tons.
9. What pricing options are available for accessing the report?
Pricing options include single-user, multi-user, and enterprise licenses priced at USD 4750, USD 5250, and USD 8750 respectively.
10. Is the market size provided in terms of value or volume?
The market size is provided in terms of value, measured in Million and volume, measured in K Unit.
11. Are there any specific market keywords associated with the report?
Yes, the market keyword associated with the report is "Ball Valve Industry," which aids in identifying and referencing the specific market segment covered.
12. How do I determine which pricing option suits my needs best?
The pricing options vary based on user requirements and access needs. Individual users may opt for single-user licenses, while businesses requiring broader access may choose multi-user or enterprise licenses for cost-effective access to the report.
13. Are there any additional resources or data provided in the Ball Valve Industry report?
While the report offers comprehensive insights, it's advisable to review the specific contents or supplementary materials provided to ascertain if additional resources or data are available.
14. How can I stay updated on further developments or reports in the Ball Valve Industry?
To stay informed about further developments, trends, and reports in the Ball Valve Industry, consider subscribing to industry newsletters, following relevant companies and organizations, or regularly checking reputable industry news sources and publications.
Methodology
Step 1 - Identification of Relevant Samples Size from Population Database


Step 2 - Approaches for Defining Global Market Size (Value, Volume* & Price*)

Note*: In applicable scenarios
Step 3 - Data Sources
Primary Research
- Web Analytics
- Survey Reports
- Research Institute
- Latest Research Reports
- Opinion Leaders
Secondary Research
- Annual Reports
- White Paper
- Latest Press Release
- Industry Association
- Paid Database
- Investor Presentations

Step 4 - Data Triangulation
Involves using different sources of information in order to increase the validity of a study
These sources are likely to be stakeholders in a program - participants, other researchers, program staff, other community members, and so on.
Then we put all data in single framework & apply various statistical tools to find out the dynamic on the market.
During the analysis stage, feedback from the stakeholder groups would be compared to determine areas of agreement as well as areas of divergence
