

Key Insights
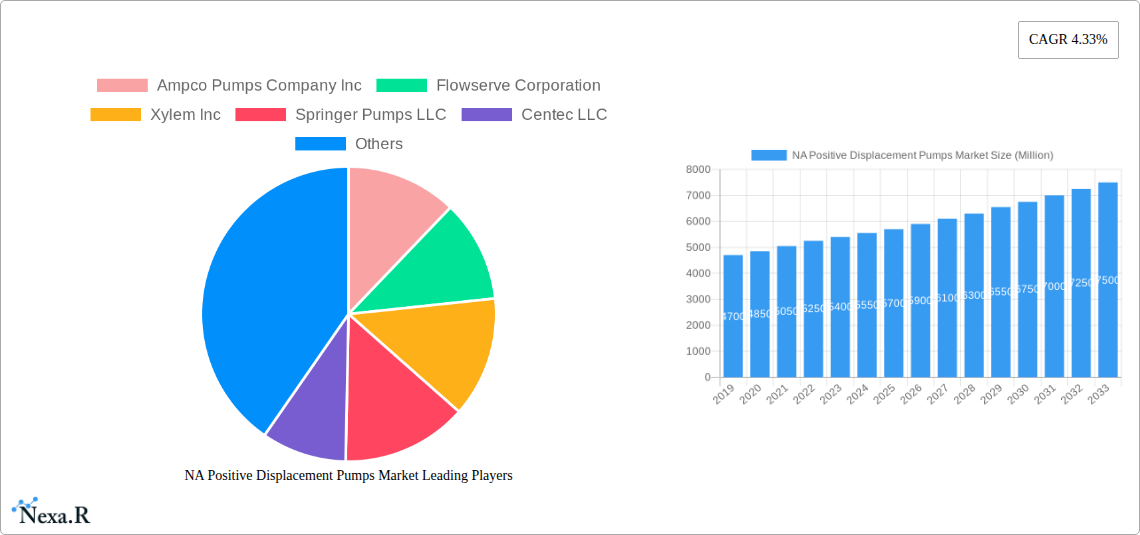
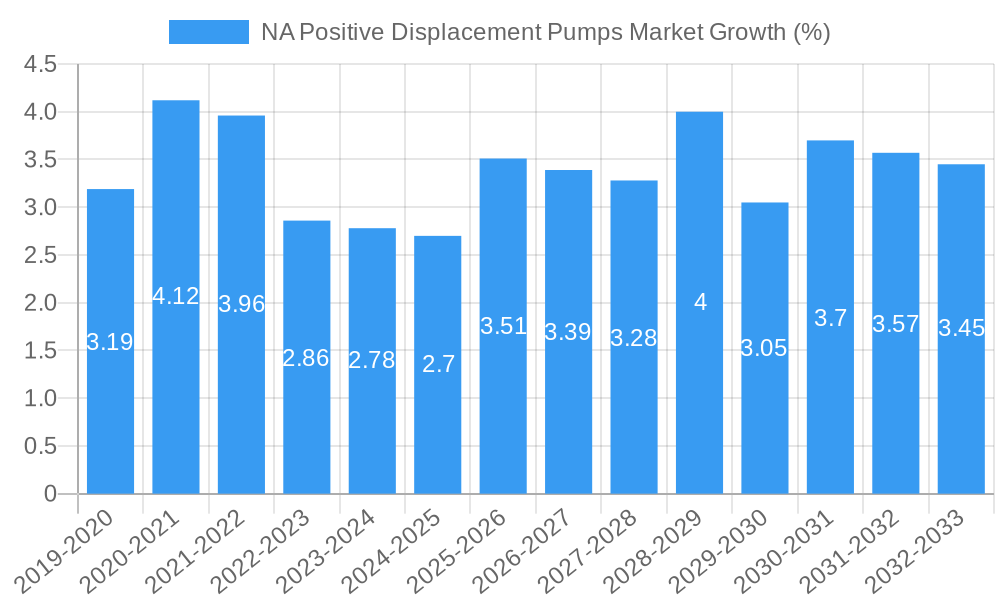
The North American Positive Displacement (PD) Pump market is poised for significant expansion, driven by robust industrial activity and an increasing demand for reliable fluid handling solutions. With an estimated market size of approximately USD 5,500 million in 2025, the sector is projected to grow at a Compound Annual Growth Rate (CAGR) of 4.33% through 2033. This growth is primarily fueled by the indispensable role of PD pumps in critical industries such as oil & gas, chemicals, and water & wastewater treatment, all of which are experiencing sustained investment and operational enhancements across the region. The inherent ability of PD pumps to accurately deliver precise volumes, handle viscous fluids, and operate under high pressures makes them the preferred choice for many demanding applications. Furthermore, ongoing technological advancements, including the development of more energy-efficient designs and smart functionalities, are contributing to market momentum.
Key trends shaping the North American PD Pump market include a growing emphasis on sustainability and operational efficiency, pushing for pumps that minimize energy consumption and reduce maintenance downtime. The oil & gas sector, despite fluctuations, continues to represent a substantial segment due to its high reliance on PD pumps for exploration, extraction, and refining processes. The chemicals industry, with its diverse and often corrosive fluid requirements, also presents a strong demand. The water and wastewater treatment segment is witnessing expansion driven by infrastructure upgrades and stricter environmental regulations. While the market is generally robust, potential restraints include the initial capital investment associated with some PD pump technologies and the presence of established competitors. However, the broad applicability across diverse end-user industries and the continuous drive for enhanced process control and reliability are expected to outweigh these challenges, ensuring a healthy growth trajectory for the North American PD Pump market.
This comprehensive report offers an in-depth analysis of the North America (NA) Positive Displacement Pumps Market, providing critical insights into its dynamics, growth trajectories, and future potential. Covering the study period from 2019 to 2033, with a base and estimated year of 2025 and a forecast period extending to 2033, this report is essential for industry professionals seeking to understand market concentration, technological advancements, regulatory landscapes, and competitive strategies.
NA Positive Displacement Pumps Market Market Dynamics & Structure
The North American Positive Displacement Pumps market is characterized by a moderately concentrated structure, with key players like Flowserve Corporation, Xylem Inc., and SPX Flow Inc. holding significant market shares. Technological innovation is a primary driver, fueled by the demand for high-efficiency, low-maintenance pumping solutions across various industries. Regulatory frameworks, particularly concerning environmental protection and industrial safety in sectors like oil & gas and water & wastewater, also shape market dynamics. Competitive product substitutes, such as centrifugal pumps, exist but often fall short in applications requiring precise flow control and handling of viscous or abrasive fluids. End-user demographics are shifting towards industries prioritizing operational efficiency and sustainability. Mergers and acquisitions (M&A) trends, though not at an extreme pace, contribute to market consolidation and the expansion of product portfolios. For instance, the market has seen approximately 5-10 significant M&A deals annually over the historical period, impacting market share distribution and technological integration. Barriers to innovation often stem from high research and development costs and the lengthy validation processes required for critical industrial applications.
- Market Concentration: Moderate, with top 3 players accounting for an estimated 35-45% of the market share.
- Technological Innovation Drivers: Demand for energy efficiency, reduced maintenance, and handling of challenging fluids.
- Regulatory Frameworks: Stringent environmental and safety standards impacting product design and application.
- Competitive Product Substitutes: Centrifugal pumps, but with limitations in specific applications.
- End-User Demographics: Growth in industries focused on process optimization and resource management.
- M&A Trends: Steady consolidation and strategic acquisitions to enhance market reach and technological capabilities.
NA Positive Displacement Pumps Market Growth Trends & Insights
The NA Positive Displacement Pumps market is projected for robust growth, driven by escalating industrialization, increasing infrastructure development, and a growing emphasis on process efficiency. The market size, estimated at approximately $4,500 million units in 2025, is expected to witness a Compound Annual Growth Rate (CAGR) of around 5.5% during the forecast period (2025-2033). Adoption rates for advanced positive displacement pump technologies, particularly progressive cavity and lobe pumps, are on the rise due to their superior performance in handling abrasive, viscous, and shear-sensitive materials prevalent in sectors like oil & gas, chemicals, and food & beverage. Technological disruptions, such as the integration of IoT sensors for predictive maintenance and smart pump solutions offering remote monitoring and control, are transforming the market landscape. Consumer behavior is shifting towards total cost of ownership, prioritizing reliability, longevity, and energy savings over initial purchase price. This trend is further amplified by the growing awareness of environmental sustainability and the need to minimize operational footprints. The water and wastewater treatment sector, in particular, is a significant contributor to market penetration due to ongoing upgrades in infrastructure and stricter discharge regulations, demanding reliable and efficient pumping solutions. The pharmaceutical industry's continuous demand for sterile and precise fluid handling also underpins steady growth. Overall, the market is evolving from a hardware-centric model to a solution-oriented approach, where pump manufacturers offer integrated services and support. The historical period (2019-2024) demonstrated a steady upward trajectory, with an estimated CAGR of 5.2%, laying a strong foundation for future expansion. This consistent growth underscores the intrinsic value and indispensable role of positive displacement pumps in modern industrial operations.
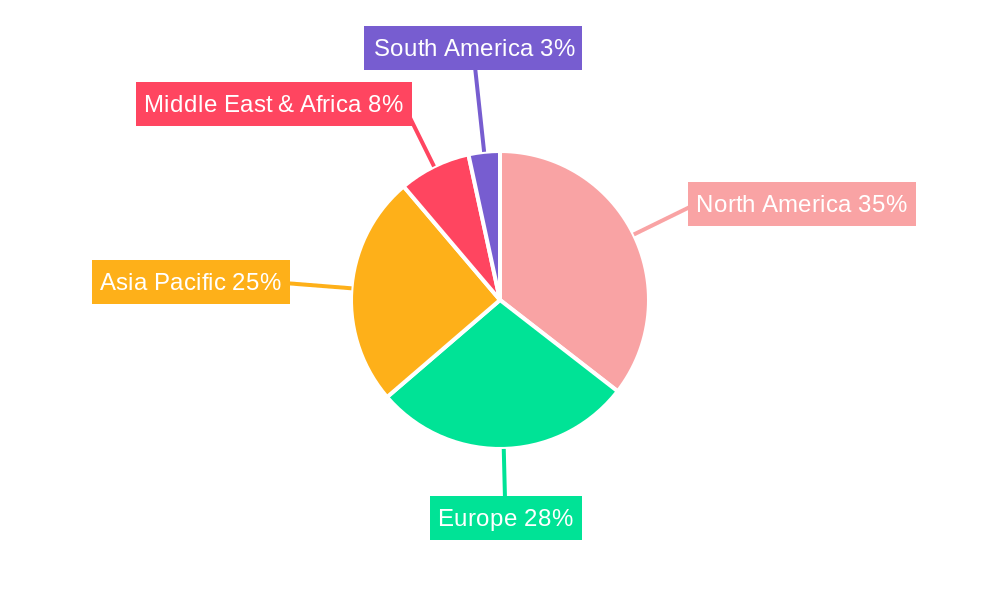
Dominant Regions, Countries, or Segments in NA Positive Displacement Pumps Market
Within the North American Positive Displacement Pumps market, the United States consistently emerges as the dominant country, driven by its vast industrial base, significant investments in infrastructure, and a strong presence of key end-user industries. The Oil & Gas and Water & Wastewater sectors are the most influential end-user industries, together accounting for an estimated 45-55% of the total market demand. In the Oil & Gas sector, the increasing demand for efficient extraction, transportation, and refining of crude oil and natural gas, coupled with the handling of viscous crude and petrochemicals, necessitates the use of high-performance positive displacement pumps, particularly screw and progressive cavity types. The United States' extensive shale gas and oil operations are a primary growth engine.
The Water & Wastewater sector's dominance is fueled by aging infrastructure requiring upgrades, stringent environmental regulations mandating advanced treatment processes, and the growing need for efficient sludge and wastewater transfer. The implementation of smart water management systems and the expansion of wastewater treatment facilities across urban and rural areas in the US and Canada contribute significantly to market growth.
Among the Type of Positive Displacement Pump, Gear Pumps and Lobe Pumps currently hold substantial market shares due to their versatility, reliability, and ability to handle a wide range of fluid viscosities. However, the Progressive Cavity Pump segment is experiencing the fastest growth, driven by its exceptional performance in handling abrasive slurries, sludge, and high-solids content fluids, making it indispensable for the oil & gas, mining, and municipal wastewater treatment industries. The Diaphragm Pump segment also plays a crucial role, especially in chemical processing and pharmaceutical applications where precise dosing and containment are paramount.
- Dominant Country: United States, contributing approximately 70-75% of the NA market.
- Dominant End-User Industries:
- Oil & Gas: Driven by extraction, refining, and petrochemical operations. Market share estimated at 25-30%.
- Water & Wastewater: Fueled by infrastructure upgrades and regulatory compliance. Market share estimated at 20-25%.
- Fastest-Growing Pump Type: Progressive Cavity Pumps, due to their superior handling of challenging fluids.
- Key Growth Drivers:
- Economic Policies: Government incentives for infrastructure development and energy production.
- Infrastructure Investment: Significant spending on water and wastewater treatment facilities.
- Environmental Regulations: Increasingly stringent standards for industrial discharge and waste management.
- Technological Advancements: Development of energy-efficient and smart pumping solutions.
NA Positive Displacement Pumps Market Product Landscape
The NA Positive Displacement Pumps market is characterized by continuous product innovation focused on enhancing efficiency, durability, and adaptability. Manufacturers are increasingly integrating advanced materials for improved wear resistance, especially for pumps handling abrasive media in the oil & gas and mining sectors. Innovations include the development of specialized sealing technologies for zero-emission applications, crucial for the pharmaceutical and chemical industries. Performance metrics like flow rate accuracy, pressure capability, and energy consumption are being optimized through advanced hydraulic designs and material science. Unique selling propositions often revolve around customization capabilities to meet specific process requirements, such as handling high-temperature fluids or aggressive chemicals. Technological advancements also encompass smart features, including integrated sensors for real-time performance monitoring, diagnostics, and predictive maintenance, thereby reducing downtime and operational costs. The integration of IoT capabilities is a significant trend, allowing for remote control and data analytics, further enhancing operational efficiency.
Key Drivers, Barriers & Challenges in NA Positive Displacement Pumps Market
Key Drivers:
- Growing Industrial Automation: Increasing adoption of automated processes across manufacturing, food & beverage, and pharmaceutical industries drives demand for reliable fluid handling.
- Infrastructure Development & Renewal: Significant investments in water, wastewater, and energy infrastructure globally necessitate efficient pumping solutions.
- Stringent Environmental Regulations: Growing pressure to reduce emissions and improve waste management spurs demand for advanced, efficient pump technologies.
- Demand for High-Efficiency and Low-Maintenance Solutions: Industries are increasingly seeking pumps that offer reduced energy consumption and longer service intervals.
Barriers & Challenges:
- High Initial Investment Costs: Positive displacement pumps, particularly specialized models, can have a higher upfront cost compared to some alternatives.
- Supply Chain Disruptions: Global supply chain volatility can impact the availability of raw materials and components, leading to increased lead times and costs. (Estimated impact: 5-10% increase in lead times during peak disruptions).
- Skilled Labor Shortage: A lack of skilled technicians for installation, maintenance, and repair can hinder market growth in certain regions.
- Competition from Alternative Technologies: While displacement pumps excel in specific applications, centrifugal pumps remain a competitive alternative for lower viscosity fluids.
Emerging Opportunities in NA Positive Displacement Pumps Market
Emerging opportunities in the NA Positive Displacement Pumps market are largely driven by the increasing focus on sustainability and digitalization. The growing demand for pumps capable of handling challenging and unconventional fluids, such as biofuels and advanced chemical compounds, presents a significant avenue for growth. The expansion of renewable energy sectors, including solar and wind power generation, requires specialized pumping solutions for various operational aspects, creating untapped market potential. Furthermore, the adoption of Industry 4.0 principles is opening doors for smart pumps with integrated AI and IoT capabilities, enabling predictive maintenance, remote monitoring, and optimized performance, which will be crucial for future market expansion. The development of more compact and energy-efficient pump designs for decentralized systems and smaller-scale industrial applications also represents a burgeoning opportunity.
Growth Accelerators in the NA Positive Displacement Pumps Market Industry
Several factors are accelerating the long-term growth of the NA Positive Displacement Pumps market. Technological breakthroughs in material science are leading to the development of more durable, corrosion-resistant, and wear-resistant pump components, extending product lifecycles and reducing maintenance needs. Strategic partnerships between pump manufacturers and automation solution providers are creating integrated systems that offer enhanced efficiency and connectivity. Market expansion strategies, including targeted outreach to emerging industrial sectors and regions, are also playing a vital role. The continuous drive for process optimization and adherence to stricter environmental standards across various industries will further catalyze the demand for advanced positive displacement pump technologies, ensuring sustained growth.
Key Players Shaping the NA Positive Displacement Pumps Market Market
- Ampco Pumps Company Inc
- Flowserve Corporation
- Xylem Inc.
- Springer Pumps LLC
- Centec LLC
- Titan Manufacturing Inc
- ITT Inc
- SPX Flow Inc
- Liquidyne Process Technologies Inc
- Dickow Pump Co
- Pentair PLC
Notable Milestones in NA Positive Displacement Pumps Market Sector
- April 2022: Vogelsang announced its new virtual showroom that offers a comprehensive view of shredding and positive displacement pumping solutions for wastewater collection and treatment. From a 360-degree perspective, visitors experience pumping, shredding, and disintegration technologies for use in sewers and sewage treatment plants.
In-Depth NA Positive Displacement Pumps Market Market Outlook
The NA Positive Displacement Pumps market is poised for sustained and dynamic growth, driven by a confluence of technological innovation, stringent regulatory demands, and evolving industrial needs. The continued investment in critical infrastructure, particularly in water and wastewater management, will remain a foundational pillar of market expansion. The increasing adoption of smart pump technologies, integrating IoT and AI for predictive maintenance and enhanced operational efficiency, represents a significant growth accelerator, offering greater value to end-users. Furthermore, the ongoing demand for solutions capable of handling challenging fluids, such as viscous, abrasive, and shear-sensitive materials, will continue to fuel innovation in pump design and material science, particularly benefiting the progressive cavity and lobe pump segments. The market's future trajectory will also be shaped by its adaptability to emerging industrial trends, including the growth of the bio-economy and the need for specialized pumping solutions in advanced manufacturing. Overall, the outlook for the NA Positive Displacement Pumps market is highly positive, with ample opportunities for both established players and new entrants to capitalize on innovation and market demand.
NA Positive Displacement Pumps Market Segmentation
-
1. Type of Positive Displacement Pump
- 1.1. Diaphragm
- 1.2. Piston
- 1.3. Gear
- 1.4. Lobe
- 1.5. Progressive Cavity
- 1.6. Screw
- 1.7. Vane
- 1.8. Peristaltic
-
2. End-user Industries
- 2.1. Oil & Gas
- 2.2. Chemicals
- 2.3. Food & Beverage
- 2.4. Water & Wastewater
- 2.5. Pharmaceutical
- 2.6. Power
- 2.7. Others
NA Positive Displacement Pumps Market Segmentation By Geography
-
1. North America
- 1.1. United States
- 1.2. Canada
- 1.3. Mexico
-
2. South America
- 2.1. Brazil
- 2.2. Argentina
- 2.3. Rest of South America
-
3. Europe
- 3.1. United Kingdom
- 3.2. Germany
- 3.3. France
- 3.4. Italy
- 3.5. Spain
- 3.6. Russia
- 3.7. Benelux
- 3.8. Nordics
- 3.9. Rest of Europe
-
4. Middle East & Africa
- 4.1. Turkey
- 4.2. Israel
- 4.3. GCC
- 4.4. North Africa
- 4.5. South Africa
- 4.6. Rest of Middle East & Africa
-
5. Asia Pacific
- 5.1. China
- 5.2. India
- 5.3. Japan
- 5.4. South Korea
- 5.5. ASEAN
- 5.6. Oceania
- 5.7. Rest of Asia Pacific
NA Positive Displacement Pumps Market REPORT HIGHLIGHTS
| Aspects | Details |
|---|---|
| Study Period | 2019-2033 |
| Base Year | 2024 |
| Estimated Year | 2025 |
| Forecast Period | 2025-2033 |
| Historical Period | 2019-2024 |
| Growth Rate | CAGR of 4.33% from 2019-2033 |
| Segmentation |
|
Table of Contents
- 1. Introduction
- 1.1. Research Scope
- 1.2. Market Segmentation
- 1.3. Research Methodology
- 1.4. Definitions and Assumptions
- 2. Executive Summary
- 2.1. Introduction
- 3. Market Dynamics
- 3.1. Introduction
- 3.2. Market Drivers
- 3.2.1. Increasing Popularity of MEMS Technology; Increasing demand of water treatment facilities in the region
- 3.3. Market Restrains
- 3.3.1. ; Lack of Standard Protocols for the Development of Power Modules; Slow Adoption of New Technologies Derailing Innovation
- 3.4. Market Trends
- 3.4.1. Food & Beverage Segment is Expected to Witness Significant Growth
- 4. Market Factor Analysis
- 4.1. Porters Five Forces
- 4.2. Supply/Value Chain
- 4.3. PESTEL analysis
- 4.4. Market Entropy
- 4.5. Patent/Trademark Analysis
- 5. Global NA Positive Displacement Pumps Market Analysis, Insights and Forecast, 2019-2031
- 5.1. Market Analysis, Insights and Forecast - by Type of Positive Displacement Pump
- 5.1.1. Diaphragm
- 5.1.2. Piston
- 5.1.3. Gear
- 5.1.4. Lobe
- 5.1.5. Progressive Cavity
- 5.1.6. Screw
- 5.1.7. Vane
- 5.1.8. Peristaltic
- 5.2. Market Analysis, Insights and Forecast - by End-user Industries
- 5.2.1. Oil & Gas
- 5.2.2. Chemicals
- 5.2.3. Food & Beverage
- 5.2.4. Water & Wastewater
- 5.2.5. Pharmaceutical
- 5.2.6. Power
- 5.2.7. Others
- 5.3. Market Analysis, Insights and Forecast - by Region
- 5.3.1. North America
- 5.3.2. South America
- 5.3.3. Europe
- 5.3.4. Middle East & Africa
- 5.3.5. Asia Pacific
- 5.1. Market Analysis, Insights and Forecast - by Type of Positive Displacement Pump
- 6. North America NA Positive Displacement Pumps Market Analysis, Insights and Forecast, 2019-2031
- 6.1. Market Analysis, Insights and Forecast - by Type of Positive Displacement Pump
- 6.1.1. Diaphragm
- 6.1.2. Piston
- 6.1.3. Gear
- 6.1.4. Lobe
- 6.1.5. Progressive Cavity
- 6.1.6. Screw
- 6.1.7. Vane
- 6.1.8. Peristaltic
- 6.2. Market Analysis, Insights and Forecast - by End-user Industries
- 6.2.1. Oil & Gas
- 6.2.2. Chemicals
- 6.2.3. Food & Beverage
- 6.2.4. Water & Wastewater
- 6.2.5. Pharmaceutical
- 6.2.6. Power
- 6.2.7. Others
- 6.1. Market Analysis, Insights and Forecast - by Type of Positive Displacement Pump
- 7. South America NA Positive Displacement Pumps Market Analysis, Insights and Forecast, 2019-2031
- 7.1. Market Analysis, Insights and Forecast - by Type of Positive Displacement Pump
- 7.1.1. Diaphragm
- 7.1.2. Piston
- 7.1.3. Gear
- 7.1.4. Lobe
- 7.1.5. Progressive Cavity
- 7.1.6. Screw
- 7.1.7. Vane
- 7.1.8. Peristaltic
- 7.2. Market Analysis, Insights and Forecast - by End-user Industries
- 7.2.1. Oil & Gas
- 7.2.2. Chemicals
- 7.2.3. Food & Beverage
- 7.2.4. Water & Wastewater
- 7.2.5. Pharmaceutical
- 7.2.6. Power
- 7.2.7. Others
- 7.1. Market Analysis, Insights and Forecast - by Type of Positive Displacement Pump
- 8. Europe NA Positive Displacement Pumps Market Analysis, Insights and Forecast, 2019-2031
- 8.1. Market Analysis, Insights and Forecast - by Type of Positive Displacement Pump
- 8.1.1. Diaphragm
- 8.1.2. Piston
- 8.1.3. Gear
- 8.1.4. Lobe
- 8.1.5. Progressive Cavity
- 8.1.6. Screw
- 8.1.7. Vane
- 8.1.8. Peristaltic
- 8.2. Market Analysis, Insights and Forecast - by End-user Industries
- 8.2.1. Oil & Gas
- 8.2.2. Chemicals
- 8.2.3. Food & Beverage
- 8.2.4. Water & Wastewater
- 8.2.5. Pharmaceutical
- 8.2.6. Power
- 8.2.7. Others
- 8.1. Market Analysis, Insights and Forecast - by Type of Positive Displacement Pump
- 9. Middle East & Africa NA Positive Displacement Pumps Market Analysis, Insights and Forecast, 2019-2031
- 9.1. Market Analysis, Insights and Forecast - by Type of Positive Displacement Pump
- 9.1.1. Diaphragm
- 9.1.2. Piston
- 9.1.3. Gear
- 9.1.4. Lobe
- 9.1.5. Progressive Cavity
- 9.1.6. Screw
- 9.1.7. Vane
- 9.1.8. Peristaltic
- 9.2. Market Analysis, Insights and Forecast - by End-user Industries
- 9.2.1. Oil & Gas
- 9.2.2. Chemicals
- 9.2.3. Food & Beverage
- 9.2.4. Water & Wastewater
- 9.2.5. Pharmaceutical
- 9.2.6. Power
- 9.2.7. Others
- 9.1. Market Analysis, Insights and Forecast - by Type of Positive Displacement Pump
- 10. Asia Pacific NA Positive Displacement Pumps Market Analysis, Insights and Forecast, 2019-2031
- 10.1. Market Analysis, Insights and Forecast - by Type of Positive Displacement Pump
- 10.1.1. Diaphragm
- 10.1.2. Piston
- 10.1.3. Gear
- 10.1.4. Lobe
- 10.1.5. Progressive Cavity
- 10.1.6. Screw
- 10.1.7. Vane
- 10.1.8. Peristaltic
- 10.2. Market Analysis, Insights and Forecast - by End-user Industries
- 10.2.1. Oil & Gas
- 10.2.2. Chemicals
- 10.2.3. Food & Beverage
- 10.2.4. Water & Wastewater
- 10.2.5. Pharmaceutical
- 10.2.6. Power
- 10.2.7. Others
- 10.1. Market Analysis, Insights and Forecast - by Type of Positive Displacement Pump
- 11. China NA Positive Displacement Pumps Market Analysis, Insights and Forecast, 2019-2031
- 11.1. Market Analysis, Insights and Forecast - By Country/Sub-region
- 11.1.1.
- 12. Taiwan NA Positive Displacement Pumps Market Analysis, Insights and Forecast, 2019-2031
- 12.1. Market Analysis, Insights and Forecast - By Country/Sub-region
- 12.1.1.
- 13. United States NA Positive Displacement Pumps Market Analysis, Insights and Forecast, 2019-2031
- 13.1. Market Analysis, Insights and Forecast - By Country/Sub-region
- 13.1.1.
- 14. South Korea NA Positive Displacement Pumps Market Analysis, Insights and Forecast, 2019-2031
- 14.1. Market Analysis, Insights and Forecast - By Country/Sub-region
- 14.1.1.
- 15. Malaysia NA Positive Displacement Pumps Market Analysis, Insights and Forecast, 2019-2031
- 15.1. Market Analysis, Insights and Forecast - By Country/Sub-region
- 15.1.1.
- 16. Singapore NA Positive Displacement Pumps Market Analysis, Insights and Forecast, 2019-2031
- 16.1. Market Analysis, Insights and Forecast - By Country/Sub-region
- 16.1.1.
- 17. Japan NA Positive Displacement Pumps Market Analysis, Insights and Forecast, 2019-2031
- 17.1. Market Analysis, Insights and Forecast - By Country/Sub-region
- 17.1.1.
- 18. Competitive Analysis
- 18.1. Global Market Share Analysis 2024
- 18.2. Company Profiles
- 18.2.1 Ampco Pumps Company Inc
- 18.2.1.1. Overview
- 18.2.1.2. Products
- 18.2.1.3. SWOT Analysis
- 18.2.1.4. Recent Developments
- 18.2.1.5. Financials (Based on Availability)
- 18.2.2 Flowserve Corporation
- 18.2.2.1. Overview
- 18.2.2.2. Products
- 18.2.2.3. SWOT Analysis
- 18.2.2.4. Recent Developments
- 18.2.2.5. Financials (Based on Availability)
- 18.2.3 Xylem Inc
- 18.2.3.1. Overview
- 18.2.3.2. Products
- 18.2.3.3. SWOT Analysis
- 18.2.3.4. Recent Developments
- 18.2.3.5. Financials (Based on Availability)
- 18.2.4 Springer Pumps LLC
- 18.2.4.1. Overview
- 18.2.4.2. Products
- 18.2.4.3. SWOT Analysis
- 18.2.4.4. Recent Developments
- 18.2.4.5. Financials (Based on Availability)
- 18.2.5 Centec LLC
- 18.2.5.1. Overview
- 18.2.5.2. Products
- 18.2.5.3. SWOT Analysis
- 18.2.5.4. Recent Developments
- 18.2.5.5. Financials (Based on Availability)
- 18.2.6 Titan Manufacturing Inc
- 18.2.6.1. Overview
- 18.2.6.2. Products
- 18.2.6.3. SWOT Analysis
- 18.2.6.4. Recent Developments
- 18.2.6.5. Financials (Based on Availability)
- 18.2.7 ITT Inc
- 18.2.7.1. Overview
- 18.2.7.2. Products
- 18.2.7.3. SWOT Analysis
- 18.2.7.4. Recent Developments
- 18.2.7.5. Financials (Based on Availability)
- 18.2.8 SPX Flow Inc
- 18.2.8.1. Overview
- 18.2.8.2. Products
- 18.2.8.3. SWOT Analysis
- 18.2.8.4. Recent Developments
- 18.2.8.5. Financials (Based on Availability)
- 18.2.9 Liquidyne Process Technologies Inc
- 18.2.9.1. Overview
- 18.2.9.2. Products
- 18.2.9.3. SWOT Analysis
- 18.2.9.4. Recent Developments
- 18.2.9.5. Financials (Based on Availability)
- 18.2.10 Dickow Pump Co
- 18.2.10.1. Overview
- 18.2.10.2. Products
- 18.2.10.3. SWOT Analysis
- 18.2.10.4. Recent Developments
- 18.2.10.5. Financials (Based on Availability)
- 18.2.11 Pentair PLC
- 18.2.11.1. Overview
- 18.2.11.2. Products
- 18.2.11.3. SWOT Analysis
- 18.2.11.4. Recent Developments
- 18.2.11.5. Financials (Based on Availability)
- 18.2.1 Ampco Pumps Company Inc
List of Figures
- Figure 1: Global NA Positive Displacement Pumps Market Revenue Breakdown (Million, %) by Region 2024 & 2032
- Figure 2: Global NA Positive Displacement Pumps Market Volume Breakdown (K Unit, %) by Region 2024 & 2032
- Figure 3: China NA Positive Displacement Pumps Market Revenue (Million), by Country 2024 & 2032
- Figure 4: China NA Positive Displacement Pumps Market Volume (K Unit), by Country 2024 & 2032
- Figure 5: China NA Positive Displacement Pumps Market Revenue Share (%), by Country 2024 & 2032
- Figure 6: China NA Positive Displacement Pumps Market Volume Share (%), by Country 2024 & 2032
- Figure 7: Taiwan NA Positive Displacement Pumps Market Revenue (Million), by Country 2024 & 2032
- Figure 8: Taiwan NA Positive Displacement Pumps Market Volume (K Unit), by Country 2024 & 2032
- Figure 9: Taiwan NA Positive Displacement Pumps Market Revenue Share (%), by Country 2024 & 2032
- Figure 10: Taiwan NA Positive Displacement Pumps Market Volume Share (%), by Country 2024 & 2032
- Figure 11: United States NA Positive Displacement Pumps Market Revenue (Million), by Country 2024 & 2032
- Figure 12: United States NA Positive Displacement Pumps Market Volume (K Unit), by Country 2024 & 2032
- Figure 13: United States NA Positive Displacement Pumps Market Revenue Share (%), by Country 2024 & 2032
- Figure 14: United States NA Positive Displacement Pumps Market Volume Share (%), by Country 2024 & 2032
- Figure 15: South Korea NA Positive Displacement Pumps Market Revenue (Million), by Country 2024 & 2032
- Figure 16: South Korea NA Positive Displacement Pumps Market Volume (K Unit), by Country 2024 & 2032
- Figure 17: South Korea NA Positive Displacement Pumps Market Revenue Share (%), by Country 2024 & 2032
- Figure 18: South Korea NA Positive Displacement Pumps Market Volume Share (%), by Country 2024 & 2032
- Figure 19: Malaysia NA Positive Displacement Pumps Market Revenue (Million), by Country 2024 & 2032
- Figure 20: Malaysia NA Positive Displacement Pumps Market Volume (K Unit), by Country 2024 & 2032
- Figure 21: Malaysia NA Positive Displacement Pumps Market Revenue Share (%), by Country 2024 & 2032
- Figure 22: Malaysia NA Positive Displacement Pumps Market Volume Share (%), by Country 2024 & 2032
- Figure 23: Singapore NA Positive Displacement Pumps Market Revenue (Million), by Country 2024 & 2032
- Figure 24: Singapore NA Positive Displacement Pumps Market Volume (K Unit), by Country 2024 & 2032
- Figure 25: Singapore NA Positive Displacement Pumps Market Revenue Share (%), by Country 2024 & 2032
- Figure 26: Singapore NA Positive Displacement Pumps Market Volume Share (%), by Country 2024 & 2032
- Figure 27: Japan NA Positive Displacement Pumps Market Revenue (Million), by Country 2024 & 2032
- Figure 28: Japan NA Positive Displacement Pumps Market Volume (K Unit), by Country 2024 & 2032
- Figure 29: Japan NA Positive Displacement Pumps Market Revenue Share (%), by Country 2024 & 2032
- Figure 30: Japan NA Positive Displacement Pumps Market Volume Share (%), by Country 2024 & 2032
- Figure 31: North America NA Positive Displacement Pumps Market Revenue (Million), by Type of Positive Displacement Pump 2024 & 2032
- Figure 32: North America NA Positive Displacement Pumps Market Volume (K Unit), by Type of Positive Displacement Pump 2024 & 2032
- Figure 33: North America NA Positive Displacement Pumps Market Revenue Share (%), by Type of Positive Displacement Pump 2024 & 2032
- Figure 34: North America NA Positive Displacement Pumps Market Volume Share (%), by Type of Positive Displacement Pump 2024 & 2032
- Figure 35: North America NA Positive Displacement Pumps Market Revenue (Million), by End-user Industries 2024 & 2032
- Figure 36: North America NA Positive Displacement Pumps Market Volume (K Unit), by End-user Industries 2024 & 2032
- Figure 37: North America NA Positive Displacement Pumps Market Revenue Share (%), by End-user Industries 2024 & 2032
- Figure 38: North America NA Positive Displacement Pumps Market Volume Share (%), by End-user Industries 2024 & 2032
- Figure 39: North America NA Positive Displacement Pumps Market Revenue (Million), by Country 2024 & 2032
- Figure 40: North America NA Positive Displacement Pumps Market Volume (K Unit), by Country 2024 & 2032
- Figure 41: North America NA Positive Displacement Pumps Market Revenue Share (%), by Country 2024 & 2032
- Figure 42: North America NA Positive Displacement Pumps Market Volume Share (%), by Country 2024 & 2032
- Figure 43: South America NA Positive Displacement Pumps Market Revenue (Million), by Type of Positive Displacement Pump 2024 & 2032
- Figure 44: South America NA Positive Displacement Pumps Market Volume (K Unit), by Type of Positive Displacement Pump 2024 & 2032
- Figure 45: South America NA Positive Displacement Pumps Market Revenue Share (%), by Type of Positive Displacement Pump 2024 & 2032
- Figure 46: South America NA Positive Displacement Pumps Market Volume Share (%), by Type of Positive Displacement Pump 2024 & 2032
- Figure 47: South America NA Positive Displacement Pumps Market Revenue (Million), by End-user Industries 2024 & 2032
- Figure 48: South America NA Positive Displacement Pumps Market Volume (K Unit), by End-user Industries 2024 & 2032
- Figure 49: South America NA Positive Displacement Pumps Market Revenue Share (%), by End-user Industries 2024 & 2032
- Figure 50: South America NA Positive Displacement Pumps Market Volume Share (%), by End-user Industries 2024 & 2032
- Figure 51: South America NA Positive Displacement Pumps Market Revenue (Million), by Country 2024 & 2032
- Figure 52: South America NA Positive Displacement Pumps Market Volume (K Unit), by Country 2024 & 2032
- Figure 53: South America NA Positive Displacement Pumps Market Revenue Share (%), by Country 2024 & 2032
- Figure 54: South America NA Positive Displacement Pumps Market Volume Share (%), by Country 2024 & 2032
- Figure 55: Europe NA Positive Displacement Pumps Market Revenue (Million), by Type of Positive Displacement Pump 2024 & 2032
- Figure 56: Europe NA Positive Displacement Pumps Market Volume (K Unit), by Type of Positive Displacement Pump 2024 & 2032
- Figure 57: Europe NA Positive Displacement Pumps Market Revenue Share (%), by Type of Positive Displacement Pump 2024 & 2032
- Figure 58: Europe NA Positive Displacement Pumps Market Volume Share (%), by Type of Positive Displacement Pump 2024 & 2032
- Figure 59: Europe NA Positive Displacement Pumps Market Revenue (Million), by End-user Industries 2024 & 2032
- Figure 60: Europe NA Positive Displacement Pumps Market Volume (K Unit), by End-user Industries 2024 & 2032
- Figure 61: Europe NA Positive Displacement Pumps Market Revenue Share (%), by End-user Industries 2024 & 2032
- Figure 62: Europe NA Positive Displacement Pumps Market Volume Share (%), by End-user Industries 2024 & 2032
- Figure 63: Europe NA Positive Displacement Pumps Market Revenue (Million), by Country 2024 & 2032
- Figure 64: Europe NA Positive Displacement Pumps Market Volume (K Unit), by Country 2024 & 2032
- Figure 65: Europe NA Positive Displacement Pumps Market Revenue Share (%), by Country 2024 & 2032
- Figure 66: Europe NA Positive Displacement Pumps Market Volume Share (%), by Country 2024 & 2032
- Figure 67: Middle East & Africa NA Positive Displacement Pumps Market Revenue (Million), by Type of Positive Displacement Pump 2024 & 2032
- Figure 68: Middle East & Africa NA Positive Displacement Pumps Market Volume (K Unit), by Type of Positive Displacement Pump 2024 & 2032
- Figure 69: Middle East & Africa NA Positive Displacement Pumps Market Revenue Share (%), by Type of Positive Displacement Pump 2024 & 2032
- Figure 70: Middle East & Africa NA Positive Displacement Pumps Market Volume Share (%), by Type of Positive Displacement Pump 2024 & 2032
- Figure 71: Middle East & Africa NA Positive Displacement Pumps Market Revenue (Million), by End-user Industries 2024 & 2032
- Figure 72: Middle East & Africa NA Positive Displacement Pumps Market Volume (K Unit), by End-user Industries 2024 & 2032
- Figure 73: Middle East & Africa NA Positive Displacement Pumps Market Revenue Share (%), by End-user Industries 2024 & 2032
- Figure 74: Middle East & Africa NA Positive Displacement Pumps Market Volume Share (%), by End-user Industries 2024 & 2032
- Figure 75: Middle East & Africa NA Positive Displacement Pumps Market Revenue (Million), by Country 2024 & 2032
- Figure 76: Middle East & Africa NA Positive Displacement Pumps Market Volume (K Unit), by Country 2024 & 2032
- Figure 77: Middle East & Africa NA Positive Displacement Pumps Market Revenue Share (%), by Country 2024 & 2032
- Figure 78: Middle East & Africa NA Positive Displacement Pumps Market Volume Share (%), by Country 2024 & 2032
- Figure 79: Asia Pacific NA Positive Displacement Pumps Market Revenue (Million), by Type of Positive Displacement Pump 2024 & 2032
- Figure 80: Asia Pacific NA Positive Displacement Pumps Market Volume (K Unit), by Type of Positive Displacement Pump 2024 & 2032
- Figure 81: Asia Pacific NA Positive Displacement Pumps Market Revenue Share (%), by Type of Positive Displacement Pump 2024 & 2032
- Figure 82: Asia Pacific NA Positive Displacement Pumps Market Volume Share (%), by Type of Positive Displacement Pump 2024 & 2032
- Figure 83: Asia Pacific NA Positive Displacement Pumps Market Revenue (Million), by End-user Industries 2024 & 2032
- Figure 84: Asia Pacific NA Positive Displacement Pumps Market Volume (K Unit), by End-user Industries 2024 & 2032
- Figure 85: Asia Pacific NA Positive Displacement Pumps Market Revenue Share (%), by End-user Industries 2024 & 2032
- Figure 86: Asia Pacific NA Positive Displacement Pumps Market Volume Share (%), by End-user Industries 2024 & 2032
- Figure 87: Asia Pacific NA Positive Displacement Pumps Market Revenue (Million), by Country 2024 & 2032
- Figure 88: Asia Pacific NA Positive Displacement Pumps Market Volume (K Unit), by Country 2024 & 2032
- Figure 89: Asia Pacific NA Positive Displacement Pumps Market Revenue Share (%), by Country 2024 & 2032
- Figure 90: Asia Pacific NA Positive Displacement Pumps Market Volume Share (%), by Country 2024 & 2032
List of Tables
- Table 1: Global NA Positive Displacement Pumps Market Revenue Million Forecast, by Region 2019 & 2032
- Table 2: Global NA Positive Displacement Pumps Market Volume K Unit Forecast, by Region 2019 & 2032
- Table 3: Global NA Positive Displacement Pumps Market Revenue Million Forecast, by Type of Positive Displacement Pump 2019 & 2032
- Table 4: Global NA Positive Displacement Pumps Market Volume K Unit Forecast, by Type of Positive Displacement Pump 2019 & 2032
- Table 5: Global NA Positive Displacement Pumps Market Revenue Million Forecast, by End-user Industries 2019 & 2032
- Table 6: Global NA Positive Displacement Pumps Market Volume K Unit Forecast, by End-user Industries 2019 & 2032
- Table 7: Global NA Positive Displacement Pumps Market Revenue Million Forecast, by Region 2019 & 2032
- Table 8: Global NA Positive Displacement Pumps Market Volume K Unit Forecast, by Region 2019 & 2032
- Table 9: Global NA Positive Displacement Pumps Market Revenue Million Forecast, by Country 2019 & 2032
- Table 10: Global NA Positive Displacement Pumps Market Volume K Unit Forecast, by Country 2019 & 2032
- Table 11: NA Positive Displacement Pumps Market Revenue (Million) Forecast, by Application 2019 & 2032
- Table 12: NA Positive Displacement Pumps Market Volume (K Unit) Forecast, by Application 2019 & 2032
- Table 13: Global NA Positive Displacement Pumps Market Revenue Million Forecast, by Country 2019 & 2032
- Table 14: Global NA Positive Displacement Pumps Market Volume K Unit Forecast, by Country 2019 & 2032
- Table 15: NA Positive Displacement Pumps Market Revenue (Million) Forecast, by Application 2019 & 2032
- Table 16: NA Positive Displacement Pumps Market Volume (K Unit) Forecast, by Application 2019 & 2032
- Table 17: Global NA Positive Displacement Pumps Market Revenue Million Forecast, by Country 2019 & 2032
- Table 18: Global NA Positive Displacement Pumps Market Volume K Unit Forecast, by Country 2019 & 2032
- Table 19: NA Positive Displacement Pumps Market Revenue (Million) Forecast, by Application 2019 & 2032
- Table 20: NA Positive Displacement Pumps Market Volume (K Unit) Forecast, by Application 2019 & 2032
- Table 21: Global NA Positive Displacement Pumps Market Revenue Million Forecast, by Country 2019 & 2032
- Table 22: Global NA Positive Displacement Pumps Market Volume K Unit Forecast, by Country 2019 & 2032
- Table 23: NA Positive Displacement Pumps Market Revenue (Million) Forecast, by Application 2019 & 2032
- Table 24: NA Positive Displacement Pumps Market Volume (K Unit) Forecast, by Application 2019 & 2032
- Table 25: Global NA Positive Displacement Pumps Market Revenue Million Forecast, by Country 2019 & 2032
- Table 26: Global NA Positive Displacement Pumps Market Volume K Unit Forecast, by Country 2019 & 2032
- Table 27: NA Positive Displacement Pumps Market Revenue (Million) Forecast, by Application 2019 & 2032
- Table 28: NA Positive Displacement Pumps Market Volume (K Unit) Forecast, by Application 2019 & 2032
- Table 29: Global NA Positive Displacement Pumps Market Revenue Million Forecast, by Country 2019 & 2032
- Table 30: Global NA Positive Displacement Pumps Market Volume K Unit Forecast, by Country 2019 & 2032
- Table 31: NA Positive Displacement Pumps Market Revenue (Million) Forecast, by Application 2019 & 2032
- Table 32: NA Positive Displacement Pumps Market Volume (K Unit) Forecast, by Application 2019 & 2032
- Table 33: Global NA Positive Displacement Pumps Market Revenue Million Forecast, by Country 2019 & 2032
- Table 34: Global NA Positive Displacement Pumps Market Volume K Unit Forecast, by Country 2019 & 2032
- Table 35: NA Positive Displacement Pumps Market Revenue (Million) Forecast, by Application 2019 & 2032
- Table 36: NA Positive Displacement Pumps Market Volume (K Unit) Forecast, by Application 2019 & 2032
- Table 37: Global NA Positive Displacement Pumps Market Revenue Million Forecast, by Type of Positive Displacement Pump 2019 & 2032
- Table 38: Global NA Positive Displacement Pumps Market Volume K Unit Forecast, by Type of Positive Displacement Pump 2019 & 2032
- Table 39: Global NA Positive Displacement Pumps Market Revenue Million Forecast, by End-user Industries 2019 & 2032
- Table 40: Global NA Positive Displacement Pumps Market Volume K Unit Forecast, by End-user Industries 2019 & 2032
- Table 41: Global NA Positive Displacement Pumps Market Revenue Million Forecast, by Country 2019 & 2032
- Table 42: Global NA Positive Displacement Pumps Market Volume K Unit Forecast, by Country 2019 & 2032
- Table 43: United States NA Positive Displacement Pumps Market Revenue (Million) Forecast, by Application 2019 & 2032
- Table 44: United States NA Positive Displacement Pumps Market Volume (K Unit) Forecast, by Application 2019 & 2032
- Table 45: Canada NA Positive Displacement Pumps Market Revenue (Million) Forecast, by Application 2019 & 2032
- Table 46: Canada NA Positive Displacement Pumps Market Volume (K Unit) Forecast, by Application 2019 & 2032
- Table 47: Mexico NA Positive Displacement Pumps Market Revenue (Million) Forecast, by Application 2019 & 2032
- Table 48: Mexico NA Positive Displacement Pumps Market Volume (K Unit) Forecast, by Application 2019 & 2032
- Table 49: Global NA Positive Displacement Pumps Market Revenue Million Forecast, by Type of Positive Displacement Pump 2019 & 2032
- Table 50: Global NA Positive Displacement Pumps Market Volume K Unit Forecast, by Type of Positive Displacement Pump 2019 & 2032
- Table 51: Global NA Positive Displacement Pumps Market Revenue Million Forecast, by End-user Industries 2019 & 2032
- Table 52: Global NA Positive Displacement Pumps Market Volume K Unit Forecast, by End-user Industries 2019 & 2032
- Table 53: Global NA Positive Displacement Pumps Market Revenue Million Forecast, by Country 2019 & 2032
- Table 54: Global NA Positive Displacement Pumps Market Volume K Unit Forecast, by Country 2019 & 2032
- Table 55: Brazil NA Positive Displacement Pumps Market Revenue (Million) Forecast, by Application 2019 & 2032
- Table 56: Brazil NA Positive Displacement Pumps Market Volume (K Unit) Forecast, by Application 2019 & 2032
- Table 57: Argentina NA Positive Displacement Pumps Market Revenue (Million) Forecast, by Application 2019 & 2032
- Table 58: Argentina NA Positive Displacement Pumps Market Volume (K Unit) Forecast, by Application 2019 & 2032
- Table 59: Rest of South America NA Positive Displacement Pumps Market Revenue (Million) Forecast, by Application 2019 & 2032
- Table 60: Rest of South America NA Positive Displacement Pumps Market Volume (K Unit) Forecast, by Application 2019 & 2032
- Table 61: Global NA Positive Displacement Pumps Market Revenue Million Forecast, by Type of Positive Displacement Pump 2019 & 2032
- Table 62: Global NA Positive Displacement Pumps Market Volume K Unit Forecast, by Type of Positive Displacement Pump 2019 & 2032
- Table 63: Global NA Positive Displacement Pumps Market Revenue Million Forecast, by End-user Industries 2019 & 2032
- Table 64: Global NA Positive Displacement Pumps Market Volume K Unit Forecast, by End-user Industries 2019 & 2032
- Table 65: Global NA Positive Displacement Pumps Market Revenue Million Forecast, by Country 2019 & 2032
- Table 66: Global NA Positive Displacement Pumps Market Volume K Unit Forecast, by Country 2019 & 2032
- Table 67: United Kingdom NA Positive Displacement Pumps Market Revenue (Million) Forecast, by Application 2019 & 2032
- Table 68: United Kingdom NA Positive Displacement Pumps Market Volume (K Unit) Forecast, by Application 2019 & 2032
- Table 69: Germany NA Positive Displacement Pumps Market Revenue (Million) Forecast, by Application 2019 & 2032
- Table 70: Germany NA Positive Displacement Pumps Market Volume (K Unit) Forecast, by Application 2019 & 2032
- Table 71: France NA Positive Displacement Pumps Market Revenue (Million) Forecast, by Application 2019 & 2032
- Table 72: France NA Positive Displacement Pumps Market Volume (K Unit) Forecast, by Application 2019 & 2032
- Table 73: Italy NA Positive Displacement Pumps Market Revenue (Million) Forecast, by Application 2019 & 2032
- Table 74: Italy NA Positive Displacement Pumps Market Volume (K Unit) Forecast, by Application 2019 & 2032
- Table 75: Spain NA Positive Displacement Pumps Market Revenue (Million) Forecast, by Application 2019 & 2032
- Table 76: Spain NA Positive Displacement Pumps Market Volume (K Unit) Forecast, by Application 2019 & 2032
- Table 77: Russia NA Positive Displacement Pumps Market Revenue (Million) Forecast, by Application 2019 & 2032
- Table 78: Russia NA Positive Displacement Pumps Market Volume (K Unit) Forecast, by Application 2019 & 2032
- Table 79: Benelux NA Positive Displacement Pumps Market Revenue (Million) Forecast, by Application 2019 & 2032
- Table 80: Benelux NA Positive Displacement Pumps Market Volume (K Unit) Forecast, by Application 2019 & 2032
- Table 81: Nordics NA Positive Displacement Pumps Market Revenue (Million) Forecast, by Application 2019 & 2032
- Table 82: Nordics NA Positive Displacement Pumps Market Volume (K Unit) Forecast, by Application 2019 & 2032
- Table 83: Rest of Europe NA Positive Displacement Pumps Market Revenue (Million) Forecast, by Application 2019 & 2032
- Table 84: Rest of Europe NA Positive Displacement Pumps Market Volume (K Unit) Forecast, by Application 2019 & 2032
- Table 85: Global NA Positive Displacement Pumps Market Revenue Million Forecast, by Type of Positive Displacement Pump 2019 & 2032
- Table 86: Global NA Positive Displacement Pumps Market Volume K Unit Forecast, by Type of Positive Displacement Pump 2019 & 2032
- Table 87: Global NA Positive Displacement Pumps Market Revenue Million Forecast, by End-user Industries 2019 & 2032
- Table 88: Global NA Positive Displacement Pumps Market Volume K Unit Forecast, by End-user Industries 2019 & 2032
- Table 89: Global NA Positive Displacement Pumps Market Revenue Million Forecast, by Country 2019 & 2032
- Table 90: Global NA Positive Displacement Pumps Market Volume K Unit Forecast, by Country 2019 & 2032
- Table 91: Turkey NA Positive Displacement Pumps Market Revenue (Million) Forecast, by Application 2019 & 2032
- Table 92: Turkey NA Positive Displacement Pumps Market Volume (K Unit) Forecast, by Application 2019 & 2032
- Table 93: Israel NA Positive Displacement Pumps Market Revenue (Million) Forecast, by Application 2019 & 2032
- Table 94: Israel NA Positive Displacement Pumps Market Volume (K Unit) Forecast, by Application 2019 & 2032
- Table 95: GCC NA Positive Displacement Pumps Market Revenue (Million) Forecast, by Application 2019 & 2032
- Table 96: GCC NA Positive Displacement Pumps Market Volume (K Unit) Forecast, by Application 2019 & 2032
- Table 97: North Africa NA Positive Displacement Pumps Market Revenue (Million) Forecast, by Application 2019 & 2032
- Table 98: North Africa NA Positive Displacement Pumps Market Volume (K Unit) Forecast, by Application 2019 & 2032
- Table 99: South Africa NA Positive Displacement Pumps Market Revenue (Million) Forecast, by Application 2019 & 2032
- Table 100: South Africa NA Positive Displacement Pumps Market Volume (K Unit) Forecast, by Application 2019 & 2032
- Table 101: Rest of Middle East & Africa NA Positive Displacement Pumps Market Revenue (Million) Forecast, by Application 2019 & 2032
- Table 102: Rest of Middle East & Africa NA Positive Displacement Pumps Market Volume (K Unit) Forecast, by Application 2019 & 2032
- Table 103: Global NA Positive Displacement Pumps Market Revenue Million Forecast, by Type of Positive Displacement Pump 2019 & 2032
- Table 104: Global NA Positive Displacement Pumps Market Volume K Unit Forecast, by Type of Positive Displacement Pump 2019 & 2032
- Table 105: Global NA Positive Displacement Pumps Market Revenue Million Forecast, by End-user Industries 2019 & 2032
- Table 106: Global NA Positive Displacement Pumps Market Volume K Unit Forecast, by End-user Industries 2019 & 2032
- Table 107: Global NA Positive Displacement Pumps Market Revenue Million Forecast, by Country 2019 & 2032
- Table 108: Global NA Positive Displacement Pumps Market Volume K Unit Forecast, by Country 2019 & 2032
- Table 109: China NA Positive Displacement Pumps Market Revenue (Million) Forecast, by Application 2019 & 2032
- Table 110: China NA Positive Displacement Pumps Market Volume (K Unit) Forecast, by Application 2019 & 2032
- Table 111: India NA Positive Displacement Pumps Market Revenue (Million) Forecast, by Application 2019 & 2032
- Table 112: India NA Positive Displacement Pumps Market Volume (K Unit) Forecast, by Application 2019 & 2032
- Table 113: Japan NA Positive Displacement Pumps Market Revenue (Million) Forecast, by Application 2019 & 2032
- Table 114: Japan NA Positive Displacement Pumps Market Volume (K Unit) Forecast, by Application 2019 & 2032
- Table 115: South Korea NA Positive Displacement Pumps Market Revenue (Million) Forecast, by Application 2019 & 2032
- Table 116: South Korea NA Positive Displacement Pumps Market Volume (K Unit) Forecast, by Application 2019 & 2032
- Table 117: ASEAN NA Positive Displacement Pumps Market Revenue (Million) Forecast, by Application 2019 & 2032
- Table 118: ASEAN NA Positive Displacement Pumps Market Volume (K Unit) Forecast, by Application 2019 & 2032
- Table 119: Oceania NA Positive Displacement Pumps Market Revenue (Million) Forecast, by Application 2019 & 2032
- Table 120: Oceania NA Positive Displacement Pumps Market Volume (K Unit) Forecast, by Application 2019 & 2032
- Table 121: Rest of Asia Pacific NA Positive Displacement Pumps Market Revenue (Million) Forecast, by Application 2019 & 2032
- Table 122: Rest of Asia Pacific NA Positive Displacement Pumps Market Volume (K Unit) Forecast, by Application 2019 & 2032
Frequently Asked Questions
1. What is the projected Compound Annual Growth Rate (CAGR) of the NA Positive Displacement Pumps Market?
The projected CAGR is approximately 4.33%.
2. Which companies are prominent players in the NA Positive Displacement Pumps Market?
Key companies in the market include Ampco Pumps Company Inc, Flowserve Corporation, Xylem Inc, Springer Pumps LLC, Centec LLC, Titan Manufacturing Inc, ITT Inc, SPX Flow Inc, Liquidyne Process Technologies Inc, Dickow Pump Co, Pentair PLC.
3. What are the main segments of the NA Positive Displacement Pumps Market?
The market segments include Type of Positive Displacement Pump, End-user Industries.
4. Can you provide details about the market size?
The market size is estimated to be USD XX Million as of 2022.
5. What are some drivers contributing to market growth?
Increasing Popularity of MEMS Technology; Increasing demand of water treatment facilities in the region.
6. What are the notable trends driving market growth?
Food & Beverage Segment is Expected to Witness Significant Growth.
7. Are there any restraints impacting market growth?
; Lack of Standard Protocols for the Development of Power Modules; Slow Adoption of New Technologies Derailing Innovation.
8. Can you provide examples of recent developments in the market?
April 2022 - Vogelsang announced its new virtual showroom that offers a comprehensive view of shredding and positive displacement pumping solutions for wastewater collection and treatment. From a 360-degree perspective, visitors experience pumping, shredding, and disintegration technologies for use in sewers and sewage treatment plants.
9. What pricing options are available for accessing the report?
Pricing options include single-user, multi-user, and enterprise licenses priced at USD 4750, USD 4950, and USD 6800 respectively.
10. Is the market size provided in terms of value or volume?
The market size is provided in terms of value, measured in Million and volume, measured in K Unit.
11. Are there any specific market keywords associated with the report?
Yes, the market keyword associated with the report is "NA Positive Displacement Pumps Market," which aids in identifying and referencing the specific market segment covered.
12. How do I determine which pricing option suits my needs best?
The pricing options vary based on user requirements and access needs. Individual users may opt for single-user licenses, while businesses requiring broader access may choose multi-user or enterprise licenses for cost-effective access to the report.
13. Are there any additional resources or data provided in the NA Positive Displacement Pumps Market report?
While the report offers comprehensive insights, it's advisable to review the specific contents or supplementary materials provided to ascertain if additional resources or data are available.
14. How can I stay updated on further developments or reports in the NA Positive Displacement Pumps Market?
To stay informed about further developments, trends, and reports in the NA Positive Displacement Pumps Market, consider subscribing to industry newsletters, following relevant companies and organizations, or regularly checking reputable industry news sources and publications.
Methodology
Step 1 - Identification of Relevant Samples Size from Population Database


Step 2 - Approaches for Defining Global Market Size (Value, Volume* & Price*)

Note*: In applicable scenarios
Step 3 - Data Sources
Primary Research
- Web Analytics
- Survey Reports
- Research Institute
- Latest Research Reports
- Opinion Leaders
Secondary Research
- Annual Reports
- White Paper
- Latest Press Release
- Industry Association
- Paid Database
- Investor Presentations

Step 4 - Data Triangulation
Involves using different sources of information in order to increase the validity of a study
These sources are likely to be stakeholders in a program - participants, other researchers, program staff, other community members, and so on.
Then we put all data in single framework & apply various statistical tools to find out the dynamic on the market.
During the analysis stage, feedback from the stakeholder groups would be compared to determine areas of agreement as well as areas of divergence
