

Key Insights
The global cell-based immunotherapies market is projected for significant expansion, estimated to reach $6.56 billion by 2025, with a Compound Annual Growth Rate (CAGR) of 13.9%. This growth is driven by advancements in cancer treatment, a deeper understanding of the immune system, and the increasing prevalence of B-cell malignancies and other challenging cancers. The demand for personalized medicine approaches and the success of therapies like Autologous Cellular Immunotherapy, CAR T-Cell Therapy, and Dendritic Cell-based Vaccine Therapy are key growth catalysts. Substantial R&D investments from leading pharmaceutical and biotechnology firms are fostering innovation. The forecast period (2025-2033) indicates sustained high growth, highlighting the transformative impact of cell-based immunotherapies in oncology.
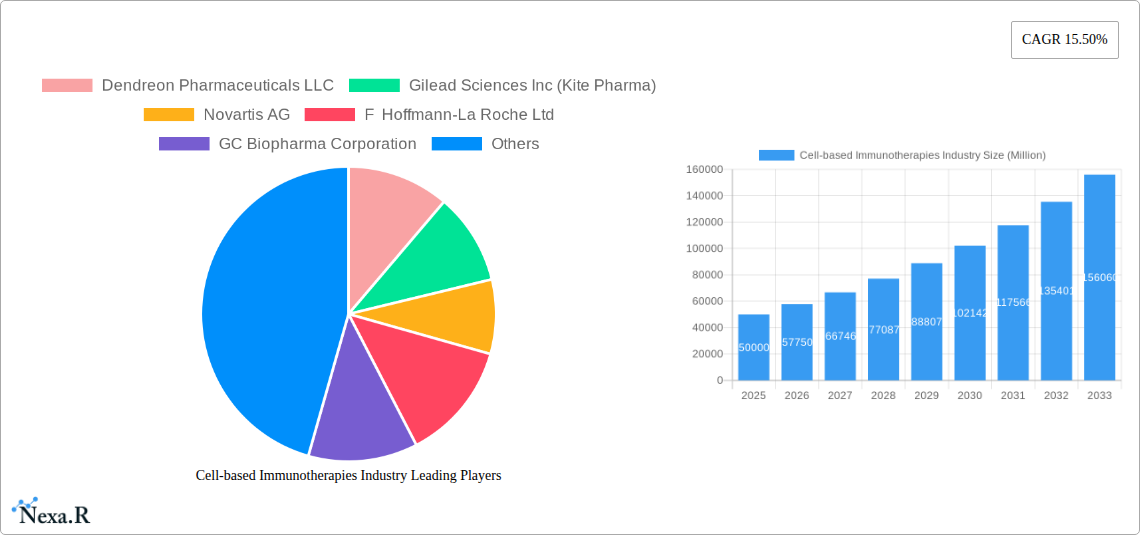
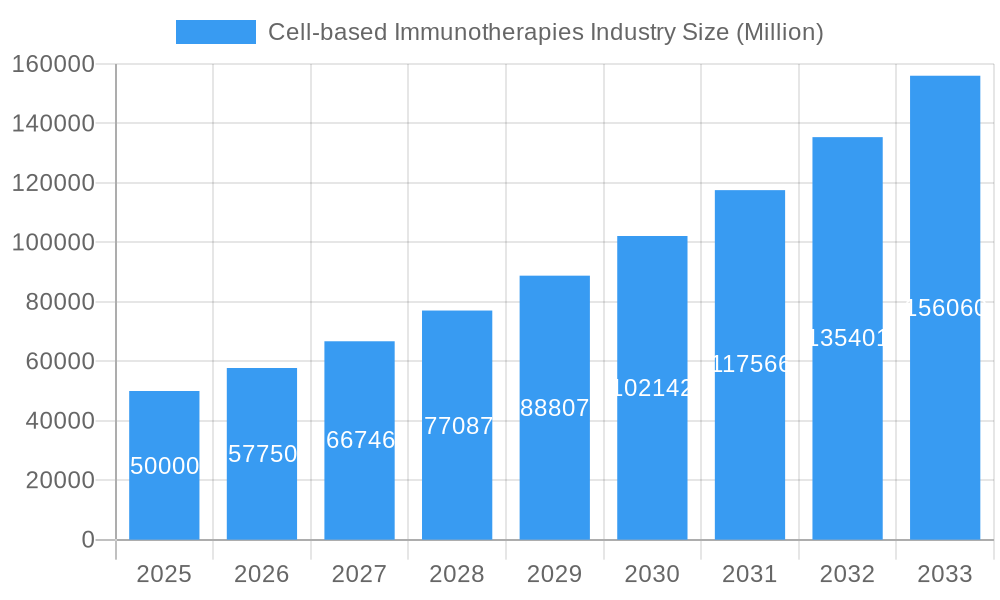
Cell-based Immunotherapies Industry Market Size (In Billion)
Key market trends include the refinement of CAR T-cell technology for broader cancer applications, including solid tumors, and the development of allogeneic cell therapies to address manufacturing complexities and accessibility. Geographic expansion in Asia Pacific, North America, and Europe will further contribute to market growth. While challenges such as high manufacturing costs, complex regulatory pathways, and potential side effects exist, ongoing technological innovations and stakeholder collaborations are expected to mitigate these issues, improving patient access to these life-saving treatments. The analysis covers the period from 2019 to 2033, with a base year of 2025.
Cell-based Immunotherapies Industry Company Market Share
Cell-based Immunotherapies Market Report: Precision Oncology, CAR T-Cell Therapies & Future Growth (2019-2033)
This comprehensive Cell-based Immunotherapies Market Report delivers an in-depth analysis of the dynamic landscape of advanced cancer treatments, with a specific focus on Chimeric Antigen Receptor (CAR) T-Cell Therapy, Autologous Cellular Immunotherapy, and Dendritic Cell-based Vaccine Therapy. Spanning the historical period of 2019–2024 and projecting growth through 2033, with a detailed base and estimated year of 2025, this report offers critical insights for stakeholders in cancer immunotherapy, precision medicine, and oncology drug development. We delve into parent and child market segments, providing a granular view of market evolution, technological innovations, and key player strategies within the burgeoning biotechnology and pharmaceutical sectors.
Cell-based Immunotherapies Industry Market Dynamics & Structure
The cell-based immunotherapies market is characterized by rapid technological advancements and increasing regulatory scrutiny, driving significant innovation and investment. Market concentration is influenced by the high R&D costs and complex manufacturing processes associated with these advanced therapies. Key drivers of technological innovation include breakthroughs in genetic engineering, cellular biology, and bioinformatics, enabling the development of more targeted and effective treatments. The regulatory frameworks, while stringent, are evolving to accommodate novel cell-based therapies, albeit with lengthy approval pathways. Competitive product substitutes are emerging, particularly in the form of bispecific antibodies and small molecule inhibitors, posing a challenge to market dominance. End-user demographics are primarily focused on patients with refractory or relapsed cancers, with a growing emphasis on personalized treatment approaches. Mergers and acquisitions (M&A) are a significant trend, as larger pharmaceutical companies seek to acquire innovative cell therapy platforms and expand their oncology portfolios.
- Market Concentration: Moderate to high, with key innovators holding substantial intellectual property.
- Technological Innovation Drivers: Gene editing (e.g., CRISPR), next-generation sequencing, AI-driven drug discovery.
- Regulatory Frameworks: Evolving FDA and EMA guidelines for advanced therapy medicinal products (ATMPs).
- Competitive Product Substitutes: Bispecific antibodies, antibody-drug conjugates (ADCs), traditional chemotherapy.
- End-User Demographics: Patients with hematological malignancies and solid tumors, particularly those who have exhausted standard treatment options.
- M&A Trends: Strategic acquisitions of early-stage biotech firms with promising cell therapy pipelines.
Cell-based Immunotherapies Industry Growth Trends & Insights
The cell-based immunotherapies industry is poised for substantial growth, driven by increasing cancer incidence globally and the demonstrated efficacy of these advanced treatments. Market size is projected to expand significantly as adoption rates rise, fueled by expanded clinical indications and improved manufacturing scalability. Technological disruptions, including advancements in CAR T-cell engineering for solid tumors and the development of "off-the-shelf" allogeneic therapies, are set to redefine treatment paradigms. Consumer behavior is shifting towards seeking more personalized and less toxic treatment options, making cell-based immunotherapies increasingly attractive. The market penetration of these therapies, while currently concentrated in specific hematological cancers, is expected to broaden considerably as clinical trial data matures for a wider array of indications, including Prostate Cancer, Renal Cell Carcinoma, and Liver Cancer. The estimated market size in 2025 is projected to be approximately $18,500 Million units, with a projected Compound Annual Growth Rate (CAGR) of around 15% from 2025 to 2033, reaching an estimated $55,000 Million units by the end of the forecast period. This growth will be underpinned by ongoing research and development efforts, strategic partnerships, and increasing healthcare infrastructure investments worldwide. The evolving landscape of biologics manufacturing and biopharmaceutical innovation will continue to play a crucial role in driving these positive trends.
Dominant Regions, Countries, or Segments in Cell-based Immunotherapies Industry
The Chimeric Antigen Receptor (CAR) T-Cell Therapy segment, particularly for B-cell Malignancies, is currently the most dominant force within the cell-based immunotherapies industry. This dominance is primarily attributed to the groundbreaking success and FDA approvals of CAR T-cell therapies for certain lymphomas and leukemias. North America, led by the United States, represents the leading region, driven by robust healthcare infrastructure, significant R&D investment, favorable regulatory pathways for innovation, and a high prevalence of target cancers. The strong presence of major pharmaceutical and biotechnology companies, including those focused on oncology treatments and immunological therapies, further solidifies its leadership.
- Dominant Segment: Chimeric Antigen Receptor (CAR) T-Cell Therapy for B-cell Malignancies. This segment has seen accelerated uptake due to proven clinical outcomes and ongoing label expansions.
- Leading Region: North America (primarily the United States).
- Key Drivers:
- Economic Policies: Favorable reimbursement policies and significant government funding for cancer research.
- Infrastructure: Advanced cancer treatment centers and specialized manufacturing facilities for cell therapies.
- Regulatory Landscape: Expedited review pathways for breakthrough therapies.
- Clinical Trial Activity: High volume of ongoing clinical trials evaluating novel CAR T-cell therapies and indications.
- Market Share: North America currently accounts for approximately 65% of the global cell-based immunotherapies market share.
- Key Drivers:
- Emerging Potentials in Other Segments:
- Autologous Cellular Immunotherapy: Expanding applications beyond CAR T-cells, showing promise in other immune-based treatments.
- Dendritic Cell-based Vaccine Therapy: Increasing focus on therapeutic cancer vaccines for solid tumors, with ongoing clinical development for Prostate Cancer and Renal Cell Carcinoma.
- Other Primary Indications: Growing research into applications for pancreatic cancer, glioblastoma, and infectious diseases, indicating a broad future market potential.
Cell-based Immunotherapies Industry Product Landscape
The product landscape of cell-based immunotherapies is characterized by highly personalized and technologically advanced treatments. Leading products include CAR T-cell therapies engineered to target specific cancer cell surface antigens, offering a potent immune response against refractory or relapsed leukemias and lymphomas. Innovations are focused on enhancing persistence, reducing toxicity, and improving efficacy against a broader spectrum of hematological and increasingly, solid tumors. The unique selling proposition lies in harnessing the patient's own immune system, reprogrammed to identify and destroy cancer cells. Technological advancements are centered on next-generation CAR designs, armored CARs, and combination therapies to overcome tumor microenvironment challenges. The performance metrics are evaluated based on objective response rates (ORR), duration of response (DoR), and overall survival (OS), with significant improvements demonstrated in previously untreatable patient populations.
Key Drivers, Barriers & Challenges in Cell-based Immunotherapies Industry
Key Drivers:
- Technological Advancements: Breakthroughs in genetic engineering, cell manipulation, and manufacturing technologies are enabling more effective and personalized therapies. The development of CAR T-cell therapy for B-cell Malignancies is a prime example.
- Increasing Cancer Incidence: The rising global burden of cancer, particularly hematological malignancies and certain solid tumors, creates a growing demand for novel treatment modalities.
- Favorable Reimbursement Policies: Growing recognition of the therapeutic value and improved patient outcomes is leading to better reimbursement coverage for these complex treatments.
- Growing R&D Investment: Significant investment from pharmaceutical companies, venture capitalists, and government bodies is fueling innovation and pipeline expansion.
Barriers & Challenges:
- High Manufacturing Costs & Complexity: The intricate and personalized nature of cell therapies results in extremely high production costs, impacting affordability and accessibility. Estimated cost per patient for CAR T-cell therapy can range from $300,000 to $500,000 units.
- Manufacturing Scalability: Scaling up production to meet growing demand while maintaining quality and safety remains a significant hurdle.
- Regulatory Hurdles: Navigating complex and evolving regulatory pathways for these novel therapies can be time-consuming and resource-intensive.
- Supply Chain Logistics: Maintaining the viability and integrity of patient-derived cells throughout the manufacturing and administration process presents significant logistical challenges.
- Toxicity and Side Effects: Managing potential adverse events such as cytokine release syndrome (CRS) and neurotoxicity requires specialized expertise and monitoring.
Emerging Opportunities in Cell-based Immunotherapies Industry
Emerging opportunities in the cell-based immunotherapies industry are vast, particularly in expanding the application of CAR T-cell therapies to solid tumors, which currently represent a significant unmet medical need. The development of allogeneic ("off-the-shelf") cell therapies, as exemplified by efforts like Allogene Therapeutics' CAR T Together initiative, offers a scalable and potentially more accessible alternative to autologous treatments. There is also substantial potential in exploring novel cell types beyond T-cells, such as NK cells and macrophages, for therapeutic purposes. Furthermore, advancements in manufacturing technologies, including decentralized manufacturing and automated platforms, promise to reduce costs and improve turnaround times, thereby increasing accessibility. Untapped markets in developing economies with growing healthcare expenditures also present considerable growth avenues.
Growth Accelerators in the Cell-based Immunotherapies Industry Industry
Growth in the cell-based immunotherapies industry is being significantly accelerated by a confluence of factors. Technological breakthroughs in gene editing and delivery systems are enabling the creation of more potent and safer cellular therapies, particularly for challenging indications like Prostate Cancer and Liver Cancer. Strategic partnerships between academic institutions, biotech startups, and large pharmaceutical companies are crucial for translating scientific discoveries into viable clinical treatments. These collaborations facilitate knowledge sharing, expedite clinical development, and ensure robust manufacturing capabilities. Market expansion strategies, including the pursuit of new indications and geographical reach, are also key growth catalysts. The increasing understanding of the tumor microenvironment and immune evasion mechanisms is paving the way for combination therapies that enhance the efficacy of existing cell-based treatments.
Key Players Shaping the Cell-based Immunotherapies Industry Market
- Dendreon Pharmaceuticals LLC
- Gilead Sciences Inc (Kite Pharma)
- Novartis AG
- F Hoffmann-La Roche Ltd
- GC Biopharma Corporation
- GlaxoSmithKline plc
- Celyad
- Bristol-Myers Squibb Company
- JW CreaGene Co Ltd
- Johnson and Johnson (Janssen Global Services LLC)
- Pfizer Inc
Notable Milestones in Cell-based Immunotherapies Industry Sector
- October 2022: Allogene Therapeutics, Inc. launched CAR T Together, an initiative focused on developing and promoting scalable, 'off-the-shelf' (allogeneic) CAR T products for broader cancer patient access.
- April 2022: Gilead Company's Yescarta received FDA approval as the first CAR T-cell therapy for the initial treatment of relapsed or refractory large B-cell lymphoma (LBCL), marking a significant advancement in first-line therapy.
In-Depth Cell-based Immunotherapies Industry Market Outlook
The future outlook for the cell-based immunotherapies industry is exceptionally promising, driven by continuous innovation and expanding therapeutic applications. Growth accelerators include the ongoing development of CAR T-cell therapies for Renal Cell Carcinoma and other solid tumors, alongside the anticipated maturation of allogeneic cell therapy platforms, which will dramatically improve accessibility and reduce costs. Strategic partnerships and a proactive approach to navigating evolving regulatory landscapes will be critical for success. The increasing prevalence of cancer globally, coupled with a greater demand for personalized and effective treatments, ensures a robust market for these advanced therapies. The estimated market value is expected to see substantial growth, reaching over $55,000 Million units by 2033, underscoring the transformative impact of cell-based immunotherapies on cancer care.
Cell-based Immunotherapies Industry Segmentation
-
1. Therapy
- 1.1. Autologous Cellular Immunotherapy
- 1.2. Chimeric Antigen Receptor (CAR) T-Cell Therapy
- 1.3. Dendritic Cell-based Vaccine Therapy
-
2. Primary Indication
- 2.1. B-cell Malignancies
- 2.2. Prostate Cancer
- 2.3. Renal Cell Carcinoma
- 2.4. Liver Cancer
- 2.5. Other Primary Indications
Cell-based Immunotherapies Industry Segmentation By Geography
-
1. North America
- 1.1. United States
- 1.2. Canada
- 1.3. Mexico
-
2. Europe
- 2.1. Germany
- 2.2. United Kingdom
- 2.3. France
- 2.4. Italy
- 2.5. Spain
- 2.6. Rest of Europe
-
3. Asia Pacific
- 3.1. China
- 3.2. Japan
- 3.3. India
- 3.4. Australia
- 3.5. South Korea
- 3.6. Rest of Asia Pacific
-
4. Middle East and Africa
- 4.1. GCC
- 4.2. South Africa
- 4.3. Rest of Middle East and Africa
-
5. South America
- 5.1. Brazil
- 5.2. Argentina
- 5.3. Rest of South America
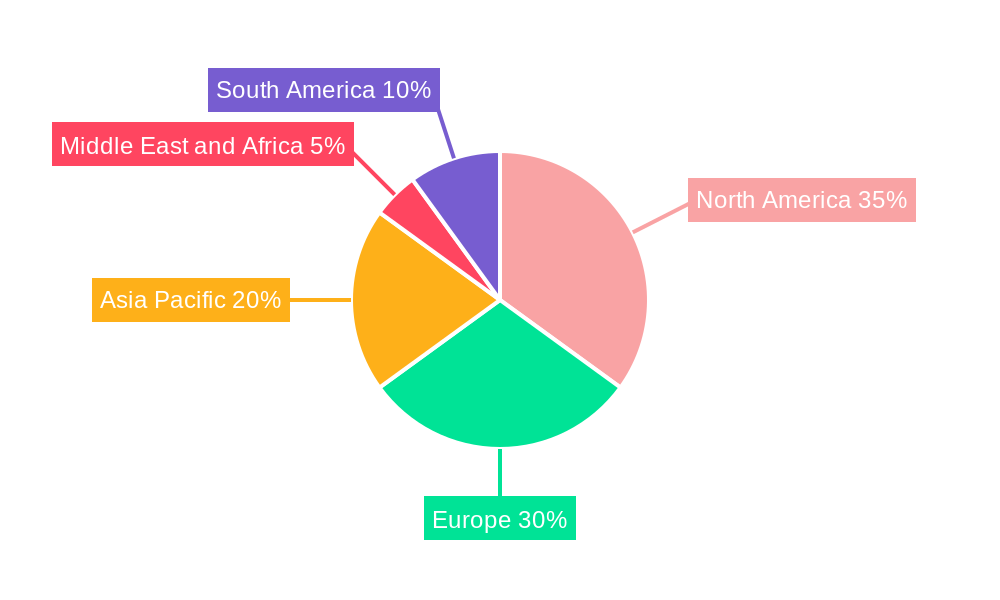
Cell-based Immunotherapies Industry Regional Market Share
Geographic Coverage of Cell-based Immunotherapies Industry
Cell-based Immunotherapies Industry REPORT HIGHLIGHTS
| Aspects | Details |
|---|---|
| Study Period | 2020-2034 |
| Base Year | 2025 |
| Estimated Year | 2026 |
| Forecast Period | 2026-2034 |
| Historical Period | 2020-2025 |
| Growth Rate | CAGR of 13.9% from 2020-2034 |
| Segmentation |
|
Table of Contents
- 1. Introduction
- 1.1. Research Scope
- 1.2. Market Segmentation
- 1.3. Research Objective
- 1.4. Definitions and Assumptions
- 2. Executive Summary
- 2.1. Market Snapshot
- 3. Market Dynamics
- 3.1. Market Drivers
- 3.2. Market Restrains
- 3.3. Market Trends
- 3.4. Market Opportunities
- 4. Market Factor Analysis
- 4.1. Porters Five Forces
- 4.1.1. Bargaining Power of Suppliers
- 4.1.2. Bargaining Power of Buyers
- 4.1.3. Threat of New Entrants
- 4.1.4. Threat of Substitutes
- 4.1.5. Competitive Rivalry
- 4.2. PESTEL analysis
- 4.3. BCG Analysis
- 4.3.1. Stars (High Growth, High Market Share)
- 4.3.2. Cash Cows (Low Growth, High Market Share)
- 4.3.3. Question Mark (High Growth, Low Market Share)
- 4.3.4. Dogs (Low Growth, Low Market Share)
- 4.4. Ansoff Matrix Analysis
- 4.5. Supply Chain Analysis
- 4.6. Regulatory Landscape
- 4.7. Current Market Potential and Opportunity Assessment (TAM–SAM–SOM Framework)
- 4.8. NRP Analyst Note
- 4.1. Porters Five Forces
- 5. Market Analysis, Insights and Forecast 2021-2033
- 5.1. Market Analysis, Insights and Forecast - by Therapy
- 5.1.1. Autologous Cellular Immunotherapy
- 5.1.2. Chimeric Antigen Receptor (CAR) T-Cell Therapy
- 5.1.3. Dendritic Cell-based Vaccine Therapy
- 5.2. Market Analysis, Insights and Forecast - by Primary Indication
- 5.2.1. B-cell Malignancies
- 5.2.2. Prostate Cancer
- 5.2.3. Renal Cell Carcinoma
- 5.2.4. Liver Cancer
- 5.2.5. Other Primary Indications
- 5.3. Market Analysis, Insights and Forecast - by Region
- 5.3.1. North America
- 5.3.2. Europe
- 5.3.3. Asia Pacific
- 5.3.4. Middle East and Africa
- 5.3.5. South America
- 5.1. Market Analysis, Insights and Forecast - by Therapy
- 6. Global Cell-based Immunotherapies Industry Analysis, Insights and Forecast, 2021-2033
- 6.1. Market Analysis, Insights and Forecast - by Therapy
- 6.1.1. Autologous Cellular Immunotherapy
- 6.1.2. Chimeric Antigen Receptor (CAR) T-Cell Therapy
- 6.1.3. Dendritic Cell-based Vaccine Therapy
- 6.2. Market Analysis, Insights and Forecast - by Primary Indication
- 6.2.1. B-cell Malignancies
- 6.2.2. Prostate Cancer
- 6.2.3. Renal Cell Carcinoma
- 6.2.4. Liver Cancer
- 6.2.5. Other Primary Indications
- 6.1. Market Analysis, Insights and Forecast - by Therapy
- 7. North America Cell-based Immunotherapies Industry Analysis, Insights and Forecast, 2020-2032
- 7.1. Market Analysis, Insights and Forecast - by Therapy
- 7.1.1. Autologous Cellular Immunotherapy
- 7.1.2. Chimeric Antigen Receptor (CAR) T-Cell Therapy
- 7.1.3. Dendritic Cell-based Vaccine Therapy
- 7.2. Market Analysis, Insights and Forecast - by Primary Indication
- 7.2.1. B-cell Malignancies
- 7.2.2. Prostate Cancer
- 7.2.3. Renal Cell Carcinoma
- 7.2.4. Liver Cancer
- 7.2.5. Other Primary Indications
- 7.1. Market Analysis, Insights and Forecast - by Therapy
- 8. Europe Cell-based Immunotherapies Industry Analysis, Insights and Forecast, 2020-2032
- 8.1. Market Analysis, Insights and Forecast - by Therapy
- 8.1.1. Autologous Cellular Immunotherapy
- 8.1.2. Chimeric Antigen Receptor (CAR) T-Cell Therapy
- 8.1.3. Dendritic Cell-based Vaccine Therapy
- 8.2. Market Analysis, Insights and Forecast - by Primary Indication
- 8.2.1. B-cell Malignancies
- 8.2.2. Prostate Cancer
- 8.2.3. Renal Cell Carcinoma
- 8.2.4. Liver Cancer
- 8.2.5. Other Primary Indications
- 8.1. Market Analysis, Insights and Forecast - by Therapy
- 9. Asia Pacific Cell-based Immunotherapies Industry Analysis, Insights and Forecast, 2020-2032
- 9.1. Market Analysis, Insights and Forecast - by Therapy
- 9.1.1. Autologous Cellular Immunotherapy
- 9.1.2. Chimeric Antigen Receptor (CAR) T-Cell Therapy
- 9.1.3. Dendritic Cell-based Vaccine Therapy
- 9.2. Market Analysis, Insights and Forecast - by Primary Indication
- 9.2.1. B-cell Malignancies
- 9.2.2. Prostate Cancer
- 9.2.3. Renal Cell Carcinoma
- 9.2.4. Liver Cancer
- 9.2.5. Other Primary Indications
- 9.1. Market Analysis, Insights and Forecast - by Therapy
- 10. Middle East and Africa Cell-based Immunotherapies Industry Analysis, Insights and Forecast, 2020-2032
- 10.1. Market Analysis, Insights and Forecast - by Therapy
- 10.1.1. Autologous Cellular Immunotherapy
- 10.1.2. Chimeric Antigen Receptor (CAR) T-Cell Therapy
- 10.1.3. Dendritic Cell-based Vaccine Therapy
- 10.2. Market Analysis, Insights and Forecast - by Primary Indication
- 10.2.1. B-cell Malignancies
- 10.2.2. Prostate Cancer
- 10.2.3. Renal Cell Carcinoma
- 10.2.4. Liver Cancer
- 10.2.5. Other Primary Indications
- 10.1. Market Analysis, Insights and Forecast - by Therapy
- 11. South America Cell-based Immunotherapies Industry Analysis, Insights and Forecast, 2020-2032
- 11.1. Market Analysis, Insights and Forecast - by Therapy
- 11.1.1. Autologous Cellular Immunotherapy
- 11.1.2. Chimeric Antigen Receptor (CAR) T-Cell Therapy
- 11.1.3. Dendritic Cell-based Vaccine Therapy
- 11.2. Market Analysis, Insights and Forecast - by Primary Indication
- 11.2.1. B-cell Malignancies
- 11.2.2. Prostate Cancer
- 11.2.3. Renal Cell Carcinoma
- 11.2.4. Liver Cancer
- 11.2.5. Other Primary Indications
- 11.1. Market Analysis, Insights and Forecast - by Therapy
- 12. Competitive Analysis
- 12.1. Company Profiles
- 12.1.1 Dendreon Pharmaceuticals LLC
- 12.1.1.1. Company Overview
- 12.1.1.2. Products
- 12.1.1.3. Company Financials
- 12.1.1.4. SWOT Analysis
- 12.1.2 Gilead Sciences Inc (Kite Pharma)
- 12.1.2.1. Company Overview
- 12.1.2.2. Products
- 12.1.2.3. Company Financials
- 12.1.2.4. SWOT Analysis
- 12.1.3 Novartis AG
- 12.1.3.1. Company Overview
- 12.1.3.2. Products
- 12.1.3.3. Company Financials
- 12.1.3.4. SWOT Analysis
- 12.1.4 F Hoffmann-La Roche Ltd
- 12.1.4.1. Company Overview
- 12.1.4.2. Products
- 12.1.4.3. Company Financials
- 12.1.4.4. SWOT Analysis
- 12.1.5 GC Biopharma Corporation
- 12.1.5.1. Company Overview
- 12.1.5.2. Products
- 12.1.5.3. Company Financials
- 12.1.5.4. SWOT Analysis
- 12.1.6 GlaxoSmithKline plc
- 12.1.6.1. Company Overview
- 12.1.6.2. Products
- 12.1.6.3. Company Financials
- 12.1.6.4. SWOT Analysis
- 12.1.7 Celyad
- 12.1.7.1. Company Overview
- 12.1.7.2. Products
- 12.1.7.3. Company Financials
- 12.1.7.4. SWOT Analysis
- 12.1.8 Bristol-Myers Squibb Company
- 12.1.8.1. Company Overview
- 12.1.8.2. Products
- 12.1.8.3. Company Financials
- 12.1.8.4. SWOT Analysis
- 12.1.9 JW CreaGene Co Ltd
- 12.1.9.1. Company Overview
- 12.1.9.2. Products
- 12.1.9.3. Company Financials
- 12.1.9.4. SWOT Analysis
- 12.1.10 Johnson and Johnson (Janssen Global Services LLC)
- 12.1.10.1. Company Overview
- 12.1.10.2. Products
- 12.1.10.3. Company Financials
- 12.1.10.4. SWOT Analysis
- 12.1.11 Pfizer Inc
- 12.1.11.1. Company Overview
- 12.1.11.2. Products
- 12.1.11.3. Company Financials
- 12.1.11.4. SWOT Analysis
- 12.1.1 Dendreon Pharmaceuticals LLC
- 12.2. Market Entropy
- 12.2.1 Company's Key Areas Served
- 12.2.2 Recent Developments
- 12.3. Company Market Share Analysis 2025
- 12.3.1 Top 5 Companies Market Share Analysis
- 12.3.2 Top 3 Companies Market Share Analysis
- 12.4. List of Potential Customers
- 13. Research Methodology
List of Figures
- Figure 1: Global Cell-based Immunotherapies Industry Revenue Breakdown (billion, %) by Region 2025 & 2033
- Figure 2: Global Cell-based Immunotherapies Industry Volume Breakdown (K Unit, %) by Region 2025 & 2033
- Figure 3: North America Cell-based Immunotherapies Industry Revenue (billion), by Therapy 2025 & 2033
- Figure 4: North America Cell-based Immunotherapies Industry Volume (K Unit), by Therapy 2025 & 2033
- Figure 5: North America Cell-based Immunotherapies Industry Revenue Share (%), by Therapy 2025 & 2033
- Figure 6: North America Cell-based Immunotherapies Industry Volume Share (%), by Therapy 2025 & 2033
- Figure 7: North America Cell-based Immunotherapies Industry Revenue (billion), by Primary Indication 2025 & 2033
- Figure 8: North America Cell-based Immunotherapies Industry Volume (K Unit), by Primary Indication 2025 & 2033
- Figure 9: North America Cell-based Immunotherapies Industry Revenue Share (%), by Primary Indication 2025 & 2033
- Figure 10: North America Cell-based Immunotherapies Industry Volume Share (%), by Primary Indication 2025 & 2033
- Figure 11: North America Cell-based Immunotherapies Industry Revenue (billion), by Country 2025 & 2033
- Figure 12: North America Cell-based Immunotherapies Industry Volume (K Unit), by Country 2025 & 2033
- Figure 13: North America Cell-based Immunotherapies Industry Revenue Share (%), by Country 2025 & 2033
- Figure 14: North America Cell-based Immunotherapies Industry Volume Share (%), by Country 2025 & 2033
- Figure 15: Europe Cell-based Immunotherapies Industry Revenue (billion), by Therapy 2025 & 2033
- Figure 16: Europe Cell-based Immunotherapies Industry Volume (K Unit), by Therapy 2025 & 2033
- Figure 17: Europe Cell-based Immunotherapies Industry Revenue Share (%), by Therapy 2025 & 2033
- Figure 18: Europe Cell-based Immunotherapies Industry Volume Share (%), by Therapy 2025 & 2033
- Figure 19: Europe Cell-based Immunotherapies Industry Revenue (billion), by Primary Indication 2025 & 2033
- Figure 20: Europe Cell-based Immunotherapies Industry Volume (K Unit), by Primary Indication 2025 & 2033
- Figure 21: Europe Cell-based Immunotherapies Industry Revenue Share (%), by Primary Indication 2025 & 2033
- Figure 22: Europe Cell-based Immunotherapies Industry Volume Share (%), by Primary Indication 2025 & 2033
- Figure 23: Europe Cell-based Immunotherapies Industry Revenue (billion), by Country 2025 & 2033
- Figure 24: Europe Cell-based Immunotherapies Industry Volume (K Unit), by Country 2025 & 2033
- Figure 25: Europe Cell-based Immunotherapies Industry Revenue Share (%), by Country 2025 & 2033
- Figure 26: Europe Cell-based Immunotherapies Industry Volume Share (%), by Country 2025 & 2033
- Figure 27: Asia Pacific Cell-based Immunotherapies Industry Revenue (billion), by Therapy 2025 & 2033
- Figure 28: Asia Pacific Cell-based Immunotherapies Industry Volume (K Unit), by Therapy 2025 & 2033
- Figure 29: Asia Pacific Cell-based Immunotherapies Industry Revenue Share (%), by Therapy 2025 & 2033
- Figure 30: Asia Pacific Cell-based Immunotherapies Industry Volume Share (%), by Therapy 2025 & 2033
- Figure 31: Asia Pacific Cell-based Immunotherapies Industry Revenue (billion), by Primary Indication 2025 & 2033
- Figure 32: Asia Pacific Cell-based Immunotherapies Industry Volume (K Unit), by Primary Indication 2025 & 2033
- Figure 33: Asia Pacific Cell-based Immunotherapies Industry Revenue Share (%), by Primary Indication 2025 & 2033
- Figure 34: Asia Pacific Cell-based Immunotherapies Industry Volume Share (%), by Primary Indication 2025 & 2033
- Figure 35: Asia Pacific Cell-based Immunotherapies Industry Revenue (billion), by Country 2025 & 2033
- Figure 36: Asia Pacific Cell-based Immunotherapies Industry Volume (K Unit), by Country 2025 & 2033
- Figure 37: Asia Pacific Cell-based Immunotherapies Industry Revenue Share (%), by Country 2025 & 2033
- Figure 38: Asia Pacific Cell-based Immunotherapies Industry Volume Share (%), by Country 2025 & 2033
- Figure 39: Middle East and Africa Cell-based Immunotherapies Industry Revenue (billion), by Therapy 2025 & 2033
- Figure 40: Middle East and Africa Cell-based Immunotherapies Industry Volume (K Unit), by Therapy 2025 & 2033
- Figure 41: Middle East and Africa Cell-based Immunotherapies Industry Revenue Share (%), by Therapy 2025 & 2033
- Figure 42: Middle East and Africa Cell-based Immunotherapies Industry Volume Share (%), by Therapy 2025 & 2033
- Figure 43: Middle East and Africa Cell-based Immunotherapies Industry Revenue (billion), by Primary Indication 2025 & 2033
- Figure 44: Middle East and Africa Cell-based Immunotherapies Industry Volume (K Unit), by Primary Indication 2025 & 2033
- Figure 45: Middle East and Africa Cell-based Immunotherapies Industry Revenue Share (%), by Primary Indication 2025 & 2033
- Figure 46: Middle East and Africa Cell-based Immunotherapies Industry Volume Share (%), by Primary Indication 2025 & 2033
- Figure 47: Middle East and Africa Cell-based Immunotherapies Industry Revenue (billion), by Country 2025 & 2033
- Figure 48: Middle East and Africa Cell-based Immunotherapies Industry Volume (K Unit), by Country 2025 & 2033
- Figure 49: Middle East and Africa Cell-based Immunotherapies Industry Revenue Share (%), by Country 2025 & 2033
- Figure 50: Middle East and Africa Cell-based Immunotherapies Industry Volume Share (%), by Country 2025 & 2033
- Figure 51: South America Cell-based Immunotherapies Industry Revenue (billion), by Therapy 2025 & 2033
- Figure 52: South America Cell-based Immunotherapies Industry Volume (K Unit), by Therapy 2025 & 2033
- Figure 53: South America Cell-based Immunotherapies Industry Revenue Share (%), by Therapy 2025 & 2033
- Figure 54: South America Cell-based Immunotherapies Industry Volume Share (%), by Therapy 2025 & 2033
- Figure 55: South America Cell-based Immunotherapies Industry Revenue (billion), by Primary Indication 2025 & 2033
- Figure 56: South America Cell-based Immunotherapies Industry Volume (K Unit), by Primary Indication 2025 & 2033
- Figure 57: South America Cell-based Immunotherapies Industry Revenue Share (%), by Primary Indication 2025 & 2033
- Figure 58: South America Cell-based Immunotherapies Industry Volume Share (%), by Primary Indication 2025 & 2033
- Figure 59: South America Cell-based Immunotherapies Industry Revenue (billion), by Country 2025 & 2033
- Figure 60: South America Cell-based Immunotherapies Industry Volume (K Unit), by Country 2025 & 2033
- Figure 61: South America Cell-based Immunotherapies Industry Revenue Share (%), by Country 2025 & 2033
- Figure 62: South America Cell-based Immunotherapies Industry Volume Share (%), by Country 2025 & 2033
List of Tables
- Table 1: Global Cell-based Immunotherapies Industry Revenue billion Forecast, by Therapy 2020 & 2033
- Table 2: Global Cell-based Immunotherapies Industry Volume K Unit Forecast, by Therapy 2020 & 2033
- Table 3: Global Cell-based Immunotherapies Industry Revenue billion Forecast, by Primary Indication 2020 & 2033
- Table 4: Global Cell-based Immunotherapies Industry Volume K Unit Forecast, by Primary Indication 2020 & 2033
- Table 5: Global Cell-based Immunotherapies Industry Revenue billion Forecast, by Region 2020 & 2033
- Table 6: Global Cell-based Immunotherapies Industry Volume K Unit Forecast, by Region 2020 & 2033
- Table 7: Global Cell-based Immunotherapies Industry Revenue billion Forecast, by Therapy 2020 & 2033
- Table 8: Global Cell-based Immunotherapies Industry Volume K Unit Forecast, by Therapy 2020 & 2033
- Table 9: Global Cell-based Immunotherapies Industry Revenue billion Forecast, by Primary Indication 2020 & 2033
- Table 10: Global Cell-based Immunotherapies Industry Volume K Unit Forecast, by Primary Indication 2020 & 2033
- Table 11: Global Cell-based Immunotherapies Industry Revenue billion Forecast, by Country 2020 & 2033
- Table 12: Global Cell-based Immunotherapies Industry Volume K Unit Forecast, by Country 2020 & 2033
- Table 13: United States Cell-based Immunotherapies Industry Revenue (billion) Forecast, by Application 2020 & 2033
- Table 14: United States Cell-based Immunotherapies Industry Volume (K Unit) Forecast, by Application 2020 & 2033
- Table 15: Canada Cell-based Immunotherapies Industry Revenue (billion) Forecast, by Application 2020 & 2033
- Table 16: Canada Cell-based Immunotherapies Industry Volume (K Unit) Forecast, by Application 2020 & 2033
- Table 17: Mexico Cell-based Immunotherapies Industry Revenue (billion) Forecast, by Application 2020 & 2033
- Table 18: Mexico Cell-based Immunotherapies Industry Volume (K Unit) Forecast, by Application 2020 & 2033
- Table 19: Global Cell-based Immunotherapies Industry Revenue billion Forecast, by Therapy 2020 & 2033
- Table 20: Global Cell-based Immunotherapies Industry Volume K Unit Forecast, by Therapy 2020 & 2033
- Table 21: Global Cell-based Immunotherapies Industry Revenue billion Forecast, by Primary Indication 2020 & 2033
- Table 22: Global Cell-based Immunotherapies Industry Volume K Unit Forecast, by Primary Indication 2020 & 2033
- Table 23: Global Cell-based Immunotherapies Industry Revenue billion Forecast, by Country 2020 & 2033
- Table 24: Global Cell-based Immunotherapies Industry Volume K Unit Forecast, by Country 2020 & 2033
- Table 25: Germany Cell-based Immunotherapies Industry Revenue (billion) Forecast, by Application 2020 & 2033
- Table 26: Germany Cell-based Immunotherapies Industry Volume (K Unit) Forecast, by Application 2020 & 2033
- Table 27: United Kingdom Cell-based Immunotherapies Industry Revenue (billion) Forecast, by Application 2020 & 2033
- Table 28: United Kingdom Cell-based Immunotherapies Industry Volume (K Unit) Forecast, by Application 2020 & 2033
- Table 29: France Cell-based Immunotherapies Industry Revenue (billion) Forecast, by Application 2020 & 2033
- Table 30: France Cell-based Immunotherapies Industry Volume (K Unit) Forecast, by Application 2020 & 2033
- Table 31: Italy Cell-based Immunotherapies Industry Revenue (billion) Forecast, by Application 2020 & 2033
- Table 32: Italy Cell-based Immunotherapies Industry Volume (K Unit) Forecast, by Application 2020 & 2033
- Table 33: Spain Cell-based Immunotherapies Industry Revenue (billion) Forecast, by Application 2020 & 2033
- Table 34: Spain Cell-based Immunotherapies Industry Volume (K Unit) Forecast, by Application 2020 & 2033
- Table 35: Rest of Europe Cell-based Immunotherapies Industry Revenue (billion) Forecast, by Application 2020 & 2033
- Table 36: Rest of Europe Cell-based Immunotherapies Industry Volume (K Unit) Forecast, by Application 2020 & 2033
- Table 37: Global Cell-based Immunotherapies Industry Revenue billion Forecast, by Therapy 2020 & 2033
- Table 38: Global Cell-based Immunotherapies Industry Volume K Unit Forecast, by Therapy 2020 & 2033
- Table 39: Global Cell-based Immunotherapies Industry Revenue billion Forecast, by Primary Indication 2020 & 2033
- Table 40: Global Cell-based Immunotherapies Industry Volume K Unit Forecast, by Primary Indication 2020 & 2033
- Table 41: Global Cell-based Immunotherapies Industry Revenue billion Forecast, by Country 2020 & 2033
- Table 42: Global Cell-based Immunotherapies Industry Volume K Unit Forecast, by Country 2020 & 2033
- Table 43: China Cell-based Immunotherapies Industry Revenue (billion) Forecast, by Application 2020 & 2033
- Table 44: China Cell-based Immunotherapies Industry Volume (K Unit) Forecast, by Application 2020 & 2033
- Table 45: Japan Cell-based Immunotherapies Industry Revenue (billion) Forecast, by Application 2020 & 2033
- Table 46: Japan Cell-based Immunotherapies Industry Volume (K Unit) Forecast, by Application 2020 & 2033
- Table 47: India Cell-based Immunotherapies Industry Revenue (billion) Forecast, by Application 2020 & 2033
- Table 48: India Cell-based Immunotherapies Industry Volume (K Unit) Forecast, by Application 2020 & 2033
- Table 49: Australia Cell-based Immunotherapies Industry Revenue (billion) Forecast, by Application 2020 & 2033
- Table 50: Australia Cell-based Immunotherapies Industry Volume (K Unit) Forecast, by Application 2020 & 2033
- Table 51: South Korea Cell-based Immunotherapies Industry Revenue (billion) Forecast, by Application 2020 & 2033
- Table 52: South Korea Cell-based Immunotherapies Industry Volume (K Unit) Forecast, by Application 2020 & 2033
- Table 53: Rest of Asia Pacific Cell-based Immunotherapies Industry Revenue (billion) Forecast, by Application 2020 & 2033
- Table 54: Rest of Asia Pacific Cell-based Immunotherapies Industry Volume (K Unit) Forecast, by Application 2020 & 2033
- Table 55: Global Cell-based Immunotherapies Industry Revenue billion Forecast, by Therapy 2020 & 2033
- Table 56: Global Cell-based Immunotherapies Industry Volume K Unit Forecast, by Therapy 2020 & 2033
- Table 57: Global Cell-based Immunotherapies Industry Revenue billion Forecast, by Primary Indication 2020 & 2033
- Table 58: Global Cell-based Immunotherapies Industry Volume K Unit Forecast, by Primary Indication 2020 & 2033
- Table 59: Global Cell-based Immunotherapies Industry Revenue billion Forecast, by Country 2020 & 2033
- Table 60: Global Cell-based Immunotherapies Industry Volume K Unit Forecast, by Country 2020 & 2033
- Table 61: GCC Cell-based Immunotherapies Industry Revenue (billion) Forecast, by Application 2020 & 2033
- Table 62: GCC Cell-based Immunotherapies Industry Volume (K Unit) Forecast, by Application 2020 & 2033
- Table 63: South Africa Cell-based Immunotherapies Industry Revenue (billion) Forecast, by Application 2020 & 2033
- Table 64: South Africa Cell-based Immunotherapies Industry Volume (K Unit) Forecast, by Application 2020 & 2033
- Table 65: Rest of Middle East and Africa Cell-based Immunotherapies Industry Revenue (billion) Forecast, by Application 2020 & 2033
- Table 66: Rest of Middle East and Africa Cell-based Immunotherapies Industry Volume (K Unit) Forecast, by Application 2020 & 2033
- Table 67: Global Cell-based Immunotherapies Industry Revenue billion Forecast, by Therapy 2020 & 2033
- Table 68: Global Cell-based Immunotherapies Industry Volume K Unit Forecast, by Therapy 2020 & 2033
- Table 69: Global Cell-based Immunotherapies Industry Revenue billion Forecast, by Primary Indication 2020 & 2033
- Table 70: Global Cell-based Immunotherapies Industry Volume K Unit Forecast, by Primary Indication 2020 & 2033
- Table 71: Global Cell-based Immunotherapies Industry Revenue billion Forecast, by Country 2020 & 2033
- Table 72: Global Cell-based Immunotherapies Industry Volume K Unit Forecast, by Country 2020 & 2033
- Table 73: Brazil Cell-based Immunotherapies Industry Revenue (billion) Forecast, by Application 2020 & 2033
- Table 74: Brazil Cell-based Immunotherapies Industry Volume (K Unit) Forecast, by Application 2020 & 2033
- Table 75: Argentina Cell-based Immunotherapies Industry Revenue (billion) Forecast, by Application 2020 & 2033
- Table 76: Argentina Cell-based Immunotherapies Industry Volume (K Unit) Forecast, by Application 2020 & 2033
- Table 77: Rest of South America Cell-based Immunotherapies Industry Revenue (billion) Forecast, by Application 2020 & 2033
- Table 78: Rest of South America Cell-based Immunotherapies Industry Volume (K Unit) Forecast, by Application 2020 & 2033
Frequently Asked Questions
1. What is the projected Compound Annual Growth Rate (CAGR) of the Cell-based Immunotherapies Industry?
The projected CAGR is approximately 13.9%.
2. Which companies are prominent players in the Cell-based Immunotherapies Industry?
Key companies in the market include Dendreon Pharmaceuticals LLC, Gilead Sciences Inc (Kite Pharma), Novartis AG, F Hoffmann-La Roche Ltd, GC Biopharma Corporation, GlaxoSmithKline plc, Celyad, Bristol-Myers Squibb Company, JW CreaGene Co Ltd, Johnson and Johnson (Janssen Global Services LLC), Pfizer Inc.
3. What are the main segments of the Cell-based Immunotherapies Industry?
The market segments include Therapy, Primary Indication.
4. Can you provide details about the market size?
The market size is estimated to be USD 6.56 billion as of 2022.
5. What are some drivers contributing to market growth?
Rising Prevalence of Cancer; Technological Advancement in Developing Target Based Anti-Cancer Therapies; Launches and Approval of Different Cell-based Immunotherapy Drugs.
6. What are the notable trends driving market growth?
Chimeric Antigen Receptor (CAR) T-Cell Therapy Is Expected To Witness Significant Growth Over The Forecast Period.
7. Are there any restraints impacting market growth?
High Cost of Technology; Lack of Awareness in the Developing Markets.
8. Can you provide examples of recent developments in the market?
In October 2022, Allogene Therapeutics, Inc., a clinical-stage biotechnology company pioneering the development of allogeneic CAR T (AlloCAR T) products for cancer, launched CAR T Together, a first-of-its-kind effort comprised of clinical trial investigators who represent the field of clinicians committed to supporting the development of 'off-the-shelf' (allogeneic) chimeric antigen receptor (CAR) T products to make CAR T therapy scalable and more accessible to patients with certain cancers.
9. What pricing options are available for accessing the report?
Pricing options include single-user, multi-user, and enterprise licenses priced at USD 4750, USD 5250, and USD 8750 respectively.
10. Is the market size provided in terms of value or volume?
The market size is provided in terms of value, measured in billion and volume, measured in K Unit.
11. Are there any specific market keywords associated with the report?
Yes, the market keyword associated with the report is "Cell-based Immunotherapies Industry," which aids in identifying and referencing the specific market segment covered.
12. How do I determine which pricing option suits my needs best?
The pricing options vary based on user requirements and access needs. Individual users may opt for single-user licenses, while businesses requiring broader access may choose multi-user or enterprise licenses for cost-effective access to the report.
13. Are there any additional resources or data provided in the Cell-based Immunotherapies Industry report?
While the report offers comprehensive insights, it's advisable to review the specific contents or supplementary materials provided to ascertain if additional resources or data are available.
14. How can I stay updated on further developments or reports in the Cell-based Immunotherapies Industry?
To stay informed about further developments, trends, and reports in the Cell-based Immunotherapies Industry, consider subscribing to industry newsletters, following relevant companies and organizations, or regularly checking reputable industry news sources and publications.
Methodology
Step 1 - Identification of Relevant Samples Size from Population Database


Step 2 - Approaches for Defining Global Market Size (Value, Volume* & Price*)

Note*: In applicable scenarios
Step 3 - Data Sources
Primary Research
- Web Analytics
- Survey Reports
- Research Institute
- Latest Research Reports
- Opinion Leaders
Secondary Research
- Annual Reports
- White Paper
- Latest Press Release
- Industry Association
- Paid Database
- Investor Presentations

Step 4 - Data Triangulation
Involves using different sources of information in order to increase the validity of a study
These sources are likely to be stakeholders in a program - participants, other researchers, program staff, other community members, and so on.
Then we put all data in single framework & apply various statistical tools to find out the dynamic on the market.
During the analysis stage, feedback from the stakeholder groups would be compared to determine areas of agreement as well as areas of divergence