

Key Insights
The global Intravenous Immunoglobulin (IVIG) market is projected to reach $15.6 billion by 2024, exhibiting a Compound Annual Growth Rate (CAGR) of 7.8% during the forecast period. This growth is primarily driven by the increasing incidence of autoimmune diseases and primary immunodeficiencies worldwide. Advancements in therapeutic applications and enhanced awareness of IVIG efficacy among healthcare professionals and patients are key contributors. The market is also bolstered by rising demand for effective treatments for conditions like Hypogammaglobulinemia, Chronic Inflammatory Demyelinating Polyneuropathy (CIDP), Myasthenia Gravis, and other complex immune disorders. An aging global population and improved diagnostic capabilities further expand the patient pool requiring IVIG therapy, while expanding indications and ongoing research and development are expected to accelerate market expansion.
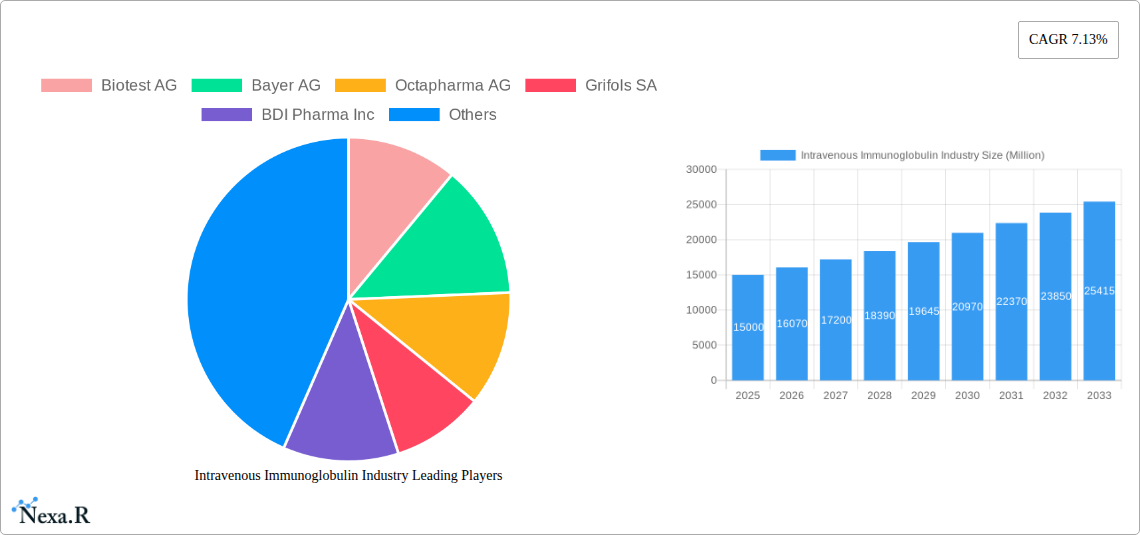
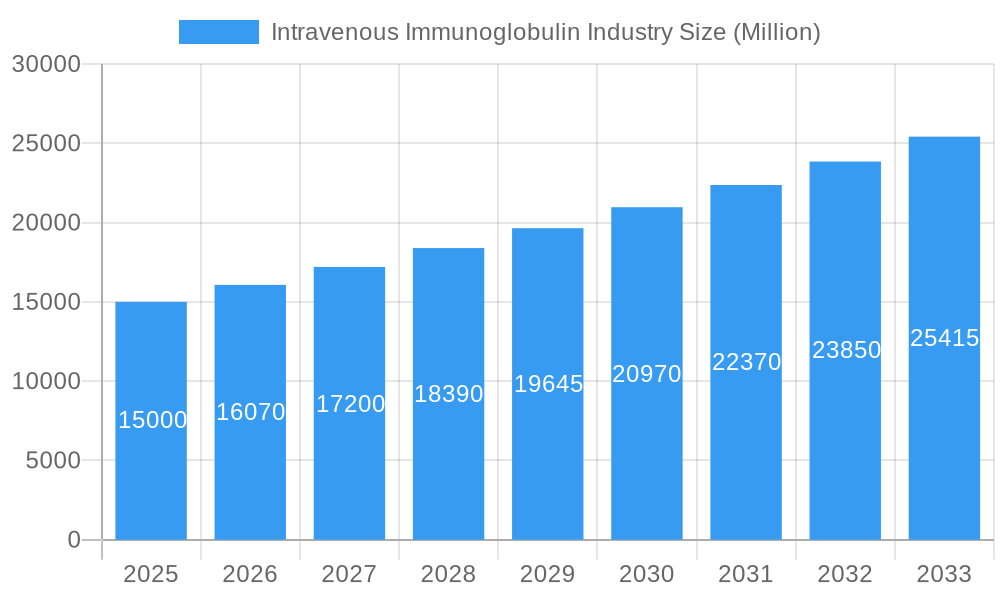
Intravenous Immunoglobulin Industry Market Size (In Billion)
Key segments within the IVIG market demonstrate distinct growth patterns. The IgG segment, representing the most prevalent form, is expected to maintain market dominance due to its broad therapeutic uses. However, other immunoglobulins such as IgA and IgM are gaining prominence as research reveals their potential in treating specific immune deficiencies. Geographically, North America and Europe currently lead the market, supported by robust healthcare infrastructure, high per capita healthcare expenditure, and early adoption of advanced therapies. The Asia Pacific region presents a significant growth opportunity, attributed to improving healthcare accessibility, a large untapped patient population, and increasing investments in biopharmaceutical manufacturing. Despite strong growth prospects, restraints include the high cost of IVIG treatments and potential supply chain vulnerabilities linked to plasma donor reliance. Nevertheless, efforts to optimize production and explore alternative sources are anticipated to mitigate these challenges, ensuring sustained market expansion.
Intravenous Immunoglobulin Industry Company Market Share
This comprehensive report offers a strategic analysis of the global Intravenous Immunoglobulin (IVIG) market, providing critical insights into market dynamics, growth trajectories, and the competitive landscape from 2019 to 2033, with a base year of 2024. Examine the IVIG market size, market share, and the growing demand for immunoglobulin therapies, fueled by increasing diagnoses of immunodeficiency disorders and neurological conditions. We meticulously analyze market segmentation by IgG, IgA, IgM, IgE, and IgD, and by applications including Hypogammaglobulinemia, Primary Immunodeficiency Diseases, Myasthenia Gravis, Multifocal Motor Neuropathy, and Other Applications. This report is essential for stakeholders seeking to understand the future of IVIG treatment, immunoglobulin therapy market trends, and opportunities in rare disease treatments.
Intravenous Immunoglobulin Industry Market Dynamics & Structure
The global Intravenous Immunoglobulin (IVIG) market is characterized by a moderately concentrated structure, with key players investing heavily in research and development to enhance product efficacy and expand therapeutic applications. Technological innovation is a significant driver, focusing on improving purification processes and developing novel formulations with extended half-lives and reduced side effects. The regulatory landscape, overseen by bodies like the FDA and EMA, plays a crucial role in market access and product approvals, often requiring extensive clinical trials. Competitive product substitutes include subcutaneous immunoglobulin (SCIG) and alternative treatments for specific indications, though IVIG maintains a strong position due to its established efficacy and rapid administration for acute conditions. End-user demographics are evolving, with an aging global population and increasing awareness of rare diseases contributing to a broader patient base. Mergers and acquisitions (M&A) are a notable trend, aimed at consolidating market presence, acquiring advanced technologies, and expanding product portfolios. For instance, the year 2023 saw estimated XX M&A deals valued at approximately $XXX million, reflecting the strategic importance of this sector. The market penetration for IVIG is estimated to be around XX% in developed nations for its primary indications.
- Market Concentration: Dominated by a few key global manufacturers with strong R&D capabilities.
- Technological Innovation Drivers: Focus on plasma fractionation efficiency, product safety, and novel delivery systems.
- Regulatory Frameworks: Strict adherence to GMP and quality control standards for plasma-derived products.
- Competitive Product Substitutes: Subcutaneous immunoglobulin (SCIG) and emerging biologic therapies.
- End-User Demographics: Increasing prevalence of autoimmune and primary immunodeficiency diseases, aging population.
- M&A Trends: Consolidation for market share, technology acquisition, and geographic expansion.
Intravenous Immunoglobulin Industry Growth Trends & Insights
The Intravenous Immunoglobulin (IVIG) industry is poised for significant expansion, projected to grow at a Compound Annual Growth Rate (CAGR) of approximately XX% between 2025 and 2033. This robust growth is underpinned by several key trends, including the increasing incidence of autoimmune diseases and primary immunodeficiency disorders, coupled with advancements in diagnostic capabilities that enable earlier and more accurate patient identification. The global immunoglobulin market is witnessing a heightened adoption of IVIG therapies due to their proven efficacy in managing complex conditions such as generalized myasthenia gravis (gMG) and multifocal motor neuropathy (MMN). Technological disruptions, such as the development of more efficient plasma fractionation techniques and the exploration of recombinant immunoglobulin alternatives, are expected to further optimize production and potentially reduce costs, although plasma-derived IVIG will likely remain dominant in the forecast period. Shifts in consumer behavior are also contributing, with patients and healthcare providers increasingly prioritizing treatments that offer improved quality of life and reduced hospitalizations. The market penetration for IVIG in treating chronic immune deficiencies is estimated to reach XX% by 2033. The total IVIG market value is forecast to reach $XX,XXX million by 2033, up from an estimated $XX,XXX million in 2025.
Dominant Regions, Countries, or Segments in Intravenous Immunoglobulin Industry
North America, particularly the United States, currently dominates the Intravenous Immunoglobulin (IVIG) market, driven by a high prevalence of primary immunodeficiency diseases and neurological disorders requiring IVIG treatment, a robust healthcare infrastructure, and advanced reimbursement policies. Within the product segments, IgG remains the most dominant type, accounting for an estimated XX% of the total market share in 2025, due to its broad therapeutic applications in treating various autoimmune and immunodeficiency conditions. Among applications, Hypogammaglobulinemia and Primary Immunodeficiency Diseases collectively represent the largest market segment, estimated at XX% of the total IVIG market in 2025. The strong presence of leading pharmaceutical companies, significant investments in R&D, and a high degree of market penetration for IVIG therapies contribute to North America's leading position. Furthermore, increasing awareness campaigns and improved access to specialized treatment centers for rare diseases are key growth drivers. The United States is expected to maintain its leadership due to its large patient population and advanced medical research ecosystem, with a projected market value of $XX,XXX million in 2033.
- Dominant Region: North America (especially the USA).
- Dominant Type: IgG.
- Dominant Application: Hypogammaglobulinemia & Primary Immunodeficiency Diseases.
- Key Drivers in Dominant Segments: High disease prevalence, advanced healthcare infrastructure, strong R&D, favorable reimbursement policies, and market penetration.
- Growth Potential: Continued expansion driven by increasing diagnoses and therapeutic advancements.
Intravenous Immunoglobulin Industry Product Landscape
The IVIG product landscape is characterized by a range of sophisticated formulations, primarily based on human immunoglobulin G (IgG), designed for intravenous administration. These products offer critical therapeutic benefits for patients with compromised immune systems and certain autoimmune disorders. Key innovations focus on enhancing product purity, safety profiles, and convenience of administration. Companies are actively researching and developing formulations with optimized half-lives and reduced immunogenicity. Performance metrics such as efficacy in treating specific diseases, safety profiles, and patient tolerance are paramount. Unique selling propositions often revolve around brand reputation, established clinical data, and the reliability of supply chains. The ongoing evolution of IVIG products aims to address unmet medical needs and improve patient outcomes.
Key Drivers, Barriers & Challenges in Intravenous Immunoglobulin Industry
The Intravenous Immunoglobulin (IVIG) industry is propelled by several key drivers. The escalating prevalence of primary immunodeficiency diseases and autoimmune disorders globally is a primary growth catalyst. Furthermore, continuous advancements in research and development, leading to improved diagnostic tools and a deeper understanding of disease pathophysiology, contribute to increased patient identification and treatment initiation. Favorable reimbursement policies in many developed economies also play a crucial role in ensuring patient access to these life-saving therapies.
However, the industry faces significant barriers and challenges. The reliance on human plasma as the primary source material presents inherent supply chain vulnerabilities and ethical considerations. Stringent regulatory hurdles and the lengthy approval processes for new IVIG products can impede market entry. High manufacturing costs associated with plasma fractionation and purification contribute to the overall expense of IVIG therapies, making accessibility a concern in developing regions. Intense competition among established players and the emergence of alternative treatments like subcutaneous immunoglobulin (SCIG) also pose challenges.
Emerging Opportunities in Intravenous Immunoglobulin Industry
Emerging opportunities in the Intravenous Immunoglobulin (IVIG) industry lie in several key areas. There is a significant untapped market potential in emerging economies where awareness and access to IVIG therapies are still limited, presenting opportunities for market expansion. Innovative applications for IVIG beyond its traditional uses, particularly in the management of rare neurological and inflammatory conditions, are continuously being explored through ongoing clinical research. Evolving consumer preferences are driving demand for more convenient and patient-centric treatment options, including the development of more concentrated IVIG formulations and improved delivery systems. Furthermore, advancements in plasma collection and processing technologies offer opportunities to enhance supply chain efficiency and potentially reduce manufacturing costs.
Growth Accelerators in the Intravenous Immunoglobulin Industry Industry
Several catalysts are accelerating the long-term growth of the Intravenous Immunoglobulin (IVIG) industry. Technological breakthroughs in plasma fractionation and purification processes are enhancing efficiency and product yield, contributing to a more stable and potentially cost-effective supply. Strategic partnerships and collaborations between plasma collection organizations and IVIG manufacturers are crucial for ensuring a consistent and high-quality plasma supply. Moreover, ongoing clinical trials exploring novel indications for IVIG, such as in certain types of infections and inflammatory conditions, are expanding its therapeutic scope. Market expansion strategies, including penetration into underserved geographic regions and targeted outreach to healthcare providers specializing in immunology and neurology, are also significant growth accelerators.
Key Players Shaping the Intravenous Immunoglobulin Industry Market
- Biotest AG
- Bayer AG
- Octapharma AG
- Grifols SA
- BDI Pharma Inc
- Shanghai RAAS Blood Products Co Ltd
- Takeda Pharmaceutical Company Limited
- Bio Products Laboratory Ltd
- Hualan Biological Engineering Inc
- LFB Biotechnologies SAS
- Baxter International Inc
- CSL Behring
- Kedrion SpA
- China Biologic Products Holdings Inc
- ADMA Biologics Inc
Notable Milestones in Intravenous Immunoglobulin Industry Sector
- March 2022: Sanofi and Seagen Inc. entered into an exclusive collaboration agreement to design, develop, and commercialize antibody-drug conjugates (ADCs) for up to three cancer targets. This collaboration utilizes Sanofi's proprietary monoclonal antibody (mAb) technology and Seagen's proprietary ADC technology.
- January 2022: Argenx SE revealed that Japan's Ministry of Health, Labour and Welfare (MHLW) approved VYVGART (efgartigimod alfa) intravenous infusion for the treatment of adult patients with generalized myasthenia gravis (gMG) who do not have a sufficient response to steroids or non-steroidal immunosuppressive therapies (ISTs).
In-Depth Intravenous Immunoglobulin Industry Market Outlook
The Intravenous Immunoglobulin (IVIG) market exhibits a promising future, driven by sustained demand and ongoing therapeutic advancements. Growth accelerators include the increasing global burden of immunodeficiency disorders, expanding indications for IVIG in autoimmune conditions, and significant investments in R&D by leading companies. Strategic opportunities lie in the untapped potential of emerging markets and the development of next-generation IVIG formulations offering enhanced efficacy and patient convenience. The focus on precision medicine and personalized treatment approaches will further shape the IVIG landscape, ensuring its continued relevance and growth in addressing complex medical needs. The market is projected to witness substantial expansion, creating lucrative avenues for stakeholders.
Intravenous Immunoglobulin Industry Segmentation
-
1. Type
- 1.1. IgG
- 1.2. IgA
- 1.3. IgM
- 1.4. IgE
- 1.5. IgD
-
2. Application
- 2.1. Hypogammaglobulinemia
- 2.2. Chronic
- 2.3. Primary Immunodeficiency Diseases
- 2.4. Myasthenia Gravis
- 2.5. Multifocal Motor Neuropathy
- 2.6. Other Applications
Intravenous Immunoglobulin Industry Segmentation By Geography
-
1. North America
- 1.1. United States
- 1.2. Canada
- 1.3. Mexico
-
2. Europe
- 2.1. Germany
- 2.2. United Kingdom
- 2.3. France
- 2.4. Italy
- 2.5. Spain
- 2.6. Rest of Europe
-
3. Asia Pacific
- 3.1. China
- 3.2. Japan
- 3.3. India
- 3.4. Australia
- 3.5. South Korea
- 3.6. Rest of Asia Pacific
-
4. Middle East and Africa
- 4.1. GCC
- 4.2. South Africa
- 4.3. Rest of Middle East and Africa
-
5. South America
- 5.1. Brazil
- 5.2. Argentina
- 5.3. Rest of South America
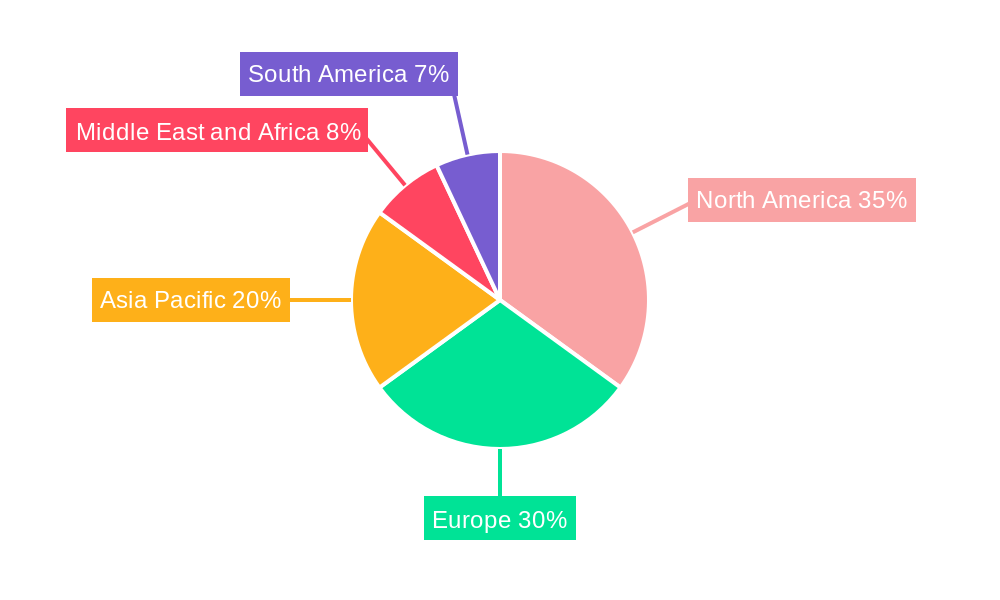
Intravenous Immunoglobulin Industry Regional Market Share
Geographic Coverage of Intravenous Immunoglobulin Industry
Intravenous Immunoglobulin Industry REPORT HIGHLIGHTS
| Aspects | Details |
|---|---|
| Study Period | 2020-2034 |
| Base Year | 2025 |
| Estimated Year | 2026 |
| Forecast Period | 2026-2034 |
| Historical Period | 2020-2025 |
| Growth Rate | CAGR of 7.8% from 2020-2034 |
| Segmentation |
|
Table of Contents
- 1. Introduction
- 1.1. Research Scope
- 1.2. Market Segmentation
- 1.3. Research Objective
- 1.4. Definitions and Assumptions
- 2. Executive Summary
- 2.1. Market Snapshot
- 3. Market Dynamics
- 3.1. Market Drivers
- 3.2. Market Restrains
- 3.3. Market Trends
- 3.4. Market Opportunities
- 4. Market Factor Analysis
- 4.1. Porters Five Forces
- 4.1.1. Bargaining Power of Suppliers
- 4.1.2. Bargaining Power of Buyers
- 4.1.3. Threat of New Entrants
- 4.1.4. Threat of Substitutes
- 4.1.5. Competitive Rivalry
- 4.2. PESTEL analysis
- 4.3. BCG Analysis
- 4.3.1. Stars (High Growth, High Market Share)
- 4.3.2. Cash Cows (Low Growth, High Market Share)
- 4.3.3. Question Mark (High Growth, Low Market Share)
- 4.3.4. Dogs (Low Growth, Low Market Share)
- 4.4. Ansoff Matrix Analysis
- 4.5. Supply Chain Analysis
- 4.6. Regulatory Landscape
- 4.7. Current Market Potential and Opportunity Assessment (TAM–SAM–SOM Framework)
- 4.8. NRP Analyst Note
- 4.1. Porters Five Forces
- 5. Market Analysis, Insights and Forecast 2021-2033
- 5.1. Market Analysis, Insights and Forecast - by Type
- 5.1.1. IgG
- 5.1.2. IgA
- 5.1.3. IgM
- 5.1.4. IgE
- 5.1.5. IgD
- 5.2. Market Analysis, Insights and Forecast - by Application
- 5.2.1. Hypogammaglobulinemia
- 5.2.2. Chronic
- 5.2.3. Primary Immunodeficiency Diseases
- 5.2.4. Myasthenia Gravis
- 5.2.5. Multifocal Motor Neuropathy
- 5.2.6. Other Applications
- 5.3. Market Analysis, Insights and Forecast - by Region
- 5.3.1. North America
- 5.3.2. Europe
- 5.3.3. Asia Pacific
- 5.3.4. Middle East and Africa
- 5.3.5. South America
- 5.1. Market Analysis, Insights and Forecast - by Type
- 6. Global Intravenous Immunoglobulin Industry Analysis, Insights and Forecast, 2021-2033
- 6.1. Market Analysis, Insights and Forecast - by Type
- 6.1.1. IgG
- 6.1.2. IgA
- 6.1.3. IgM
- 6.1.4. IgE
- 6.1.5. IgD
- 6.2. Market Analysis, Insights and Forecast - by Application
- 6.2.1. Hypogammaglobulinemia
- 6.2.2. Chronic
- 6.2.3. Primary Immunodeficiency Diseases
- 6.2.4. Myasthenia Gravis
- 6.2.5. Multifocal Motor Neuropathy
- 6.2.6. Other Applications
- 6.1. Market Analysis, Insights and Forecast - by Type
- 7. North America Intravenous Immunoglobulin Industry Analysis, Insights and Forecast, 2020-2032
- 7.1. Market Analysis, Insights and Forecast - by Type
- 7.1.1. IgG
- 7.1.2. IgA
- 7.1.3. IgM
- 7.1.4. IgE
- 7.1.5. IgD
- 7.2. Market Analysis, Insights and Forecast - by Application
- 7.2.1. Hypogammaglobulinemia
- 7.2.2. Chronic
- 7.2.3. Primary Immunodeficiency Diseases
- 7.2.4. Myasthenia Gravis
- 7.2.5. Multifocal Motor Neuropathy
- 7.2.6. Other Applications
- 7.1. Market Analysis, Insights and Forecast - by Type
- 8. Europe Intravenous Immunoglobulin Industry Analysis, Insights and Forecast, 2020-2032
- 8.1. Market Analysis, Insights and Forecast - by Type
- 8.1.1. IgG
- 8.1.2. IgA
- 8.1.3. IgM
- 8.1.4. IgE
- 8.1.5. IgD
- 8.2. Market Analysis, Insights and Forecast - by Application
- 8.2.1. Hypogammaglobulinemia
- 8.2.2. Chronic
- 8.2.3. Primary Immunodeficiency Diseases
- 8.2.4. Myasthenia Gravis
- 8.2.5. Multifocal Motor Neuropathy
- 8.2.6. Other Applications
- 8.1. Market Analysis, Insights and Forecast - by Type
- 9. Asia Pacific Intravenous Immunoglobulin Industry Analysis, Insights and Forecast, 2020-2032
- 9.1. Market Analysis, Insights and Forecast - by Type
- 9.1.1. IgG
- 9.1.2. IgA
- 9.1.3. IgM
- 9.1.4. IgE
- 9.1.5. IgD
- 9.2. Market Analysis, Insights and Forecast - by Application
- 9.2.1. Hypogammaglobulinemia
- 9.2.2. Chronic
- 9.2.3. Primary Immunodeficiency Diseases
- 9.2.4. Myasthenia Gravis
- 9.2.5. Multifocal Motor Neuropathy
- 9.2.6. Other Applications
- 9.1. Market Analysis, Insights and Forecast - by Type
- 10. Middle East and Africa Intravenous Immunoglobulin Industry Analysis, Insights and Forecast, 2020-2032
- 10.1. Market Analysis, Insights and Forecast - by Type
- 10.1.1. IgG
- 10.1.2. IgA
- 10.1.3. IgM
- 10.1.4. IgE
- 10.1.5. IgD
- 10.2. Market Analysis, Insights and Forecast - by Application
- 10.2.1. Hypogammaglobulinemia
- 10.2.2. Chronic
- 10.2.3. Primary Immunodeficiency Diseases
- 10.2.4. Myasthenia Gravis
- 10.2.5. Multifocal Motor Neuropathy
- 10.2.6. Other Applications
- 10.1. Market Analysis, Insights and Forecast - by Type
- 11. South America Intravenous Immunoglobulin Industry Analysis, Insights and Forecast, 2020-2032
- 11.1. Market Analysis, Insights and Forecast - by Type
- 11.1.1. IgG
- 11.1.2. IgA
- 11.1.3. IgM
- 11.1.4. IgE
- 11.1.5. IgD
- 11.2. Market Analysis, Insights and Forecast - by Application
- 11.2.1. Hypogammaglobulinemia
- 11.2.2. Chronic
- 11.2.3. Primary Immunodeficiency Diseases
- 11.2.4. Myasthenia Gravis
- 11.2.5. Multifocal Motor Neuropathy
- 11.2.6. Other Applications
- 11.1. Market Analysis, Insights and Forecast - by Type
- 12. Competitive Analysis
- 12.1. Company Profiles
- 12.1.1 Biotest AG
- 12.1.1.1. Company Overview
- 12.1.1.2. Products
- 12.1.1.3. Company Financials
- 12.1.1.4. SWOT Analysis
- 12.1.2 Bayer AG
- 12.1.2.1. Company Overview
- 12.1.2.2. Products
- 12.1.2.3. Company Financials
- 12.1.2.4. SWOT Analysis
- 12.1.3 Octapharma AG
- 12.1.3.1. Company Overview
- 12.1.3.2. Products
- 12.1.3.3. Company Financials
- 12.1.3.4. SWOT Analysis
- 12.1.4 Grifols SA
- 12.1.4.1. Company Overview
- 12.1.4.2. Products
- 12.1.4.3. Company Financials
- 12.1.4.4. SWOT Analysis
- 12.1.5 BDI Pharma Inc
- 12.1.5.1. Company Overview
- 12.1.5.2. Products
- 12.1.5.3. Company Financials
- 12.1.5.4. SWOT Analysis
- 12.1.6 Shanghai RAAS Blood Products Co Ltd
- 12.1.6.1. Company Overview
- 12.1.6.2. Products
- 12.1.6.3. Company Financials
- 12.1.6.4. SWOT Analysis
- 12.1.7 Takeda Pharmaceutical Company Limited
- 12.1.7.1. Company Overview
- 12.1.7.2. Products
- 12.1.7.3. Company Financials
- 12.1.7.4. SWOT Analysis
- 12.1.8 Bio Products Laboratory Ltd
- 12.1.8.1. Company Overview
- 12.1.8.2. Products
- 12.1.8.3. Company Financials
- 12.1.8.4. SWOT Analysis
- 12.1.9 Hualan Biological Engineering Inc
- 12.1.9.1. Company Overview
- 12.1.9.2. Products
- 12.1.9.3. Company Financials
- 12.1.9.4. SWOT Analysis
- 12.1.10 LFB Biotechnologies SAS
- 12.1.10.1. Company Overview
- 12.1.10.2. Products
- 12.1.10.3. Company Financials
- 12.1.10.4. SWOT Analysis
- 12.1.11 Baxter International Inc
- 12.1.11.1. Company Overview
- 12.1.11.2. Products
- 12.1.11.3. Company Financials
- 12.1.11.4. SWOT Analysis
- 12.1.12 CSL Behring
- 12.1.12.1. Company Overview
- 12.1.12.2. Products
- 12.1.12.3. Company Financials
- 12.1.12.4. SWOT Analysis
- 12.1.13 Kedrion SpA
- 12.1.13.1. Company Overview
- 12.1.13.2. Products
- 12.1.13.3. Company Financials
- 12.1.13.4. SWOT Analysis
- 12.1.14 China Biologic Products Holdings Inc
- 12.1.14.1. Company Overview
- 12.1.14.2. Products
- 12.1.14.3. Company Financials
- 12.1.14.4. SWOT Analysis
- 12.1.15 ADMA Biologics Inc *List Not Exhaustive
- 12.1.15.1. Company Overview
- 12.1.15.2. Products
- 12.1.15.3. Company Financials
- 12.1.15.4. SWOT Analysis
- 12.1.1 Biotest AG
- 12.2. Market Entropy
- 12.2.1 Company's Key Areas Served
- 12.2.2 Recent Developments
- 12.3. Company Market Share Analysis 2025
- 12.3.1 Top 5 Companies Market Share Analysis
- 12.3.2 Top 3 Companies Market Share Analysis
- 12.4. List of Potential Customers
- 13. Research Methodology
List of Figures
- Figure 1: Global Intravenous Immunoglobulin Industry Revenue Breakdown (billion, %) by Region 2025 & 2033
- Figure 2: North America Intravenous Immunoglobulin Industry Revenue (billion), by Type 2025 & 2033
- Figure 3: North America Intravenous Immunoglobulin Industry Revenue Share (%), by Type 2025 & 2033
- Figure 4: North America Intravenous Immunoglobulin Industry Revenue (billion), by Application 2025 & 2033
- Figure 5: North America Intravenous Immunoglobulin Industry Revenue Share (%), by Application 2025 & 2033
- Figure 6: North America Intravenous Immunoglobulin Industry Revenue (billion), by Country 2025 & 2033
- Figure 7: North America Intravenous Immunoglobulin Industry Revenue Share (%), by Country 2025 & 2033
- Figure 8: Europe Intravenous Immunoglobulin Industry Revenue (billion), by Type 2025 & 2033
- Figure 9: Europe Intravenous Immunoglobulin Industry Revenue Share (%), by Type 2025 & 2033
- Figure 10: Europe Intravenous Immunoglobulin Industry Revenue (billion), by Application 2025 & 2033
- Figure 11: Europe Intravenous Immunoglobulin Industry Revenue Share (%), by Application 2025 & 2033
- Figure 12: Europe Intravenous Immunoglobulin Industry Revenue (billion), by Country 2025 & 2033
- Figure 13: Europe Intravenous Immunoglobulin Industry Revenue Share (%), by Country 2025 & 2033
- Figure 14: Asia Pacific Intravenous Immunoglobulin Industry Revenue (billion), by Type 2025 & 2033
- Figure 15: Asia Pacific Intravenous Immunoglobulin Industry Revenue Share (%), by Type 2025 & 2033
- Figure 16: Asia Pacific Intravenous Immunoglobulin Industry Revenue (billion), by Application 2025 & 2033
- Figure 17: Asia Pacific Intravenous Immunoglobulin Industry Revenue Share (%), by Application 2025 & 2033
- Figure 18: Asia Pacific Intravenous Immunoglobulin Industry Revenue (billion), by Country 2025 & 2033
- Figure 19: Asia Pacific Intravenous Immunoglobulin Industry Revenue Share (%), by Country 2025 & 2033
- Figure 20: Middle East and Africa Intravenous Immunoglobulin Industry Revenue (billion), by Type 2025 & 2033
- Figure 21: Middle East and Africa Intravenous Immunoglobulin Industry Revenue Share (%), by Type 2025 & 2033
- Figure 22: Middle East and Africa Intravenous Immunoglobulin Industry Revenue (billion), by Application 2025 & 2033
- Figure 23: Middle East and Africa Intravenous Immunoglobulin Industry Revenue Share (%), by Application 2025 & 2033
- Figure 24: Middle East and Africa Intravenous Immunoglobulin Industry Revenue (billion), by Country 2025 & 2033
- Figure 25: Middle East and Africa Intravenous Immunoglobulin Industry Revenue Share (%), by Country 2025 & 2033
- Figure 26: South America Intravenous Immunoglobulin Industry Revenue (billion), by Type 2025 & 2033
- Figure 27: South America Intravenous Immunoglobulin Industry Revenue Share (%), by Type 2025 & 2033
- Figure 28: South America Intravenous Immunoglobulin Industry Revenue (billion), by Application 2025 & 2033
- Figure 29: South America Intravenous Immunoglobulin Industry Revenue Share (%), by Application 2025 & 2033
- Figure 30: South America Intravenous Immunoglobulin Industry Revenue (billion), by Country 2025 & 2033
- Figure 31: South America Intravenous Immunoglobulin Industry Revenue Share (%), by Country 2025 & 2033
List of Tables
- Table 1: Global Intravenous Immunoglobulin Industry Revenue billion Forecast, by Type 2020 & 2033
- Table 2: Global Intravenous Immunoglobulin Industry Revenue billion Forecast, by Application 2020 & 2033
- Table 3: Global Intravenous Immunoglobulin Industry Revenue billion Forecast, by Region 2020 & 2033
- Table 4: Global Intravenous Immunoglobulin Industry Revenue billion Forecast, by Type 2020 & 2033
- Table 5: Global Intravenous Immunoglobulin Industry Revenue billion Forecast, by Application 2020 & 2033
- Table 6: Global Intravenous Immunoglobulin Industry Revenue billion Forecast, by Country 2020 & 2033
- Table 7: United States Intravenous Immunoglobulin Industry Revenue (billion) Forecast, by Application 2020 & 2033
- Table 8: Canada Intravenous Immunoglobulin Industry Revenue (billion) Forecast, by Application 2020 & 2033
- Table 9: Mexico Intravenous Immunoglobulin Industry Revenue (billion) Forecast, by Application 2020 & 2033
- Table 10: Global Intravenous Immunoglobulin Industry Revenue billion Forecast, by Type 2020 & 2033
- Table 11: Global Intravenous Immunoglobulin Industry Revenue billion Forecast, by Application 2020 & 2033
- Table 12: Global Intravenous Immunoglobulin Industry Revenue billion Forecast, by Country 2020 & 2033
- Table 13: Germany Intravenous Immunoglobulin Industry Revenue (billion) Forecast, by Application 2020 & 2033
- Table 14: United Kingdom Intravenous Immunoglobulin Industry Revenue (billion) Forecast, by Application 2020 & 2033
- Table 15: France Intravenous Immunoglobulin Industry Revenue (billion) Forecast, by Application 2020 & 2033
- Table 16: Italy Intravenous Immunoglobulin Industry Revenue (billion) Forecast, by Application 2020 & 2033
- Table 17: Spain Intravenous Immunoglobulin Industry Revenue (billion) Forecast, by Application 2020 & 2033
- Table 18: Rest of Europe Intravenous Immunoglobulin Industry Revenue (billion) Forecast, by Application 2020 & 2033
- Table 19: Global Intravenous Immunoglobulin Industry Revenue billion Forecast, by Type 2020 & 2033
- Table 20: Global Intravenous Immunoglobulin Industry Revenue billion Forecast, by Application 2020 & 2033
- Table 21: Global Intravenous Immunoglobulin Industry Revenue billion Forecast, by Country 2020 & 2033
- Table 22: China Intravenous Immunoglobulin Industry Revenue (billion) Forecast, by Application 2020 & 2033
- Table 23: Japan Intravenous Immunoglobulin Industry Revenue (billion) Forecast, by Application 2020 & 2033
- Table 24: India Intravenous Immunoglobulin Industry Revenue (billion) Forecast, by Application 2020 & 2033
- Table 25: Australia Intravenous Immunoglobulin Industry Revenue (billion) Forecast, by Application 2020 & 2033
- Table 26: South Korea Intravenous Immunoglobulin Industry Revenue (billion) Forecast, by Application 2020 & 2033
- Table 27: Rest of Asia Pacific Intravenous Immunoglobulin Industry Revenue (billion) Forecast, by Application 2020 & 2033
- Table 28: Global Intravenous Immunoglobulin Industry Revenue billion Forecast, by Type 2020 & 2033
- Table 29: Global Intravenous Immunoglobulin Industry Revenue billion Forecast, by Application 2020 & 2033
- Table 30: Global Intravenous Immunoglobulin Industry Revenue billion Forecast, by Country 2020 & 2033
- Table 31: GCC Intravenous Immunoglobulin Industry Revenue (billion) Forecast, by Application 2020 & 2033
- Table 32: South Africa Intravenous Immunoglobulin Industry Revenue (billion) Forecast, by Application 2020 & 2033
- Table 33: Rest of Middle East and Africa Intravenous Immunoglobulin Industry Revenue (billion) Forecast, by Application 2020 & 2033
- Table 34: Global Intravenous Immunoglobulin Industry Revenue billion Forecast, by Type 2020 & 2033
- Table 35: Global Intravenous Immunoglobulin Industry Revenue billion Forecast, by Application 2020 & 2033
- Table 36: Global Intravenous Immunoglobulin Industry Revenue billion Forecast, by Country 2020 & 2033
- Table 37: Brazil Intravenous Immunoglobulin Industry Revenue (billion) Forecast, by Application 2020 & 2033
- Table 38: Argentina Intravenous Immunoglobulin Industry Revenue (billion) Forecast, by Application 2020 & 2033
- Table 39: Rest of South America Intravenous Immunoglobulin Industry Revenue (billion) Forecast, by Application 2020 & 2033
Frequently Asked Questions
1. What is the projected Compound Annual Growth Rate (CAGR) of the Intravenous Immunoglobulin Industry?
The projected CAGR is approximately 7.8%.
2. Which companies are prominent players in the Intravenous Immunoglobulin Industry?
Key companies in the market include Biotest AG, Bayer AG, Octapharma AG, Grifols SA, BDI Pharma Inc, Shanghai RAAS Blood Products Co Ltd, Takeda Pharmaceutical Company Limited, Bio Products Laboratory Ltd, Hualan Biological Engineering Inc, LFB Biotechnologies SAS, Baxter International Inc, CSL Behring, Kedrion SpA, China Biologic Products Holdings Inc, ADMA Biologics Inc *List Not Exhaustive.
3. What are the main segments of the Intravenous Immunoglobulin Industry?
The market segments include Type, Application.
4. Can you provide details about the market size?
The market size is estimated to be USD 15.6 billion as of 2022.
5. What are some drivers contributing to market growth?
Rise in Geriatric Population; Increase in Adoption of Immunoglobulin Treatment; Growth in Prevalence of Immunodeficiency Diseases and Bleeding Disorders.
6. What are the notable trends driving market growth?
The Primary Immunodeficiency Diseases Segment is Expected to Register a High CAGR Over the Forecast Period.
7. Are there any restraints impacting market growth?
Stringent Government Regulations; High Cost of Therapy.
8. Can you provide examples of recent developments in the market?
In March 2022, Sanofi and Seagen Inc. entered into an exclusive collaboration agreement to design, develop, and commercialize antibody-drug conjugates (ADCs) for up to three cancer targets. The collaboration will utilize Sanofi's proprietary monoclonal antibody (mAb) technology and Seagen's proprietary ADC technology.
9. What pricing options are available for accessing the report?
Pricing options include single-user, multi-user, and enterprise licenses priced at USD 4750, USD 5250, and USD 8750 respectively.
10. Is the market size provided in terms of value or volume?
The market size is provided in terms of value, measured in billion.
11. Are there any specific market keywords associated with the report?
Yes, the market keyword associated with the report is "Intravenous Immunoglobulin Industry," which aids in identifying and referencing the specific market segment covered.
12. How do I determine which pricing option suits my needs best?
The pricing options vary based on user requirements and access needs. Individual users may opt for single-user licenses, while businesses requiring broader access may choose multi-user or enterprise licenses for cost-effective access to the report.
13. Are there any additional resources or data provided in the Intravenous Immunoglobulin Industry report?
While the report offers comprehensive insights, it's advisable to review the specific contents or supplementary materials provided to ascertain if additional resources or data are available.
14. How can I stay updated on further developments or reports in the Intravenous Immunoglobulin Industry?
To stay informed about further developments, trends, and reports in the Intravenous Immunoglobulin Industry, consider subscribing to industry newsletters, following relevant companies and organizations, or regularly checking reputable industry news sources and publications.
Methodology
Step 1 - Identification of Relevant Samples Size from Population Database


Step 2 - Approaches for Defining Global Market Size (Value, Volume* & Price*)

Note*: In applicable scenarios
Step 3 - Data Sources
Primary Research
- Web Analytics
- Survey Reports
- Research Institute
- Latest Research Reports
- Opinion Leaders
Secondary Research
- Annual Reports
- White Paper
- Latest Press Release
- Industry Association
- Paid Database
- Investor Presentations

Step 4 - Data Triangulation
Involves using different sources of information in order to increase the validity of a study
These sources are likely to be stakeholders in a program - participants, other researchers, program staff, other community members, and so on.
Then we put all data in single framework & apply various statistical tools to find out the dynamic on the market.
During the analysis stage, feedback from the stakeholder groups would be compared to determine areas of agreement as well as areas of divergence