

Key Insights
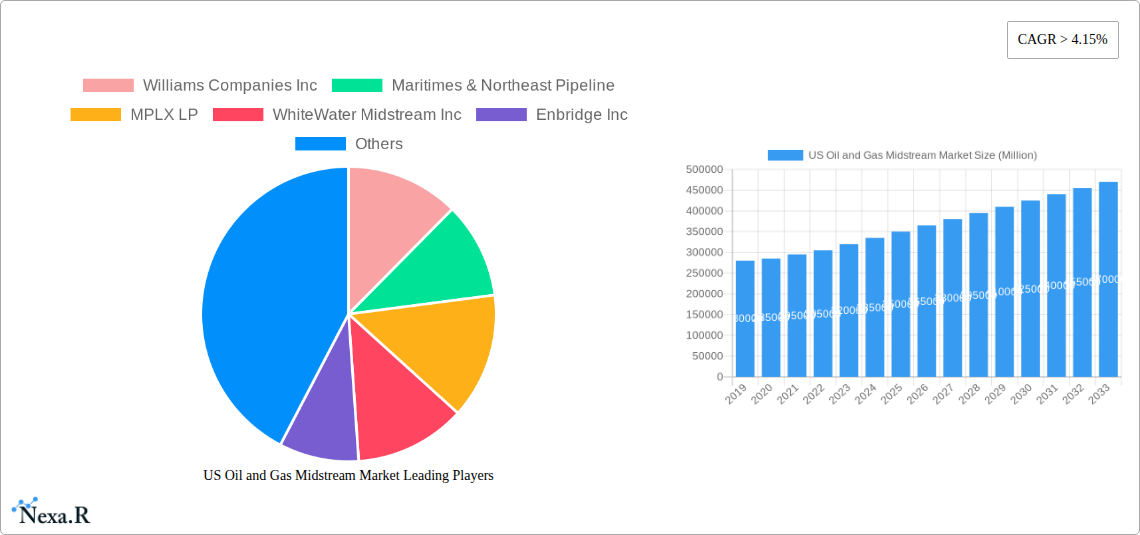
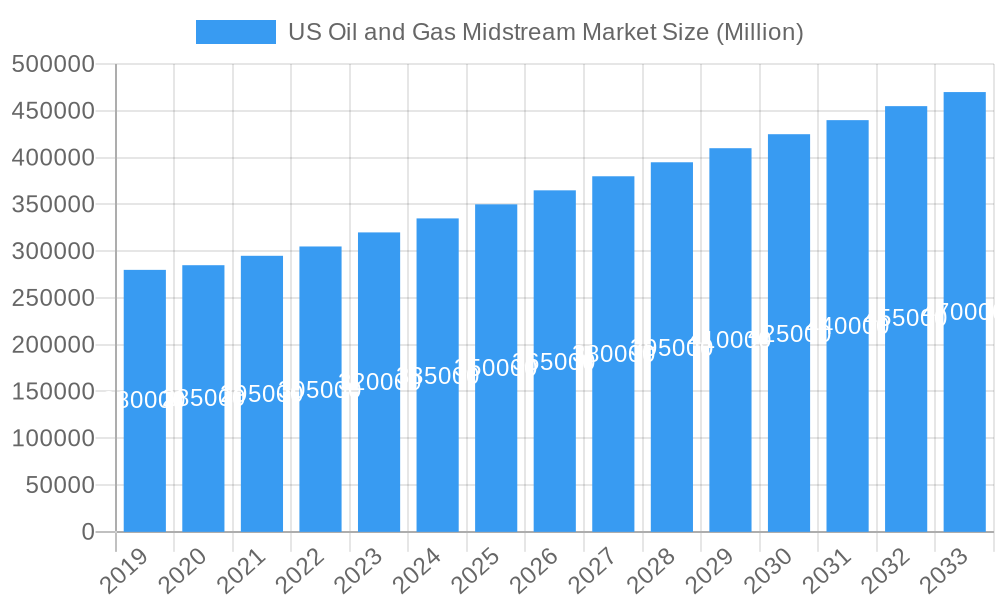
The US Oil and Gas Midstream market is poised for significant expansion, projected to reach an estimated market size of approximately $350 billion by 2025, with a robust Compound Annual Growth Rate (CAGR) exceeding 4.15% through 2033. This sustained growth is primarily propelled by escalating demand for energy, driven by a growing global population and increasing industrial activity. Key drivers include the ongoing development of unconventional oil and gas resources, particularly in shale formations, which necessitates extensive infrastructure for transportation and storage. Furthermore, the expanding need for liquefied natural gas (LNG) for both domestic consumption and international export markets is a substantial growth catalyst, demanding increased capacity and efficiency in LNG terminals. Investments in pipeline networks to connect production basins to demand centers, alongside the enhancement of storage facilities to manage supply fluctuations, will underpin this market's upward trajectory.
US Oil and Gas Midstream Market Market Size (In Billion)
The midstream sector is characterized by continuous innovation and strategic investments aimed at optimizing operations and meeting evolving market demands. Trends such as the adoption of advanced technologies for pipeline monitoring and maintenance, including artificial intelligence and IoT, are enhancing safety and operational efficiency. The increasing focus on decarbonization is also influencing the sector, with growing interest in carbon capture, utilization, and storage (CCUS) solutions and the development of infrastructure for transporting lower-carbon fuels. However, the market faces certain restraints, including stringent regulatory frameworks and environmental concerns that can impact project development timelines and costs. Geopolitical factors and volatility in commodity prices can also introduce uncertainties, necessitating adaptive strategies from market players. Nevertheless, the fundamental need for reliable and efficient energy infrastructure ensures a positive outlook for the US Oil and Gas Midstream market.
US Oil and Gas Midstream Market Company Market Share
Unlocking Opportunities: The US Oil and Gas Midstream Market Report
This comprehensive report delivers an in-depth analysis of the US Oil and Gas Midstream Market, a critical sector facilitating the efficient transportation, storage, and processing of crude oil and natural gas. Dive into market dynamics, growth trends, regional dominance, and the competitive landscape, equipping industry professionals with actionable insights for strategic decision-making. Our analysis covers the study period of 2019–2033, with a base year of 2025 and an extensive forecast period from 2025–2033, building upon a robust historical period of 2019–2024. All values are presented in Million units.
US Oil and Gas Midstream Market Market Dynamics & Structure
The US oil and gas midstream sector is characterized by a moderately concentrated market, with key players dominating significant infrastructure networks. Technological innovation plays a pivotal role, driven by advancements in pipeline integrity management, digital monitoring systems, and the increasing adoption of LNG terminals for global export. Regulatory frameworks, including environmental standards and permitting processes, significantly influence project development and operational efficiency. Competitive product substitutes, while limited in core transportation, emerge in areas like alternative energy storage solutions and evolving fuel consumption patterns, though the fundamental demand for fossil fuel transport remains strong. End-user demographics are influenced by industrial demand for power generation, manufacturing, and residential heating, creating consistent downstream pull. Mergers and acquisitions (M&A) trends continue to shape the landscape, with consolidation aimed at achieving economies of scale, expanding geographic reach, and integrating service offerings across the value chain.
- Market Concentration: Dominated by a few large, integrated midstream companies.
- Technological Innovation: Focus on enhancing safety, efficiency, and environmental performance.
- Regulatory Frameworks: Environmental regulations and permitting processes are key considerations.
- End-User Demographics: Driven by industrial, commercial, and residential energy consumption.
- M&A Trends: Strategic acquisitions and partnerships to enhance market position and portfolio diversification.
US Oil and Gas Midstream Market Growth Trends & Insights
The US Oil and Gas Midstream Market is poised for robust growth, driven by sustained domestic production and increasing export demands. Market size evolution is closely tied to upstream exploration and production activities, particularly in shale plays, which necessitate expanded gathering, processing, and transportation infrastructure. Adoption rates of advanced technologies, such as predictive maintenance analytics and smart pipeline monitoring, are accelerating to improve operational reliability and reduce environmental risks. Technological disruptions are primarily focused on enhancing the efficiency and safety of existing infrastructure, alongside innovations in LNG terminals and the integration of carbon capture technologies. Consumer behavior shifts, while not directly dictating midstream infrastructure, indirectly influence demand patterns for refined products and natural gas, thereby impacting the volumes flowing through midstream networks. The market is projected to experience a Compound Annual Growth Rate (CAGR) of approximately XX% from 2025 to 2033, with market penetration for new pipeline projects and terminal expansions reaching XX% by the end of the forecast period.
Dominant Regions, Countries, or Segments in US Oil and Gas Midstream Market
The Transportation segment is the dominant force within the US Oil and Gas Midstream Market, driven by the continuous need to move vast quantities of crude oil and natural gas from production basins to refining centers and export hubs. The Permian Basin in Texas and New Mexico consistently leads growth due to its prolific oil and gas production. Economic policies that support domestic energy production and export infrastructure development are key drivers in these regions. Furthermore, significant investments in pipeline expansion and new construction, coupled with the strategic importance of accessing coastal terminals for global trade, solidify transportation's leading position.
Transportation: The primary segment, encompassing crude oil, natural gas, and refined product pipelines.
- Key Drivers: High production volumes from shale plays, increasing export demand for both crude oil and natural gas.
- Infrastructure Development: Continuous investment in expanding existing pipeline networks and constructing new routes.
- Market Share: Holds the largest share of the midstream market, estimated at XX% in 2025.
- Growth Potential: Significant growth anticipated due to ongoing upstream development and global energy demand.
Storage: Essential for balancing supply and demand, managing price volatility, and facilitating efficient processing.
- Key Drivers: Need for strategic reserves, seasonal demand fluctuations, and buffering production intermittency.
- Infrastructure: Dominated by tank farms for crude oil and NGLs, and underground storage for natural gas.
- Market Share: A significant but secondary segment, accounting for approximately XX% of the market.
LNG Terminals: Crucial for the liquefaction and export of natural gas, playing a vital role in global energy markets.
- Key Drivers: Increasing global demand for natural gas, US's competitive natural gas production.
- Infrastructure: Growing number of export facilities along the Gulf Coast.
- Market Share: A rapidly growing segment, estimated at XX% in 2025, with substantial future expansion potential.
US Oil and Gas Midstream Market Product Landscape
The US Oil and Gas Midstream Market's product landscape is defined by the essential services it provides: transportation, storage, and processing of crude oil, natural gas, and natural gas liquids (NGLs). Innovation is focused on enhancing the efficiency and safety of existing infrastructure, including advanced pipeline coatings and leak detection technologies. The development of sophisticated processing facilities for NGL fractionation and the expansion of LNG terminals for export are key product advancements. Performance metrics are centered on throughput capacity, energy efficiency, reduced emissions, and reliability. Unique selling propositions lie in the ability to deliver large volumes of hydrocarbons reliably and cost-effectively to domestic and international markets, underpinned by extensive network coverage and advanced operational technologies.
Key Drivers, Barriers & Challenges in US Oil and Gas Midstream Market
Key Drivers:
- Sustained Hydrocarbon Production: Strong upstream production from shale formations is the primary engine.
- Growing Export Demand: Increasing global appetite for US crude oil and natural gas, particularly LNG.
- Infrastructure Modernization: Ongoing need to upgrade and expand aging pipeline networks.
- Technological Advancements: Improved efficiency, safety, and environmental monitoring in operations.
Barriers & Challenges:
- Regulatory Hurdles: Stringent environmental regulations and lengthy permitting processes can delay projects.
- Permitting Delays: Obtaining necessary approvals for new pipeline construction remains a significant challenge.
- Supply Chain Disruptions: Availability of materials and skilled labor can impact project timelines and costs.
- Public Opposition: Environmental concerns and local opposition can create significant project risks.
- Price Volatility: Fluctuations in crude oil and natural gas prices can impact investment decisions and project economics.
Emerging Opportunities in US Oil and Gas Midstream Market
Emerging opportunities in the US Oil and Gas Midstream Market lie in the continued expansion of LNG terminals to meet surging global demand and the development of midstream infrastructure for emerging energy sources. The increasing focus on decarbonization presents opportunities for investing in carbon capture, utilization, and storage (CCUS) infrastructure integrated with existing midstream assets. Furthermore, the repurposing of existing pipelines for new product streams and the development of digital solutions for enhanced operational efficiency and transparency represent significant untapped markets.
Growth Accelerators in the US Oil and Gas Midstream Market Industry
Growth accelerators for the US Oil and Gas Midstream Market are significantly boosted by ongoing technological breakthroughs in pipeline monitoring and maintenance, leading to enhanced safety and reduced downtime. Strategic partnerships between producers and midstream operators are crucial for de-risking new infrastructure development and ensuring market access. Furthermore, evolving global energy policies that favor increased natural gas utilization and liquefied natural gas (LNG) exports are a major catalyst for market expansion, particularly for LNG terminals.
Key Players Shaping the US Oil and Gas Midstream Market Market
- Williams Companies Inc
- Maritimes & Northeast Pipeline
- MPLX LP
- WhiteWater Midstream Inc
- Enbridge Inc
- Atlantic Coast Pipeline
- Enterprise Products Partners LP
- Energy Transfer Operating LP
- ONEOK Gas Transportation LLC
- Plains All American Pipeline LP
- Kinder Morgan Inc
Notable Milestones in US Oil and Gas Midstream Market Sector
- March 2022: New Fortress Energy Inc. announced the execution of two 20-year sale and purchase agreements (SPA) with Venture Global LNG. Under the agreement, Venture Global will supply 2 million tonnes per annum (MTPA) of LNG on a free on board (FOB) basis from its LNG facilities in Louisiana.
- November 2020: The Saginaw Trail Pipeline, a Consumer Energy interstate project replacing and expanding pipelines and other infrastructure, entered service with 200 MMcf/d (5.66 MMcm/d) of capacity in the central Michigan counties of Saginaw, Genesse, and Oakland.
In-Depth US Oil and Gas Midstream Market Market Outlook
The future outlook for the US Oil and Gas Midstream Market is exceptionally strong, driven by persistent demand for hydrocarbons and the critical role of midstream infrastructure in connecting supply to demand centers. Growth accelerators such as the global imperative for energy security and the increasing adoption of natural gas as a cleaner transition fuel will continue to fuel investments in transportation networks and LNG terminals. Strategic opportunities lie in expanding export capabilities, integrating new technologies for operational excellence, and exploring novel midstream solutions for emerging energy vectors, ensuring sustained profitability and market leadership.
US Oil and Gas Midstream Market Segmentation
- 1. Transportation
- 2. Storage
- 3. LNG Terminals
US Oil and Gas Midstream Market Segmentation By Geography
-
1. North America
- 1.1. United States
- 1.2. Canada
- 1.3. Mexico
-
2. South America
- 2.1. Brazil
- 2.2. Argentina
- 2.3. Rest of South America
-
3. Europe
- 3.1. United Kingdom
- 3.2. Germany
- 3.3. France
- 3.4. Italy
- 3.5. Spain
- 3.6. Russia
- 3.7. Benelux
- 3.8. Nordics
- 3.9. Rest of Europe
-
4. Middle East & Africa
- 4.1. Turkey
- 4.2. Israel
- 4.3. GCC
- 4.4. North Africa
- 4.5. South Africa
- 4.6. Rest of Middle East & Africa
-
5. Asia Pacific
- 5.1. China
- 5.2. India
- 5.3. Japan
- 5.4. South Korea
- 5.5. ASEAN
- 5.6. Oceania
- 5.7. Rest of Asia Pacific
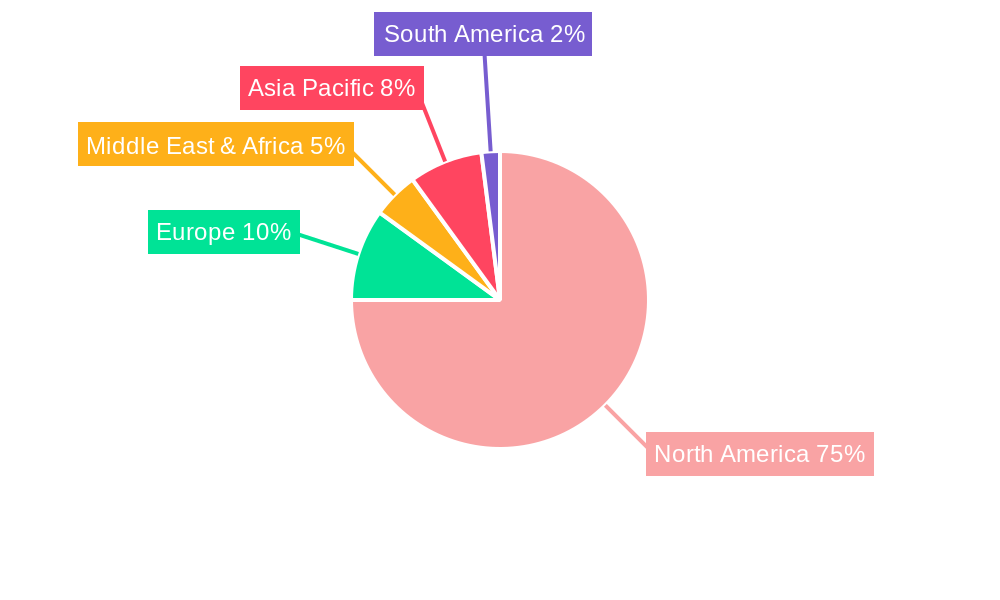
US Oil and Gas Midstream Market Regional Market Share
Geographic Coverage of US Oil and Gas Midstream Market
US Oil and Gas Midstream Market REPORT HIGHLIGHTS
| Aspects | Details |
|---|---|
| Study Period | 2020-2034 |
| Base Year | 2025 |
| Estimated Year | 2026 |
| Forecast Period | 2026-2034 |
| Historical Period | 2020-2025 |
| Growth Rate | CAGR of 3.2% from 2020-2034 |
| Segmentation |
|
Table of Contents
- 1. Introduction
- 1.1. Research Scope
- 1.2. Market Segmentation
- 1.3. Research Objective
- 1.4. Definitions and Assumptions
- 2. Executive Summary
- 2.1. Market Snapshot
- 3. Market Dynamics
- 3.1. Market Drivers
- 3.2. Market Restrains
- 3.3. Market Trends
- 3.4. Market Opportunities
- 4. Market Factor Analysis
- 4.1. Porters Five Forces
- 4.1.1. Bargaining Power of Suppliers
- 4.1.2. Bargaining Power of Buyers
- 4.1.3. Threat of New Entrants
- 4.1.4. Threat of Substitutes
- 4.1.5. Competitive Rivalry
- 4.2. PESTEL analysis
- 4.3. BCG Analysis
- 4.3.1. Stars (High Growth, High Market Share)
- 4.3.2. Cash Cows (Low Growth, High Market Share)
- 4.3.3. Question Mark (High Growth, Low Market Share)
- 4.3.4. Dogs (Low Growth, Low Market Share)
- 4.4. Ansoff Matrix Analysis
- 4.5. Supply Chain Analysis
- 4.6. Regulatory Landscape
- 4.7. Current Market Potential and Opportunity Assessment (TAM–SAM–SOM Framework)
- 4.8. NRP Analyst Note
- 4.1. Porters Five Forces
- 5. Market Analysis, Insights and Forecast 2021-2033
- 5.1. Market Analysis, Insights and Forecast - by Transportation
- 5.2. Market Analysis, Insights and Forecast - by Storage
- 5.3. Market Analysis, Insights and Forecast - by LNG Terminals
- 5.4. Market Analysis, Insights and Forecast - by Region
- 5.4.1. North America
- 5.4.2. South America
- 5.4.3. Europe
- 5.4.4. Middle East & Africa
- 5.4.5. Asia Pacific
- 6. Global US Oil and Gas Midstream Market Analysis, Insights and Forecast, 2021-2033
- 6.1. Market Analysis, Insights and Forecast - by Transportation
- 6.2. Market Analysis, Insights and Forecast - by Storage
- 6.3. Market Analysis, Insights and Forecast - by LNG Terminals
- 7. North America US Oil and Gas Midstream Market Analysis, Insights and Forecast, 2020-2032
- 7.1. Market Analysis, Insights and Forecast - by Transportation
- 7.2. Market Analysis, Insights and Forecast - by Storage
- 7.3. Market Analysis, Insights and Forecast - by LNG Terminals
- 8. South America US Oil and Gas Midstream Market Analysis, Insights and Forecast, 2020-2032
- 8.1. Market Analysis, Insights and Forecast - by Transportation
- 8.2. Market Analysis, Insights and Forecast - by Storage
- 8.3. Market Analysis, Insights and Forecast - by LNG Terminals
- 9. Europe US Oil and Gas Midstream Market Analysis, Insights and Forecast, 2020-2032
- 9.1. Market Analysis, Insights and Forecast - by Transportation
- 9.2. Market Analysis, Insights and Forecast - by Storage
- 9.3. Market Analysis, Insights and Forecast - by LNG Terminals
- 10. Middle East & Africa US Oil and Gas Midstream Market Analysis, Insights and Forecast, 2020-2032
- 10.1. Market Analysis, Insights and Forecast - by Transportation
- 10.2. Market Analysis, Insights and Forecast - by Storage
- 10.3. Market Analysis, Insights and Forecast - by LNG Terminals
- 11. Asia Pacific US Oil and Gas Midstream Market Analysis, Insights and Forecast, 2020-2032
- 11.1. Market Analysis, Insights and Forecast - by Transportation
- 11.2. Market Analysis, Insights and Forecast - by Storage
- 11.3. Market Analysis, Insights and Forecast - by LNG Terminals
- 12. Competitive Analysis
- 12.1. Company Profiles
- 12.1.1 Williams Companies Inc
- 12.1.1.1. Company Overview
- 12.1.1.2. Products
- 12.1.1.3. Company Financials
- 12.1.1.4. SWOT Analysis
- 12.1.2 Maritimes & Northeast Pipeline
- 12.1.2.1. Company Overview
- 12.1.2.2. Products
- 12.1.2.3. Company Financials
- 12.1.2.4. SWOT Analysis
- 12.1.3 MPLX LP
- 12.1.3.1. Company Overview
- 12.1.3.2. Products
- 12.1.3.3. Company Financials
- 12.1.3.4. SWOT Analysis
- 12.1.4 WhiteWater Midstream Inc
- 12.1.4.1. Company Overview
- 12.1.4.2. Products
- 12.1.4.3. Company Financials
- 12.1.4.4. SWOT Analysis
- 12.1.5 Enbridge Inc
- 12.1.5.1. Company Overview
- 12.1.5.2. Products
- 12.1.5.3. Company Financials
- 12.1.5.4. SWOT Analysis
- 12.1.6 Atlantic Coast Pipeline
- 12.1.6.1. Company Overview
- 12.1.6.2. Products
- 12.1.6.3. Company Financials
- 12.1.6.4. SWOT Analysis
- 12.1.7 Enterprise Products Partners LP
- 12.1.7.1. Company Overview
- 12.1.7.2. Products
- 12.1.7.3. Company Financials
- 12.1.7.4. SWOT Analysis
- 12.1.8 Energy Transfer Operating LP
- 12.1.8.1. Company Overview
- 12.1.8.2. Products
- 12.1.8.3. Company Financials
- 12.1.8.4. SWOT Analysis
- 12.1.9 ONEOK Gas Transportation LLC
- 12.1.9.1. Company Overview
- 12.1.9.2. Products
- 12.1.9.3. Company Financials
- 12.1.9.4. SWOT Analysis
- 12.1.10 Plains All American Pipeline LP
- 12.1.10.1. Company Overview
- 12.1.10.2. Products
- 12.1.10.3. Company Financials
- 12.1.10.4. SWOT Analysis
- 12.1.11 Kinder Morgan Inc
- 12.1.11.1. Company Overview
- 12.1.11.2. Products
- 12.1.11.3. Company Financials
- 12.1.11.4. SWOT Analysis
- 12.1.1 Williams Companies Inc
- 12.2. Market Entropy
- 12.2.1 Company's Key Areas Served
- 12.2.2 Recent Developments
- 12.3. Company Market Share Analysis 2025
- 12.3.1 Top 5 Companies Market Share Analysis
- 12.3.2 Top 3 Companies Market Share Analysis
- 12.4. List of Potential Customers
- 13. Research Methodology
List of Figures
- Figure 1: Global US Oil and Gas Midstream Market Revenue Breakdown (billion, %) by Region 2025 & 2033
- Figure 2: North America US Oil and Gas Midstream Market Revenue (billion), by Transportation 2025 & 2033
- Figure 3: North America US Oil and Gas Midstream Market Revenue Share (%), by Transportation 2025 & 2033
- Figure 4: North America US Oil and Gas Midstream Market Revenue (billion), by Storage 2025 & 2033
- Figure 5: North America US Oil and Gas Midstream Market Revenue Share (%), by Storage 2025 & 2033
- Figure 6: North America US Oil and Gas Midstream Market Revenue (billion), by LNG Terminals 2025 & 2033
- Figure 7: North America US Oil and Gas Midstream Market Revenue Share (%), by LNG Terminals 2025 & 2033
- Figure 8: North America US Oil and Gas Midstream Market Revenue (billion), by Country 2025 & 2033
- Figure 9: North America US Oil and Gas Midstream Market Revenue Share (%), by Country 2025 & 2033
- Figure 10: South America US Oil and Gas Midstream Market Revenue (billion), by Transportation 2025 & 2033
- Figure 11: South America US Oil and Gas Midstream Market Revenue Share (%), by Transportation 2025 & 2033
- Figure 12: South America US Oil and Gas Midstream Market Revenue (billion), by Storage 2025 & 2033
- Figure 13: South America US Oil and Gas Midstream Market Revenue Share (%), by Storage 2025 & 2033
- Figure 14: South America US Oil and Gas Midstream Market Revenue (billion), by LNG Terminals 2025 & 2033
- Figure 15: South America US Oil and Gas Midstream Market Revenue Share (%), by LNG Terminals 2025 & 2033
- Figure 16: South America US Oil and Gas Midstream Market Revenue (billion), by Country 2025 & 2033
- Figure 17: South America US Oil and Gas Midstream Market Revenue Share (%), by Country 2025 & 2033
- Figure 18: Europe US Oil and Gas Midstream Market Revenue (billion), by Transportation 2025 & 2033
- Figure 19: Europe US Oil and Gas Midstream Market Revenue Share (%), by Transportation 2025 & 2033
- Figure 20: Europe US Oil and Gas Midstream Market Revenue (billion), by Storage 2025 & 2033
- Figure 21: Europe US Oil and Gas Midstream Market Revenue Share (%), by Storage 2025 & 2033
- Figure 22: Europe US Oil and Gas Midstream Market Revenue (billion), by LNG Terminals 2025 & 2033
- Figure 23: Europe US Oil and Gas Midstream Market Revenue Share (%), by LNG Terminals 2025 & 2033
- Figure 24: Europe US Oil and Gas Midstream Market Revenue (billion), by Country 2025 & 2033
- Figure 25: Europe US Oil and Gas Midstream Market Revenue Share (%), by Country 2025 & 2033
- Figure 26: Middle East & Africa US Oil and Gas Midstream Market Revenue (billion), by Transportation 2025 & 2033
- Figure 27: Middle East & Africa US Oil and Gas Midstream Market Revenue Share (%), by Transportation 2025 & 2033
- Figure 28: Middle East & Africa US Oil and Gas Midstream Market Revenue (billion), by Storage 2025 & 2033
- Figure 29: Middle East & Africa US Oil and Gas Midstream Market Revenue Share (%), by Storage 2025 & 2033
- Figure 30: Middle East & Africa US Oil and Gas Midstream Market Revenue (billion), by LNG Terminals 2025 & 2033
- Figure 31: Middle East & Africa US Oil and Gas Midstream Market Revenue Share (%), by LNG Terminals 2025 & 2033
- Figure 32: Middle East & Africa US Oil and Gas Midstream Market Revenue (billion), by Country 2025 & 2033
- Figure 33: Middle East & Africa US Oil and Gas Midstream Market Revenue Share (%), by Country 2025 & 2033
- Figure 34: Asia Pacific US Oil and Gas Midstream Market Revenue (billion), by Transportation 2025 & 2033
- Figure 35: Asia Pacific US Oil and Gas Midstream Market Revenue Share (%), by Transportation 2025 & 2033
- Figure 36: Asia Pacific US Oil and Gas Midstream Market Revenue (billion), by Storage 2025 & 2033
- Figure 37: Asia Pacific US Oil and Gas Midstream Market Revenue Share (%), by Storage 2025 & 2033
- Figure 38: Asia Pacific US Oil and Gas Midstream Market Revenue (billion), by LNG Terminals 2025 & 2033
- Figure 39: Asia Pacific US Oil and Gas Midstream Market Revenue Share (%), by LNG Terminals 2025 & 2033
- Figure 40: Asia Pacific US Oil and Gas Midstream Market Revenue (billion), by Country 2025 & 2033
- Figure 41: Asia Pacific US Oil and Gas Midstream Market Revenue Share (%), by Country 2025 & 2033
List of Tables
- Table 1: Global US Oil and Gas Midstream Market Revenue billion Forecast, by Transportation 2020 & 2033
- Table 2: Global US Oil and Gas Midstream Market Revenue billion Forecast, by Storage 2020 & 2033
- Table 3: Global US Oil and Gas Midstream Market Revenue billion Forecast, by LNG Terminals 2020 & 2033
- Table 4: Global US Oil and Gas Midstream Market Revenue billion Forecast, by Region 2020 & 2033
- Table 5: Global US Oil and Gas Midstream Market Revenue billion Forecast, by Transportation 2020 & 2033
- Table 6: Global US Oil and Gas Midstream Market Revenue billion Forecast, by Storage 2020 & 2033
- Table 7: Global US Oil and Gas Midstream Market Revenue billion Forecast, by LNG Terminals 2020 & 2033
- Table 8: Global US Oil and Gas Midstream Market Revenue billion Forecast, by Country 2020 & 2033
- Table 9: United States US Oil and Gas Midstream Market Revenue (billion) Forecast, by Application 2020 & 2033
- Table 10: Canada US Oil and Gas Midstream Market Revenue (billion) Forecast, by Application 2020 & 2033
- Table 11: Mexico US Oil and Gas Midstream Market Revenue (billion) Forecast, by Application 2020 & 2033
- Table 12: Global US Oil and Gas Midstream Market Revenue billion Forecast, by Transportation 2020 & 2033
- Table 13: Global US Oil and Gas Midstream Market Revenue billion Forecast, by Storage 2020 & 2033
- Table 14: Global US Oil and Gas Midstream Market Revenue billion Forecast, by LNG Terminals 2020 & 2033
- Table 15: Global US Oil and Gas Midstream Market Revenue billion Forecast, by Country 2020 & 2033
- Table 16: Brazil US Oil and Gas Midstream Market Revenue (billion) Forecast, by Application 2020 & 2033
- Table 17: Argentina US Oil and Gas Midstream Market Revenue (billion) Forecast, by Application 2020 & 2033
- Table 18: Rest of South America US Oil and Gas Midstream Market Revenue (billion) Forecast, by Application 2020 & 2033
- Table 19: Global US Oil and Gas Midstream Market Revenue billion Forecast, by Transportation 2020 & 2033
- Table 20: Global US Oil and Gas Midstream Market Revenue billion Forecast, by Storage 2020 & 2033
- Table 21: Global US Oil and Gas Midstream Market Revenue billion Forecast, by LNG Terminals 2020 & 2033
- Table 22: Global US Oil and Gas Midstream Market Revenue billion Forecast, by Country 2020 & 2033
- Table 23: United Kingdom US Oil and Gas Midstream Market Revenue (billion) Forecast, by Application 2020 & 2033
- Table 24: Germany US Oil and Gas Midstream Market Revenue (billion) Forecast, by Application 2020 & 2033
- Table 25: France US Oil and Gas Midstream Market Revenue (billion) Forecast, by Application 2020 & 2033
- Table 26: Italy US Oil and Gas Midstream Market Revenue (billion) Forecast, by Application 2020 & 2033
- Table 27: Spain US Oil and Gas Midstream Market Revenue (billion) Forecast, by Application 2020 & 2033
- Table 28: Russia US Oil and Gas Midstream Market Revenue (billion) Forecast, by Application 2020 & 2033
- Table 29: Benelux US Oil and Gas Midstream Market Revenue (billion) Forecast, by Application 2020 & 2033
- Table 30: Nordics US Oil and Gas Midstream Market Revenue (billion) Forecast, by Application 2020 & 2033
- Table 31: Rest of Europe US Oil and Gas Midstream Market Revenue (billion) Forecast, by Application 2020 & 2033
- Table 32: Global US Oil and Gas Midstream Market Revenue billion Forecast, by Transportation 2020 & 2033
- Table 33: Global US Oil and Gas Midstream Market Revenue billion Forecast, by Storage 2020 & 2033
- Table 34: Global US Oil and Gas Midstream Market Revenue billion Forecast, by LNG Terminals 2020 & 2033
- Table 35: Global US Oil and Gas Midstream Market Revenue billion Forecast, by Country 2020 & 2033
- Table 36: Turkey US Oil and Gas Midstream Market Revenue (billion) Forecast, by Application 2020 & 2033
- Table 37: Israel US Oil and Gas Midstream Market Revenue (billion) Forecast, by Application 2020 & 2033
- Table 38: GCC US Oil and Gas Midstream Market Revenue (billion) Forecast, by Application 2020 & 2033
- Table 39: North Africa US Oil and Gas Midstream Market Revenue (billion) Forecast, by Application 2020 & 2033
- Table 40: South Africa US Oil and Gas Midstream Market Revenue (billion) Forecast, by Application 2020 & 2033
- Table 41: Rest of Middle East & Africa US Oil and Gas Midstream Market Revenue (billion) Forecast, by Application 2020 & 2033
- Table 42: Global US Oil and Gas Midstream Market Revenue billion Forecast, by Transportation 2020 & 2033
- Table 43: Global US Oil and Gas Midstream Market Revenue billion Forecast, by Storage 2020 & 2033
- Table 44: Global US Oil and Gas Midstream Market Revenue billion Forecast, by LNG Terminals 2020 & 2033
- Table 45: Global US Oil and Gas Midstream Market Revenue billion Forecast, by Country 2020 & 2033
- Table 46: China US Oil and Gas Midstream Market Revenue (billion) Forecast, by Application 2020 & 2033
- Table 47: India US Oil and Gas Midstream Market Revenue (billion) Forecast, by Application 2020 & 2033
- Table 48: Japan US Oil and Gas Midstream Market Revenue (billion) Forecast, by Application 2020 & 2033
- Table 49: South Korea US Oil and Gas Midstream Market Revenue (billion) Forecast, by Application 2020 & 2033
- Table 50: ASEAN US Oil and Gas Midstream Market Revenue (billion) Forecast, by Application 2020 & 2033
- Table 51: Oceania US Oil and Gas Midstream Market Revenue (billion) Forecast, by Application 2020 & 2033
- Table 52: Rest of Asia Pacific US Oil and Gas Midstream Market Revenue (billion) Forecast, by Application 2020 & 2033
Frequently Asked Questions
1. What is the projected Compound Annual Growth Rate (CAGR) of the US Oil and Gas Midstream Market?
The projected CAGR is approximately 3.2%.
2. Which companies are prominent players in the US Oil and Gas Midstream Market?
Key companies in the market include Williams Companies Inc, Maritimes & Northeast Pipeline, MPLX LP, WhiteWater Midstream Inc, Enbridge Inc, Atlantic Coast Pipeline, Enterprise Products Partners LP, Energy Transfer Operating LP, ONEOK Gas Transportation LLC, Plains All American Pipeline LP, Kinder Morgan Inc.
3. What are the main segments of the US Oil and Gas Midstream Market?
The market segments include Transportation, Storage, LNG Terminals.
4. Can you provide details about the market size?
The market size is estimated to be USD 34 billion as of 2022.
5. What are some drivers contributing to market growth?
An Increase in the Use of LNG as an Energy Source.
6. What are the notable trends driving market growth?
The Transportation Segment Expected to Dominate the Market.
7. Are there any restraints impacting market growth?
Increasing Adoption of Solar and Wind Energy.
8. Can you provide examples of recent developments in the market?
In March 2022, New Fortress Energy Inc. announced the execution of two 20-year sale and purchase agreements (SPA) with Venture Global LNG. Under the agreement, Venture Global will supply 2 million tonnes per annum (MTPA) of LNG on a free on board (FOB) basis from its LNG facilities in Louisiana.
9. What pricing options are available for accessing the report?
Pricing options include single-user, multi-user, and enterprise licenses priced at USD 3800, USD 4500, and USD 5800 respectively.
10. Is the market size provided in terms of value or volume?
The market size is provided in terms of value, measured in billion.
11. Are there any specific market keywords associated with the report?
Yes, the market keyword associated with the report is "US Oil and Gas Midstream Market," which aids in identifying and referencing the specific market segment covered.
12. How do I determine which pricing option suits my needs best?
The pricing options vary based on user requirements and access needs. Individual users may opt for single-user licenses, while businesses requiring broader access may choose multi-user or enterprise licenses for cost-effective access to the report.
13. Are there any additional resources or data provided in the US Oil and Gas Midstream Market report?
While the report offers comprehensive insights, it's advisable to review the specific contents or supplementary materials provided to ascertain if additional resources or data are available.
14. How can I stay updated on further developments or reports in the US Oil and Gas Midstream Market?
To stay informed about further developments, trends, and reports in the US Oil and Gas Midstream Market, consider subscribing to industry newsletters, following relevant companies and organizations, or regularly checking reputable industry news sources and publications.
Methodology
Step 1 - Identification of Relevant Samples Size from Population Database


Step 2 - Approaches for Defining Global Market Size (Value, Volume* & Price*)

Note*: In applicable scenarios
Step 3 - Data Sources
Primary Research
- Web Analytics
- Survey Reports
- Research Institute
- Latest Research Reports
- Opinion Leaders
Secondary Research
- Annual Reports
- White Paper
- Latest Press Release
- Industry Association
- Paid Database
- Investor Presentations

Step 4 - Data Triangulation
Involves using different sources of information in order to increase the validity of a study
These sources are likely to be stakeholders in a program - participants, other researchers, program staff, other community members, and so on.
Then we put all data in single framework & apply various statistical tools to find out the dynamic on the market.
During the analysis stage, feedback from the stakeholder groups would be compared to determine areas of agreement as well as areas of divergence