

Key Insights
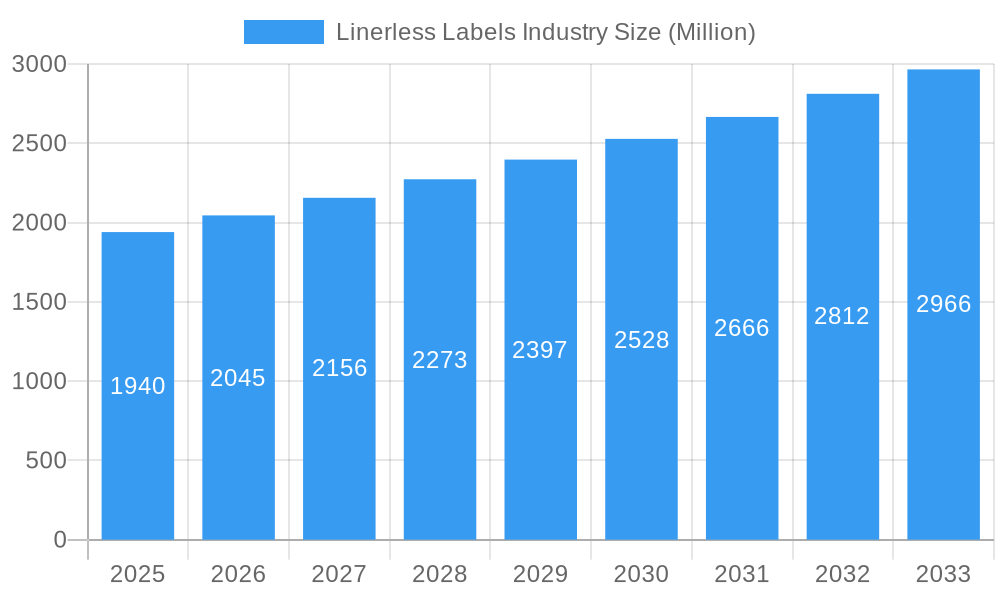
The linerless label market, valued at $1.94 billion in 2025, is projected to experience robust growth, driven by increasing demand for sustainable packaging solutions and the growing adoption of e-commerce. The market's compound annual growth rate (CAGR) of 5.28% from 2025 to 2033 indicates a significant expansion over the forecast period. Key drivers include the rising consumer awareness of environmental issues, leading to a preference for eco-friendly packaging alternatives. Linerless labels, eliminating the need for a release liner, directly contribute to reduced waste and a smaller carbon footprint, making them increasingly attractive to businesses across various sectors. The food and beverage industry, along with healthcare and cosmetics, are major contributors to this market growth, fueled by stringent regulations regarding packaging waste and the need for clear, concise product labeling. Technological advancements in printing technologies like digital printing are further propelling market expansion, enabling high-quality, personalized linerless labels at competitive costs. However, challenges such as the relatively higher initial investment compared to traditional labels and potential compatibility issues with certain dispensing equipment might slightly restrain market growth. Nevertheless, the long-term prospects for linerless labels remain exceptionally positive, given the ongoing global emphasis on sustainability and efficient packaging solutions.
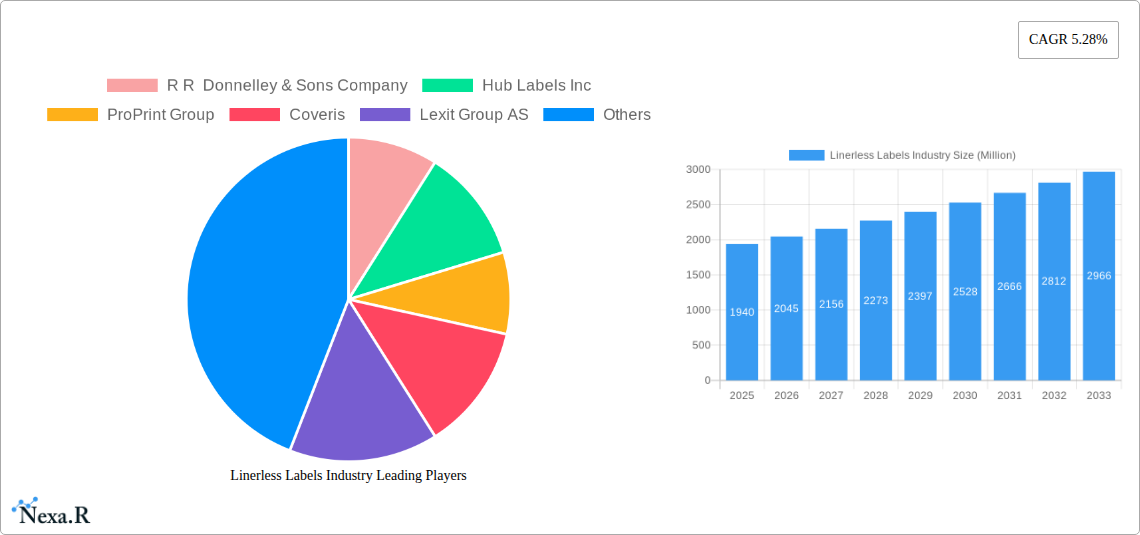
Linerless Labels Industry Market Size (In Billion)
The segment analysis reveals a diverse market landscape. The food and beverage sector is likely the largest end-user segment, followed by healthcare and cosmetics, reflecting the growing importance of clear and concise product labeling in these sensitive industries. Gravure printing remains a dominant technology, although the rise of digital printing is expected to significantly increase its market share during the forecast period due to its versatility and cost-effectiveness for short-run production. Geographically, North America and Europe are currently major markets, but the Asia-Pacific region is anticipated to demonstrate faster growth, driven by increasing industrialization and rising consumer demand. Companies like RR Donnelley & Sons Company, Hub Labels Inc., and others are actively involved in this dynamic market, constantly innovating to meet evolving industry needs and maintain their competitive edge. The competitive landscape is characterized by both large multinational players and specialized regional manufacturers, creating a diverse and dynamic environment.
Linerless Labels Industry Company Market Share
Linerless Labels Industry Market Report: 2019-2033
This comprehensive report provides an in-depth analysis of the Linerless Labels market, encompassing market dynamics, growth trends, regional dominance, product landscape, challenges, opportunities, key players, and notable milestones. The report covers the period 2019-2033, with a base year of 2025 and a forecast period of 2025-2033. The market is segmented by end-user industry (Food, Beverage, Healthcare, Cosmetics, Household, Industrial, Logistics, Other) and printing technology (Gravure, Flexography, Digital, Other). This analysis will be invaluable for industry professionals, investors, and strategic decision-makers seeking to understand and capitalize on the growth potential within this dynamic sector. Market values are presented in Million units.
Linerless Labels Industry Market Dynamics & Structure
The Linerless Labels market exhibits a moderately consolidated structure, with several key players vying for market share. Technological innovation, particularly in printing technologies and adhesive formulations, is a primary growth driver. Stringent regulatory frameworks concerning sustainability and material composition influence market trends. Competitive substitutes include traditional pressure-sensitive labels, but linerless labels offer significant advantages in terms of cost and environmental impact. End-user demographics, especially the increasing demand for sustainable packaging across various industries, heavily influence market growth. M&A activity has been moderate, with strategic partnerships and acquisitions aimed at expanding product portfolios and geographical reach.
- Market Concentration: Moderately consolidated, with top 5 players holding approximately xx% market share in 2024 (estimated).
- Technological Innovation: Focus on improved adhesive technologies, high-speed printing capabilities, and digital printing solutions.
- Regulatory Framework: Growing emphasis on sustainable packaging and reduced waste is driving adoption.
- Competitive Substitutes: Traditional pressure-sensitive labels; however, linerless labels offer cost and environmental advantages.
- M&A Trends: Moderate activity, focused on expansion of product offerings and geographic reach. xx M&A deals recorded between 2019-2024 (estimated).
Linerless Labels Industry Growth Trends & Insights
The Linerless Labels market has witnessed significant growth over the historical period (2019-2024), driven by increasing demand for sustainable and cost-effective packaging solutions. Adoption rates are rising across various end-user industries, fueled by technological advancements and heightened environmental awareness. The market is experiencing a shift towards digital printing technologies, offering greater flexibility and customization. Consumer behavior is increasingly favoring eco-friendly products, further boosting demand for linerless labels. The market is projected to experience a Compound Annual Growth Rate (CAGR) of xx% during the forecast period (2025-2033), reaching a market size of xx Million units by 2033. Market penetration is expected to increase from xx% in 2024 to xx% by 2033.
Dominant Regions, Countries, or Segments in Linerless Labels Industry
The North American and European regions currently dominate the Linerless Labels market, driven by strong demand from the food and beverage, healthcare, and logistics sectors. Within these regions, Germany and the United States are leading countries due to advanced manufacturing capabilities and high consumer demand for sustainable packaging. The Food and Beverage segment holds the largest market share, followed by Healthcare and Logistics. Growth is being driven by factors such as stringent regulations on waste reduction, increasing adoption of automation in packaging lines, and rising consumer preference for eco-friendly products.
- Key Drivers: Stringent environmental regulations, automation in packaging, consumer demand for sustainable packaging, and rising e-commerce.
- Dominant Regions: North America and Europe.
- Leading Segments: Food & Beverage, Healthcare, and Logistics.
- Growth Potential: High growth potential in emerging markets like Asia-Pacific, driven by increasing industrialization and rising disposable incomes.
Linerless Labels Industry Product Landscape
Linerless labels are characterized by their innovative adhesive technologies that ensure strong adhesion without the need for a release liner. Applications span diverse industries, including food and beverage, pharmaceuticals, and cosmetics. Key performance metrics include adhesion strength, printability, and resistance to environmental factors. Unique selling propositions emphasize sustainability, reduced material costs, and enhanced packaging efficiency. Recent technological advancements have focused on developing more sustainable adhesives and improving printing capabilities for high-quality graphics.
Key Drivers, Barriers & Challenges in Linerless Labels Industry
Key Drivers:
- Increasing demand for sustainable packaging.
- Cost reduction opportunities compared to traditional labels.
- Advancements in adhesive and printing technologies.
- Growing e-commerce and need for efficient labeling.
Key Challenges:
- High initial investment in new printing equipment.
- Potential challenges in adhesive performance in various environments.
- Competition from traditional pressure-sensitive labels.
- Supply chain disruptions impacting raw material availability and pricing (estimated impact of xx% on market growth in 2024).
Emerging Opportunities in Linerless Labels Industry
- Untapped Markets: Expanding into emerging economies with growing packaging demand.
- Innovative Applications: Developing specialized linerless labels for niche applications.
- Evolving Consumer Preferences: Meeting the increasing demand for sustainable and customizable packaging.
Growth Accelerators in the Linerless Labels Industry
Technological breakthroughs in adhesive formulations and printing technologies are key growth catalysts. Strategic partnerships between label manufacturers and packaging machinery suppliers enhance market penetration. Aggressive market expansion strategies targeting new geographies and end-user industries further propel growth.
Key Players Shaping the Linerless Labels Industry Market
- R R Donnelley & Sons Company
- Hub Labels Inc
- ProPrint Group
- Coveris
- Lexit Group AS
- Gipako UAB
- Optimum Group
- Skanem AS
- NAStar Inc
- Reflex Labels Ltd
- Innovia Films (CCL Industries)
- SATO Europe GmbH
Notable Milestones in Linerless Labels Industry Sector
- February 2022: ProPrint Group invested almost EUR 1 million in new equipment (Ravenwood Com500 Coater and Edale FL3 flexo press), significantly increasing linerless label production capacity.
- February 2022: Lexit Group partnered with Markem-Imaje (MI) to distribute their products in Norway, Sweden, and Denmark, expanding market reach.
In-Depth Linerless Labels Industry Market Outlook
The Linerless Labels market is poised for sustained growth, driven by ongoing technological advancements, increasing environmental awareness, and the expanding demand for efficient and sustainable packaging solutions. Strategic partnerships and aggressive market expansion will continue to shape the industry landscape, creating lucrative opportunities for established players and new entrants. The focus on sustainable materials and innovative printing technologies will further drive the market's expansion in the coming years.
Linerless Labels Industry Segmentation
-
1. Printing Technology
- 1.1. Gravure
- 1.2. Flexography
- 1.3. Digital
- 1.4. Other Processes of Printing
-
2. End-user Industry
- 2.1. Food
- 2.2. Beverage
- 2.3. Healthcare
- 2.4. Cosmetics
- 2.5. Household
- 2.6. Industrial
- 2.7. Logistics
- 2.8. Other End-user Industries
Linerless Labels Industry Segmentation By Geography
- 1. North America
- 2. Europe
- 3. Asia Pacific
- 4. Latin America
- 5. Middle East and Africa
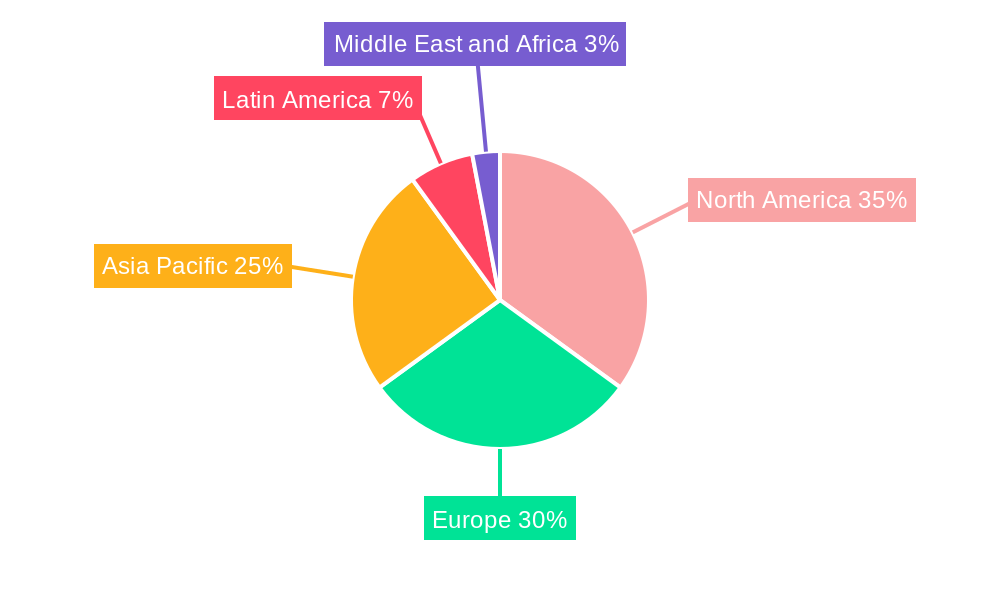
Linerless Labels Industry Regional Market Share
Geographic Coverage of Linerless Labels Industry
Linerless Labels Industry REPORT HIGHLIGHTS
| Aspects | Details |
|---|---|
| Study Period | 2020-2034 |
| Base Year | 2025 |
| Estimated Year | 2026 |
| Forecast Period | 2026-2034 |
| Historical Period | 2020-2025 |
| Growth Rate | CAGR of 5.28% from 2020-2034 |
| Segmentation |
|
Table of Contents
- 1. Introduction
- 1.1. Research Scope
- 1.2. Market Segmentation
- 1.3. Research Objective
- 1.4. Definitions and Assumptions
- 2. Executive Summary
- 2.1. Market Snapshot
- 3. Market Dynamics
- 3.1. Market Drivers
- 3.2. Market Restrains
- 3.3. Market Trends
- 3.4. Market Opportunities
- 4. Market Factor Analysis
- 4.1. Porters Five Forces
- 4.1.1. Bargaining Power of Suppliers
- 4.1.2. Bargaining Power of Buyers
- 4.1.3. Threat of New Entrants
- 4.1.4. Threat of Substitutes
- 4.1.5. Competitive Rivalry
- 4.2. PESTEL analysis
- 4.3. BCG Analysis
- 4.3.1. Stars (High Growth, High Market Share)
- 4.3.2. Cash Cows (Low Growth, High Market Share)
- 4.3.3. Question Mark (High Growth, Low Market Share)
- 4.3.4. Dogs (Low Growth, Low Market Share)
- 4.4. Ansoff Matrix Analysis
- 4.5. Supply Chain Analysis
- 4.6. Regulatory Landscape
- 4.7. Current Market Potential and Opportunity Assessment (TAM–SAM–SOM Framework)
- 4.8. NRP Analyst Note
- 4.1. Porters Five Forces
- 5. Market Analysis, Insights and Forecast 2021-2033
- 5.1. Market Analysis, Insights and Forecast - by Printing Technology
- 5.1.1. Gravure
- 5.1.2. Flexography
- 5.1.3. Digital
- 5.1.4. Other Processes of Printing
- 5.2. Market Analysis, Insights and Forecast - by End-user Industry
- 5.2.1. Food
- 5.2.2. Beverage
- 5.2.3. Healthcare
- 5.2.4. Cosmetics
- 5.2.5. Household
- 5.2.6. Industrial
- 5.2.7. Logistics
- 5.2.8. Other End-user Industries
- 5.3. Market Analysis, Insights and Forecast - by Region
- 5.3.1. North America
- 5.3.2. Europe
- 5.3.3. Asia Pacific
- 5.3.4. Latin America
- 5.3.5. Middle East and Africa
- 5.1. Market Analysis, Insights and Forecast - by Printing Technology
- 6. Global Linerless Labels Industry Analysis, Insights and Forecast, 2021-2033
- 6.1. Market Analysis, Insights and Forecast - by Printing Technology
- 6.1.1. Gravure
- 6.1.2. Flexography
- 6.1.3. Digital
- 6.1.4. Other Processes of Printing
- 6.2. Market Analysis, Insights and Forecast - by End-user Industry
- 6.2.1. Food
- 6.2.2. Beverage
- 6.2.3. Healthcare
- 6.2.4. Cosmetics
- 6.2.5. Household
- 6.2.6. Industrial
- 6.2.7. Logistics
- 6.2.8. Other End-user Industries
- 6.1. Market Analysis, Insights and Forecast - by Printing Technology
- 7. North America Linerless Labels Industry Analysis, Insights and Forecast, 2020-2032
- 7.1. Market Analysis, Insights and Forecast - by Printing Technology
- 7.1.1. Gravure
- 7.1.2. Flexography
- 7.1.3. Digital
- 7.1.4. Other Processes of Printing
- 7.2. Market Analysis, Insights and Forecast - by End-user Industry
- 7.2.1. Food
- 7.2.2. Beverage
- 7.2.3. Healthcare
- 7.2.4. Cosmetics
- 7.2.5. Household
- 7.2.6. Industrial
- 7.2.7. Logistics
- 7.2.8. Other End-user Industries
- 7.1. Market Analysis, Insights and Forecast - by Printing Technology
- 8. Europe Linerless Labels Industry Analysis, Insights and Forecast, 2020-2032
- 8.1. Market Analysis, Insights and Forecast - by Printing Technology
- 8.1.1. Gravure
- 8.1.2. Flexography
- 8.1.3. Digital
- 8.1.4. Other Processes of Printing
- 8.2. Market Analysis, Insights and Forecast - by End-user Industry
- 8.2.1. Food
- 8.2.2. Beverage
- 8.2.3. Healthcare
- 8.2.4. Cosmetics
- 8.2.5. Household
- 8.2.6. Industrial
- 8.2.7. Logistics
- 8.2.8. Other End-user Industries
- 8.1. Market Analysis, Insights and Forecast - by Printing Technology
- 9. Asia Pacific Linerless Labels Industry Analysis, Insights and Forecast, 2020-2032
- 9.1. Market Analysis, Insights and Forecast - by Printing Technology
- 9.1.1. Gravure
- 9.1.2. Flexography
- 9.1.3. Digital
- 9.1.4. Other Processes of Printing
- 9.2. Market Analysis, Insights and Forecast - by End-user Industry
- 9.2.1. Food
- 9.2.2. Beverage
- 9.2.3. Healthcare
- 9.2.4. Cosmetics
- 9.2.5. Household
- 9.2.6. Industrial
- 9.2.7. Logistics
- 9.2.8. Other End-user Industries
- 9.1. Market Analysis, Insights and Forecast - by Printing Technology
- 10. Latin America Linerless Labels Industry Analysis, Insights and Forecast, 2020-2032
- 10.1. Market Analysis, Insights and Forecast - by Printing Technology
- 10.1.1. Gravure
- 10.1.2. Flexography
- 10.1.3. Digital
- 10.1.4. Other Processes of Printing
- 10.2. Market Analysis, Insights and Forecast - by End-user Industry
- 10.2.1. Food
- 10.2.2. Beverage
- 10.2.3. Healthcare
- 10.2.4. Cosmetics
- 10.2.5. Household
- 10.2.6. Industrial
- 10.2.7. Logistics
- 10.2.8. Other End-user Industries
- 10.1. Market Analysis, Insights and Forecast - by Printing Technology
- 11. Middle East and Africa Linerless Labels Industry Analysis, Insights and Forecast, 2020-2032
- 11.1. Market Analysis, Insights and Forecast - by Printing Technology
- 11.1.1. Gravure
- 11.1.2. Flexography
- 11.1.3. Digital
- 11.1.4. Other Processes of Printing
- 11.2. Market Analysis, Insights and Forecast - by End-user Industry
- 11.2.1. Food
- 11.2.2. Beverage
- 11.2.3. Healthcare
- 11.2.4. Cosmetics
- 11.2.5. Household
- 11.2.6. Industrial
- 11.2.7. Logistics
- 11.2.8. Other End-user Industries
- 11.1. Market Analysis, Insights and Forecast - by Printing Technology
- 12. Competitive Analysis
- 12.1. Company Profiles
- 12.1.1 R R Donnelley & Sons Company
- 12.1.1.1. Company Overview
- 12.1.1.2. Products
- 12.1.1.3. Company Financials
- 12.1.1.4. SWOT Analysis
- 12.1.2 Hub Labels Inc
- 12.1.2.1. Company Overview
- 12.1.2.2. Products
- 12.1.2.3. Company Financials
- 12.1.2.4. SWOT Analysis
- 12.1.3 ProPrint Group
- 12.1.3.1. Company Overview
- 12.1.3.2. Products
- 12.1.3.3. Company Financials
- 12.1.3.4. SWOT Analysis
- 12.1.4 Coveris
- 12.1.4.1. Company Overview
- 12.1.4.2. Products
- 12.1.4.3. Company Financials
- 12.1.4.4. SWOT Analysis
- 12.1.5 Lexit Group AS
- 12.1.5.1. Company Overview
- 12.1.5.2. Products
- 12.1.5.3. Company Financials
- 12.1.5.4. SWOT Analysis
- 12.1.6 Gipako UAB*List Not Exhaustive
- 12.1.6.1. Company Overview
- 12.1.6.2. Products
- 12.1.6.3. Company Financials
- 12.1.6.4. SWOT Analysis
- 12.1.7 Optimum Group
- 12.1.7.1. Company Overview
- 12.1.7.2. Products
- 12.1.7.3. Company Financials
- 12.1.7.4. SWOT Analysis
- 12.1.8 Skanem AS
- 12.1.8.1. Company Overview
- 12.1.8.2. Products
- 12.1.8.3. Company Financials
- 12.1.8.4. SWOT Analysis
- 12.1.9 NAStar Inc
- 12.1.9.1. Company Overview
- 12.1.9.2. Products
- 12.1.9.3. Company Financials
- 12.1.9.4. SWOT Analysis
- 12.1.10 Reflex Labels Ltd
- 12.1.10.1. Company Overview
- 12.1.10.2. Products
- 12.1.10.3. Company Financials
- 12.1.10.4. SWOT Analysis
- 12.1.11 Innovia Films (CCL Industries)
- 12.1.11.1. Company Overview
- 12.1.11.2. Products
- 12.1.11.3. Company Financials
- 12.1.11.4. SWOT Analysis
- 12.1.12 SATO Europe GmbH
- 12.1.12.1. Company Overview
- 12.1.12.2. Products
- 12.1.12.3. Company Financials
- 12.1.12.4. SWOT Analysis
- 12.1.1 R R Donnelley & Sons Company
- 12.2. Market Entropy
- 12.2.1 Company's Key Areas Served
- 12.2.2 Recent Developments
- 12.3. Company Market Share Analysis 2025
- 12.3.1 Top 5 Companies Market Share Analysis
- 12.3.2 Top 3 Companies Market Share Analysis
- 12.4. List of Potential Customers
- 13. Research Methodology
List of Figures
- Figure 1: Global Linerless Labels Industry Revenue Breakdown (Million, %) by Region 2025 & 2033
- Figure 2: North America Linerless Labels Industry Revenue (Million), by Printing Technology 2025 & 2033
- Figure 3: North America Linerless Labels Industry Revenue Share (%), by Printing Technology 2025 & 2033
- Figure 4: North America Linerless Labels Industry Revenue (Million), by End-user Industry 2025 & 2033
- Figure 5: North America Linerless Labels Industry Revenue Share (%), by End-user Industry 2025 & 2033
- Figure 6: North America Linerless Labels Industry Revenue (Million), by Country 2025 & 2033
- Figure 7: North America Linerless Labels Industry Revenue Share (%), by Country 2025 & 2033
- Figure 8: Europe Linerless Labels Industry Revenue (Million), by Printing Technology 2025 & 2033
- Figure 9: Europe Linerless Labels Industry Revenue Share (%), by Printing Technology 2025 & 2033
- Figure 10: Europe Linerless Labels Industry Revenue (Million), by End-user Industry 2025 & 2033
- Figure 11: Europe Linerless Labels Industry Revenue Share (%), by End-user Industry 2025 & 2033
- Figure 12: Europe Linerless Labels Industry Revenue (Million), by Country 2025 & 2033
- Figure 13: Europe Linerless Labels Industry Revenue Share (%), by Country 2025 & 2033
- Figure 14: Asia Pacific Linerless Labels Industry Revenue (Million), by Printing Technology 2025 & 2033
- Figure 15: Asia Pacific Linerless Labels Industry Revenue Share (%), by Printing Technology 2025 & 2033
- Figure 16: Asia Pacific Linerless Labels Industry Revenue (Million), by End-user Industry 2025 & 2033
- Figure 17: Asia Pacific Linerless Labels Industry Revenue Share (%), by End-user Industry 2025 & 2033
- Figure 18: Asia Pacific Linerless Labels Industry Revenue (Million), by Country 2025 & 2033
- Figure 19: Asia Pacific Linerless Labels Industry Revenue Share (%), by Country 2025 & 2033
- Figure 20: Latin America Linerless Labels Industry Revenue (Million), by Printing Technology 2025 & 2033
- Figure 21: Latin America Linerless Labels Industry Revenue Share (%), by Printing Technology 2025 & 2033
- Figure 22: Latin America Linerless Labels Industry Revenue (Million), by End-user Industry 2025 & 2033
- Figure 23: Latin America Linerless Labels Industry Revenue Share (%), by End-user Industry 2025 & 2033
- Figure 24: Latin America Linerless Labels Industry Revenue (Million), by Country 2025 & 2033
- Figure 25: Latin America Linerless Labels Industry Revenue Share (%), by Country 2025 & 2033
- Figure 26: Middle East and Africa Linerless Labels Industry Revenue (Million), by Printing Technology 2025 & 2033
- Figure 27: Middle East and Africa Linerless Labels Industry Revenue Share (%), by Printing Technology 2025 & 2033
- Figure 28: Middle East and Africa Linerless Labels Industry Revenue (Million), by End-user Industry 2025 & 2033
- Figure 29: Middle East and Africa Linerless Labels Industry Revenue Share (%), by End-user Industry 2025 & 2033
- Figure 30: Middle East and Africa Linerless Labels Industry Revenue (Million), by Country 2025 & 2033
- Figure 31: Middle East and Africa Linerless Labels Industry Revenue Share (%), by Country 2025 & 2033
List of Tables
- Table 1: Global Linerless Labels Industry Revenue Million Forecast, by Printing Technology 2020 & 2033
- Table 2: Global Linerless Labels Industry Revenue Million Forecast, by End-user Industry 2020 & 2033
- Table 3: Global Linerless Labels Industry Revenue Million Forecast, by Region 2020 & 2033
- Table 4: Global Linerless Labels Industry Revenue Million Forecast, by Printing Technology 2020 & 2033
- Table 5: Global Linerless Labels Industry Revenue Million Forecast, by End-user Industry 2020 & 2033
- Table 6: Global Linerless Labels Industry Revenue Million Forecast, by Country 2020 & 2033
- Table 7: Global Linerless Labels Industry Revenue Million Forecast, by Printing Technology 2020 & 2033
- Table 8: Global Linerless Labels Industry Revenue Million Forecast, by End-user Industry 2020 & 2033
- Table 9: Global Linerless Labels Industry Revenue Million Forecast, by Country 2020 & 2033
- Table 10: Global Linerless Labels Industry Revenue Million Forecast, by Printing Technology 2020 & 2033
- Table 11: Global Linerless Labels Industry Revenue Million Forecast, by End-user Industry 2020 & 2033
- Table 12: Global Linerless Labels Industry Revenue Million Forecast, by Country 2020 & 2033
- Table 13: Global Linerless Labels Industry Revenue Million Forecast, by Printing Technology 2020 & 2033
- Table 14: Global Linerless Labels Industry Revenue Million Forecast, by End-user Industry 2020 & 2033
- Table 15: Global Linerless Labels Industry Revenue Million Forecast, by Country 2020 & 2033
- Table 16: Global Linerless Labels Industry Revenue Million Forecast, by Printing Technology 2020 & 2033
- Table 17: Global Linerless Labels Industry Revenue Million Forecast, by End-user Industry 2020 & 2033
- Table 18: Global Linerless Labels Industry Revenue Million Forecast, by Country 2020 & 2033
Frequently Asked Questions
1. What is the projected Compound Annual Growth Rate (CAGR) of the Linerless Labels Industry?
The projected CAGR is approximately 5.28%.
2. Which companies are prominent players in the Linerless Labels Industry?
Key companies in the market include R R Donnelley & Sons Company, Hub Labels Inc, ProPrint Group, Coveris, Lexit Group AS, Gipako UAB*List Not Exhaustive, Optimum Group, Skanem AS, NAStar Inc, Reflex Labels Ltd, Innovia Films (CCL Industries), SATO Europe GmbH.
3. What are the main segments of the Linerless Labels Industry?
The market segments include Printing Technology, End-user Industry.
4. Can you provide details about the market size?
The market size is estimated to be USD 1.94 Million as of 2022.
5. What are some drivers contributing to market growth?
Increasing Demand for Packaged Foods and Beverages; Increasing Demand for Pharmaceutical Supplies.
6. What are the notable trends driving market growth?
Food and Beverage Expected to Hold the Largest Market Share.
7. Are there any restraints impacting market growth?
Fluctuation in the Prices of Raw Materials.
8. Can you provide examples of recent developments in the market?
Feb 2022 - ProPrintGroup installed a new Ravenwood Com500 Coater. There will also be a new advanced 10-colour EdaleFL3 flexo press. As a result, ProPrint'sLinerless Labels segment now has a total investment of almost EUR 1 million. ProPrintwill becomes a first-class Linerless Labels provider as a result of the transfer, which will greatly increase Linerless Labeling capacity.
9. What pricing options are available for accessing the report?
Pricing options include single-user, multi-user, and enterprise licenses priced at USD 4750, USD 5250, and USD 8750 respectively.
10. Is the market size provided in terms of value or volume?
The market size is provided in terms of value, measured in Million.
11. Are there any specific market keywords associated with the report?
Yes, the market keyword associated with the report is "Linerless Labels Industry," which aids in identifying and referencing the specific market segment covered.
12. How do I determine which pricing option suits my needs best?
The pricing options vary based on user requirements and access needs. Individual users may opt for single-user licenses, while businesses requiring broader access may choose multi-user or enterprise licenses for cost-effective access to the report.
13. Are there any additional resources or data provided in the Linerless Labels Industry report?
While the report offers comprehensive insights, it's advisable to review the specific contents or supplementary materials provided to ascertain if additional resources or data are available.
14. How can I stay updated on further developments or reports in the Linerless Labels Industry?
To stay informed about further developments, trends, and reports in the Linerless Labels Industry, consider subscribing to industry newsletters, following relevant companies and organizations, or regularly checking reputable industry news sources and publications.
Methodology
Step 1 - Identification of Relevant Samples Size from Population Database


Step 2 - Approaches for Defining Global Market Size (Value, Volume* & Price*)

Note*: In applicable scenarios
Step 3 - Data Sources
Primary Research
- Web Analytics
- Survey Reports
- Research Institute
- Latest Research Reports
- Opinion Leaders
Secondary Research
- Annual Reports
- White Paper
- Latest Press Release
- Industry Association
- Paid Database
- Investor Presentations

Step 4 - Data Triangulation
Involves using different sources of information in order to increase the validity of a study
These sources are likely to be stakeholders in a program - participants, other researchers, program staff, other community members, and so on.
Then we put all data in single framework & apply various statistical tools to find out the dynamic on the market.
During the analysis stage, feedback from the stakeholder groups would be compared to determine areas of agreement as well as areas of divergence