

Key Insights
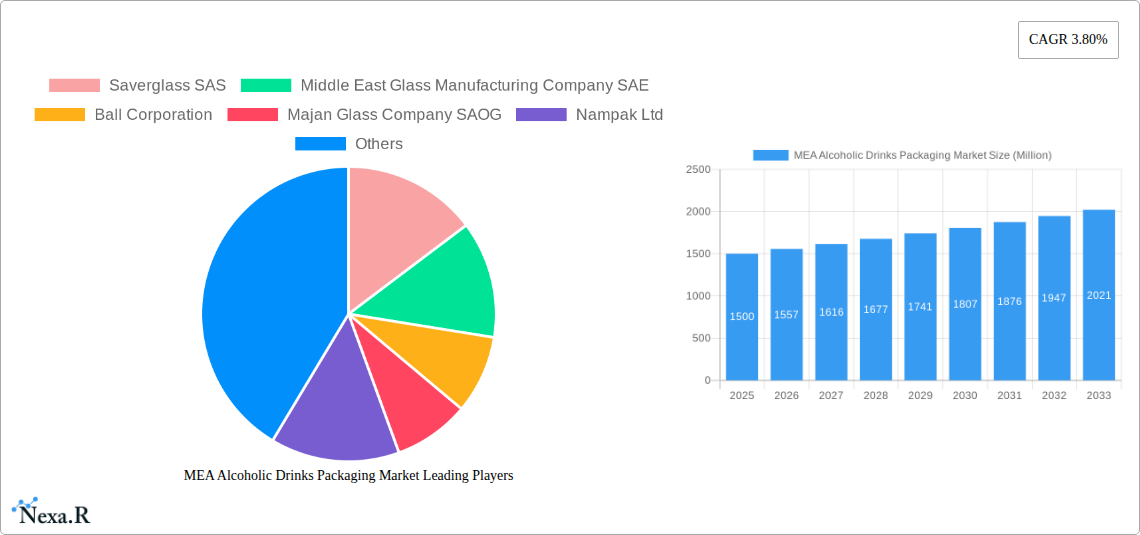
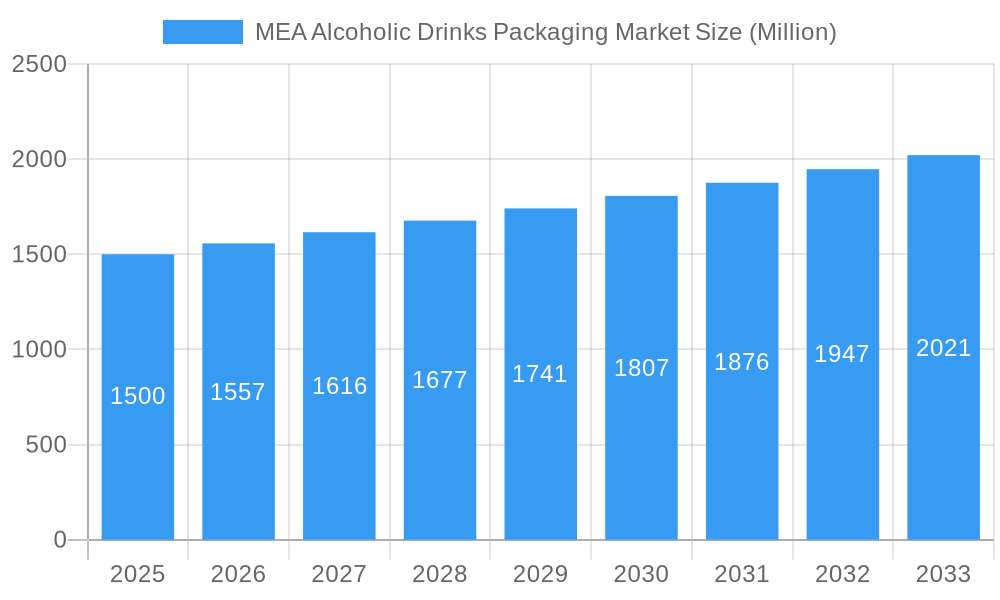
The Middle East and Africa (MEA) alcoholic drinks packaging market is poised for robust expansion, forecasting a Compound Annual Growth Rate (CAGR) of 5.8% from 2025 to 2033. This growth is propelled by rising disposable incomes and an expanding middle class across MEA nations, driving increased alcohol consumption and, consequently, higher demand for sophisticated packaging solutions. Evolving consumer preferences for premium, convenient, and sustainable packaging formats, including lightweight and recyclable options, are significantly shaping market trends. The surging popularity of craft beers and premium spirits, which often necessitate distinctive branding through premium packaging, further fuels this market. Substantial investments in beverage industry infrastructure and advanced packaging technologies within the region are also key drivers. However, stringent regulations concerning alcohol consumption and distribution in certain MEA countries present a notable restraint. Intense competition and the imperative for companies to innovate with sustainable packaging will continue to mold the market landscape. The market is segmented by primary material (glass, metal, plastic, paper), alcoholic product (wine, spirits, beer, other), product type (bottles, cans, other), and country (UAE, South Africa, Egypt, Turkey, Rest of MEA). While glass currently dominates, demand for sustainable alternatives like recycled plastic and paper-based packaging is escalating. The market size is projected to reach 78.63 billion by 2033, with 2025 as the base year.
MEA Alcoholic Drinks Packaging Market Market Size (In Billion)
The competitive arena features a blend of international and regional enterprises. Leading global entities, including Ball Corporation and Crown Holdings Inc., compete with established regional players such as Middle East Glass Manufacturing Company SAE and Majan Glass Company SAOG. Success in this market hinges on adapting to dynamic consumer needs and regulatory frameworks. The forecast period (2025-2033) anticipates further market consolidation and strategic alliances as companies aim to increase market share and leverage emerging opportunities within the MEA alcoholic drinks packaging sector. Future market trajectory will be largely influenced by economic growth, shifts in consumer behavior, and evolving regulatory landscapes across individual countries in the region.
MEA Alcoholic Drinks Packaging Market Company Market Share
MEA Alcoholic Drinks Packaging Market: A Comprehensive Market Report (2019-2033)
This in-depth report provides a comprehensive analysis of the Middle East and Africa (MEA) alcoholic drinks packaging market, encompassing market dynamics, growth trends, regional dominance, product landscape, key players, and future outlook. The study covers the period from 2019 to 2033, with 2025 as the base year and a forecast period from 2025 to 2033. The report segments the market by primary material (glass, metal, plastic, paper), alcoholic product (wine, spirits, beer, other), product type (bottles, cans, etc.), and country (UAE, South Africa, Egypt, Turkey, Rest of MEA). The market size is presented in million units.
MEA Alcoholic Drinks Packaging Market Dynamics & Structure
This section delves into the intricate dynamics shaping the MEA alcoholic drinks packaging market. We analyze market concentration, revealing the dominance of key players and the level of competition. Technological innovations, such as sustainable packaging solutions and lightweight materials, are examined for their impact on market growth. The report also assesses the regulatory landscape, including environmental regulations and labeling requirements, and their influence on packaging choices. Furthermore, we explore the competitive landscape, including the availability of substitute products and their market share. Finally, we scrutinize the demographics of end-users and the impact of evolving consumer preferences on packaging demand, concluding with an overview of M&A activities and their effect on the market's structure.
- Market Concentration: xx% dominated by top 5 players (estimated).
- Technological Innovation: Focus on sustainability (lightweighting, recycled materials) driving innovation.
- Regulatory Framework: Stringent environmental regulations impacting material choices.
- Competitive Substitutes: Growing adoption of sustainable alternatives impacting traditional materials.
- End-User Demographics: Shifting consumer preferences towards premiumization and convenience.
- M&A Trends: xx M&A deals recorded in the last 5 years (estimated), predominantly focused on consolidation and expansion.
MEA Alcoholic Drinks Packaging Market Growth Trends & Insights
This section presents a comprehensive analysis of the MEA alcoholic drinks packaging market's growth trajectory. Utilizing rigorous data analysis, we illustrate the market size evolution from 2019 to 2024 and project its expansion until 2033. Key metrics such as the Compound Annual Growth Rate (CAGR) and market penetration rates are meticulously presented. Technological disruptions, including the emergence of innovative packaging materials and technologies, are thoroughly examined. We also explore shifts in consumer behavior, including the increasing demand for sustainable and convenient packaging, and their influence on market growth. The analysis also assesses the impact of macroeconomic factors and changing lifestyle preferences on packaging adoption rates.
- Market Size (Million Units): 2019: xx; 2024: xx; 2025: xx; 2033: xx (Projected)
- CAGR (2025-2033): xx%
- Market Penetration: xx% in 2024 (estimated), projected to reach xx% by 2033.
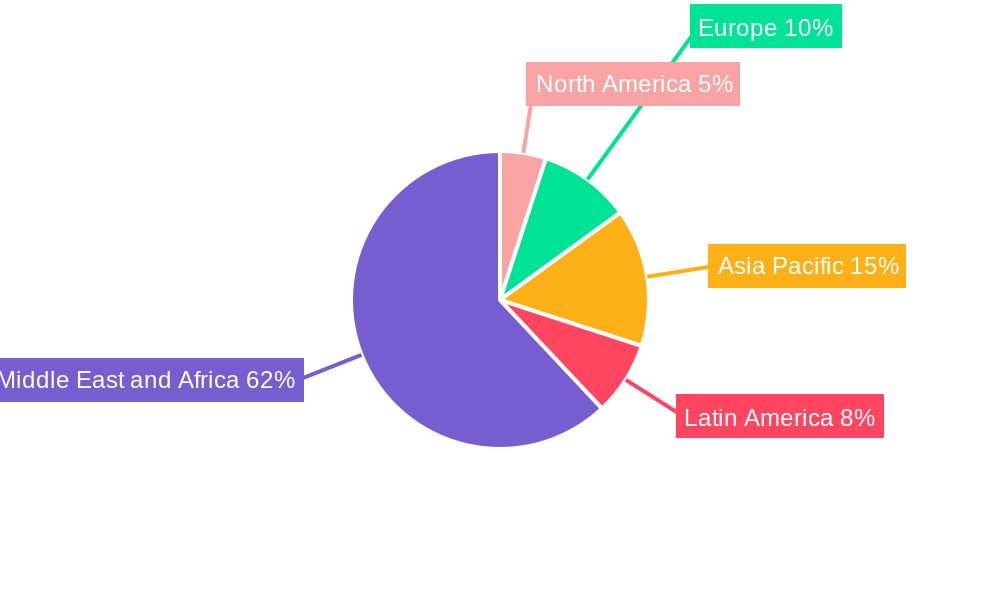
Dominant Regions, Countries, or Segments in MEA Alcoholic Drinks Packaging Market
This section pinpoints the leading regions, countries, and segments within the MEA alcoholic drinks packaging market that are driving significant growth. A detailed analysis reveals the factors contributing to their dominance, including economic policies, infrastructure development, and consumer behavior. Market share and growth potential for each leading segment (by primary material, alcoholic product, product type, and country) are thoroughly evaluated.
- Dominant Region: UAE (estimated highest market share).
- Leading Country: UAE (High per capita consumption of alcoholic beverages).
- Leading Segment (By Primary Material): Glass (Traditional preference and perceived quality).
- Leading Segment (By Alcoholic Product): Spirits (Higher value and premium packaging demand).
- Leading Segment (By Product Type): Glass Bottles (Established preference for premium alcoholic beverages).
- Growth Drivers: Increasing disposable income, tourism, expanding hospitality sector.
MEA Alcoholic Drinks Packaging Market Product Landscape
This section provides a concise overview of product innovations, applications, and performance metrics within the MEA alcoholic drinks packaging market. We highlight unique selling propositions, focusing on sustainability features, lightweight designs, and improved barrier properties. Technological advancements such as smart packaging and innovative closure systems are discussed.
The market showcases a diverse range of products, from traditional glass bottles to innovative sustainable alternatives like lightweight aluminum cans and biodegradable plastic options. Continuous innovation focuses on enhanced barrier properties, improved shelf life, and reduced environmental impact. Key features driving adoption include increased convenience, enhanced branding opportunities, and improved consumer experience.
Key Drivers, Barriers & Challenges in MEA Alcoholic Drinks Packaging Market
This section outlines the key factors driving market growth and the challenges hindering its expansion.
Key Drivers:
- Increasing disposable incomes and changing lifestyles leading to higher alcoholic beverage consumption.
- Tourism and the hospitality industry driving demand for premium packaging.
- Growing focus on sustainability and eco-friendly packaging solutions.
Challenges and Restraints:
- Fluctuations in raw material prices impacting production costs.
- Stringent environmental regulations and their compliance costs.
- Intense competition among packaging manufacturers.
- Supply chain disruptions impacting timely delivery and availability.
Emerging Opportunities in MEA Alcoholic Drinks Packaging Market
This section highlights promising opportunities for growth within the MEA alcoholic drinks packaging market.
- Growing demand for premium and customized packaging solutions.
- Increasing adoption of sustainable and eco-friendly packaging materials.
- Expansion into untapped markets within the MEA region.
- Emerging opportunities in e-commerce and online alcohol delivery.
Growth Accelerators in the MEA Alcoholic Drinks Packaging Market Industry
Technological advancements, strategic partnerships, and market expansion strategies are key catalysts for long-term growth in the MEA alcoholic drinks packaging market. Innovation in sustainable materials, such as lightweight aluminum and biodegradable plastics, will drive adoption. Strategic collaborations between packaging manufacturers and alcoholic beverage producers will foster the development of customized and efficient packaging solutions. Furthermore, expanding into untapped markets within the MEA region will unlock significant growth potential.
Key Players Shaping the MEA Alcoholic Drinks Packaging Market Market
- Saverglass SAS
- Middle East Glass Manufacturing Company SAE
- Ball Corporation
- Majan Glass Company SAOG
- Nampak Ltd
- The National Company For Glass Industries (Zouja)
- Crown Holdings Inc
- Can-Pack S.A.
- Saudi Arabian Glass Co Ltd
- Huhtamäki Oyj
- Bonpak (Pty) Ltd
- Consol Glass Ltd
Notable Milestones in MEA Alcoholic Drinks Packaging Market Sector
- August 2021: Huhtamäki Oyj acquired Elif Holding AŞ, expanding its presence in Turkey and Egypt and strengthening its sustainability initiatives. This acquisition significantly impacts the market by introducing a wider range of sustainable packaging options.
- August 2021: Ball Corporation's focus on aluminum as a sustainable alternative to plastic signifies a significant shift towards environmentally friendly packaging materials, influencing market trends towards reduced plastic usage.
In-Depth MEA Alcoholic Drinks Packaging Market Market Outlook
The MEA alcoholic drinks packaging market is poised for robust growth driven by rising consumer demand, increasing disposable incomes, and a surge in tourism. The focus on sustainability and eco-friendly packaging options will continue to shape market dynamics. Strategic partnerships and technological advancements will further enhance market competitiveness. Companies focusing on innovation and sustainability are expected to gain a significant competitive edge in this rapidly evolving market, presenting lucrative opportunities for growth and expansion.
MEA Alcoholic Drinks Packaging Market Segmentation
-
1. Primary Material
- 1.1. Glass
- 1.2. Metal
- 1.3. Plastic
- 1.4. Paper
-
2. Alcoholic Products
- 2.1. Wine
- 2.2. Spirits
- 2.3. Beer
- 2.4. Other Types of Alcoholic Beverages
-
3. Product Type
- 3.1. Glass Bottles
- 3.2. Metal Cans
- 3.3. Plastic Bottles
- 3.4. Other Product Types
MEA Alcoholic Drinks Packaging Market Segmentation By Geography
-
1. North America
- 1.1. United States
- 1.2. Canada
- 1.3. Mexico
-
2. South America
- 2.1. Brazil
- 2.2. Argentina
- 2.3. Rest of South America
-
3. Europe
- 3.1. United Kingdom
- 3.2. Germany
- 3.3. France
- 3.4. Italy
- 3.5. Spain
- 3.6. Russia
- 3.7. Benelux
- 3.8. Nordics
- 3.9. Rest of Europe
-
4. Middle East & Africa
- 4.1. Turkey
- 4.2. Israel
- 4.3. GCC
- 4.4. North Africa
- 4.5. South Africa
- 4.6. Rest of Middle East & Africa
-
5. Asia Pacific
- 5.1. China
- 5.2. India
- 5.3. Japan
- 5.4. South Korea
- 5.5. ASEAN
- 5.6. Oceania
- 5.7. Rest of Asia Pacific
MEA Alcoholic Drinks Packaging Market Regional Market Share
Geographic Coverage of MEA Alcoholic Drinks Packaging Market
MEA Alcoholic Drinks Packaging Market REPORT HIGHLIGHTS
| Aspects | Details |
|---|---|
| Study Period | 2020-2034 |
| Base Year | 2025 |
| Estimated Year | 2026 |
| Forecast Period | 2026-2034 |
| Historical Period | 2020-2025 |
| Growth Rate | CAGR of 5.8% from 2020-2034 |
| Segmentation |
|
Table of Contents
- 1. Introduction
- 1.1. Research Scope
- 1.2. Market Segmentation
- 1.3. Research Objective
- 1.4. Definitions and Assumptions
- 2. Executive Summary
- 2.1. Market Snapshot
- 3. Market Dynamics
- 3.1. Market Drivers
- 3.2. Market Restrains
- 3.3. Market Trends
- 3.4. Market Opportunities
- 4. Market Factor Analysis
- 4.1. Porters Five Forces
- 4.1.1. Bargaining Power of Suppliers
- 4.1.2. Bargaining Power of Buyers
- 4.1.3. Threat of New Entrants
- 4.1.4. Threat of Substitutes
- 4.1.5. Competitive Rivalry
- 4.2. PESTEL analysis
- 4.3. BCG Analysis
- 4.3.1. Stars (High Growth, High Market Share)
- 4.3.2. Cash Cows (Low Growth, High Market Share)
- 4.3.3. Question Mark (High Growth, Low Market Share)
- 4.3.4. Dogs (Low Growth, Low Market Share)
- 4.4. Ansoff Matrix Analysis
- 4.5. Supply Chain Analysis
- 4.6. Regulatory Landscape
- 4.7. Current Market Potential and Opportunity Assessment (TAM–SAM–SOM Framework)
- 4.8. NRP Analyst Note
- 4.1. Porters Five Forces
- 5. Market Analysis, Insights and Forecast 2021-2033
- 5.1. Market Analysis, Insights and Forecast - by Primary Material
- 5.1.1. Glass
- 5.1.2. Metal
- 5.1.3. Plastic
- 5.1.4. Paper
- 5.2. Market Analysis, Insights and Forecast - by Alcoholic Products
- 5.2.1. Wine
- 5.2.2. Spirits
- 5.2.3. Beer
- 5.2.4. Other Types of Alcoholic Beverages
- 5.3. Market Analysis, Insights and Forecast - by Product Type
- 5.3.1. Glass Bottles
- 5.3.2. Metal Cans
- 5.3.3. Plastic Bottles
- 5.3.4. Other Product Types
- 5.4. Market Analysis, Insights and Forecast - by Region
- 5.4.1. North America
- 5.4.2. South America
- 5.4.3. Europe
- 5.4.4. Middle East & Africa
- 5.4.5. Asia Pacific
- 5.1. Market Analysis, Insights and Forecast - by Primary Material
- 6. Global MEA Alcoholic Drinks Packaging Market Analysis, Insights and Forecast, 2021-2033
- 6.1. Market Analysis, Insights and Forecast - by Primary Material
- 6.1.1. Glass
- 6.1.2. Metal
- 6.1.3. Plastic
- 6.1.4. Paper
- 6.2. Market Analysis, Insights and Forecast - by Alcoholic Products
- 6.2.1. Wine
- 6.2.2. Spirits
- 6.2.3. Beer
- 6.2.4. Other Types of Alcoholic Beverages
- 6.3. Market Analysis, Insights and Forecast - by Product Type
- 6.3.1. Glass Bottles
- 6.3.2. Metal Cans
- 6.3.3. Plastic Bottles
- 6.3.4. Other Product Types
- 6.1. Market Analysis, Insights and Forecast - by Primary Material
- 7. North America MEA Alcoholic Drinks Packaging Market Analysis, Insights and Forecast, 2020-2032
- 7.1. Market Analysis, Insights and Forecast - by Primary Material
- 7.1.1. Glass
- 7.1.2. Metal
- 7.1.3. Plastic
- 7.1.4. Paper
- 7.2. Market Analysis, Insights and Forecast - by Alcoholic Products
- 7.2.1. Wine
- 7.2.2. Spirits
- 7.2.3. Beer
- 7.2.4. Other Types of Alcoholic Beverages
- 7.3. Market Analysis, Insights and Forecast - by Product Type
- 7.3.1. Glass Bottles
- 7.3.2. Metal Cans
- 7.3.3. Plastic Bottles
- 7.3.4. Other Product Types
- 7.1. Market Analysis, Insights and Forecast - by Primary Material
- 8. South America MEA Alcoholic Drinks Packaging Market Analysis, Insights and Forecast, 2020-2032
- 8.1. Market Analysis, Insights and Forecast - by Primary Material
- 8.1.1. Glass
- 8.1.2. Metal
- 8.1.3. Plastic
- 8.1.4. Paper
- 8.2. Market Analysis, Insights and Forecast - by Alcoholic Products
- 8.2.1. Wine
- 8.2.2. Spirits
- 8.2.3. Beer
- 8.2.4. Other Types of Alcoholic Beverages
- 8.3. Market Analysis, Insights and Forecast - by Product Type
- 8.3.1. Glass Bottles
- 8.3.2. Metal Cans
- 8.3.3. Plastic Bottles
- 8.3.4. Other Product Types
- 8.1. Market Analysis, Insights and Forecast - by Primary Material
- 9. Europe MEA Alcoholic Drinks Packaging Market Analysis, Insights and Forecast, 2020-2032
- 9.1. Market Analysis, Insights and Forecast - by Primary Material
- 9.1.1. Glass
- 9.1.2. Metal
- 9.1.3. Plastic
- 9.1.4. Paper
- 9.2. Market Analysis, Insights and Forecast - by Alcoholic Products
- 9.2.1. Wine
- 9.2.2. Spirits
- 9.2.3. Beer
- 9.2.4. Other Types of Alcoholic Beverages
- 9.3. Market Analysis, Insights and Forecast - by Product Type
- 9.3.1. Glass Bottles
- 9.3.2. Metal Cans
- 9.3.3. Plastic Bottles
- 9.3.4. Other Product Types
- 9.1. Market Analysis, Insights and Forecast - by Primary Material
- 10. Middle East & Africa MEA Alcoholic Drinks Packaging Market Analysis, Insights and Forecast, 2020-2032
- 10.1. Market Analysis, Insights and Forecast - by Primary Material
- 10.1.1. Glass
- 10.1.2. Metal
- 10.1.3. Plastic
- 10.1.4. Paper
- 10.2. Market Analysis, Insights and Forecast - by Alcoholic Products
- 10.2.1. Wine
- 10.2.2. Spirits
- 10.2.3. Beer
- 10.2.4. Other Types of Alcoholic Beverages
- 10.3. Market Analysis, Insights and Forecast - by Product Type
- 10.3.1. Glass Bottles
- 10.3.2. Metal Cans
- 10.3.3. Plastic Bottles
- 10.3.4. Other Product Types
- 10.1. Market Analysis, Insights and Forecast - by Primary Material
- 11. Asia Pacific MEA Alcoholic Drinks Packaging Market Analysis, Insights and Forecast, 2020-2032
- 11.1. Market Analysis, Insights and Forecast - by Primary Material
- 11.1.1. Glass
- 11.1.2. Metal
- 11.1.3. Plastic
- 11.1.4. Paper
- 11.2. Market Analysis, Insights and Forecast - by Alcoholic Products
- 11.2.1. Wine
- 11.2.2. Spirits
- 11.2.3. Beer
- 11.2.4. Other Types of Alcoholic Beverages
- 11.3. Market Analysis, Insights and Forecast - by Product Type
- 11.3.1. Glass Bottles
- 11.3.2. Metal Cans
- 11.3.3. Plastic Bottles
- 11.3.4. Other Product Types
- 11.1. Market Analysis, Insights and Forecast - by Primary Material
- 12. Competitive Analysis
- 12.1. Company Profiles
- 12.1.1 Saverglass SAS
- 12.1.1.1. Company Overview
- 12.1.1.2. Products
- 12.1.1.3. Company Financials
- 12.1.1.4. SWOT Analysis
- 12.1.2 Middle East Glass Manufacturing Company SAE
- 12.1.2.1. Company Overview
- 12.1.2.2. Products
- 12.1.2.3. Company Financials
- 12.1.2.4. SWOT Analysis
- 12.1.3 Ball Corporation
- 12.1.3.1. Company Overview
- 12.1.3.2. Products
- 12.1.3.3. Company Financials
- 12.1.3.4. SWOT Analysis
- 12.1.4 Majan Glass Company SAOG
- 12.1.4.1. Company Overview
- 12.1.4.2. Products
- 12.1.4.3. Company Financials
- 12.1.4.4. SWOT Analysis
- 12.1.5 Nampak Ltd
- 12.1.5.1. Company Overview
- 12.1.5.2. Products
- 12.1.5.3. Company Financials
- 12.1.5.4. SWOT Analysis
- 12.1.6 The National Company For Glass Industries (Zouja)
- 12.1.6.1. Company Overview
- 12.1.6.2. Products
- 12.1.6.3. Company Financials
- 12.1.6.4. SWOT Analysis
- 12.1.7 Crown Holdings Inc
- 12.1.7.1. Company Overview
- 12.1.7.2. Products
- 12.1.7.3. Company Financials
- 12.1.7.4. SWOT Analysis
- 12.1.8 Can-Pack S
- 12.1.8.1. Company Overview
- 12.1.8.2. Products
- 12.1.8.3. Company Financials
- 12.1.8.4. SWOT Analysis
- 12.1.9 Saudi Arabian Glass Co Ltd
- 12.1.9.1. Company Overview
- 12.1.9.2. Products
- 12.1.9.3. Company Financials
- 12.1.9.4. SWOT Analysis
- 12.1.10 Huhtamäki Oyj
- 12.1.10.1. Company Overview
- 12.1.10.2. Products
- 12.1.10.3. Company Financials
- 12.1.10.4. SWOT Analysis
- 12.1.11 Bonpak (Pty) Ltd
- 12.1.11.1. Company Overview
- 12.1.11.2. Products
- 12.1.11.3. Company Financials
- 12.1.11.4. SWOT Analysis
- 12.1.12 Consol Glass Ltd
- 12.1.12.1. Company Overview
- 12.1.12.2. Products
- 12.1.12.3. Company Financials
- 12.1.12.4. SWOT Analysis
- 12.1.1 Saverglass SAS
- 12.2. Market Entropy
- 12.2.1 Company's Key Areas Served
- 12.2.2 Recent Developments
- 12.3. Company Market Share Analysis 2025
- 12.3.1 Top 5 Companies Market Share Analysis
- 12.3.2 Top 3 Companies Market Share Analysis
- 12.4. List of Potential Customers
- 13. Research Methodology
List of Figures
- Figure 1: Global MEA Alcoholic Drinks Packaging Market Revenue Breakdown (billion, %) by Region 2025 & 2033
- Figure 2: North America MEA Alcoholic Drinks Packaging Market Revenue (billion), by Primary Material 2025 & 2033
- Figure 3: North America MEA Alcoholic Drinks Packaging Market Revenue Share (%), by Primary Material 2025 & 2033
- Figure 4: North America MEA Alcoholic Drinks Packaging Market Revenue (billion), by Alcoholic Products 2025 & 2033
- Figure 5: North America MEA Alcoholic Drinks Packaging Market Revenue Share (%), by Alcoholic Products 2025 & 2033
- Figure 6: North America MEA Alcoholic Drinks Packaging Market Revenue (billion), by Product Type 2025 & 2033
- Figure 7: North America MEA Alcoholic Drinks Packaging Market Revenue Share (%), by Product Type 2025 & 2033
- Figure 8: North America MEA Alcoholic Drinks Packaging Market Revenue (billion), by Country 2025 & 2033
- Figure 9: North America MEA Alcoholic Drinks Packaging Market Revenue Share (%), by Country 2025 & 2033
- Figure 10: South America MEA Alcoholic Drinks Packaging Market Revenue (billion), by Primary Material 2025 & 2033
- Figure 11: South America MEA Alcoholic Drinks Packaging Market Revenue Share (%), by Primary Material 2025 & 2033
- Figure 12: South America MEA Alcoholic Drinks Packaging Market Revenue (billion), by Alcoholic Products 2025 & 2033
- Figure 13: South America MEA Alcoholic Drinks Packaging Market Revenue Share (%), by Alcoholic Products 2025 & 2033
- Figure 14: South America MEA Alcoholic Drinks Packaging Market Revenue (billion), by Product Type 2025 & 2033
- Figure 15: South America MEA Alcoholic Drinks Packaging Market Revenue Share (%), by Product Type 2025 & 2033
- Figure 16: South America MEA Alcoholic Drinks Packaging Market Revenue (billion), by Country 2025 & 2033
- Figure 17: South America MEA Alcoholic Drinks Packaging Market Revenue Share (%), by Country 2025 & 2033
- Figure 18: Europe MEA Alcoholic Drinks Packaging Market Revenue (billion), by Primary Material 2025 & 2033
- Figure 19: Europe MEA Alcoholic Drinks Packaging Market Revenue Share (%), by Primary Material 2025 & 2033
- Figure 20: Europe MEA Alcoholic Drinks Packaging Market Revenue (billion), by Alcoholic Products 2025 & 2033
- Figure 21: Europe MEA Alcoholic Drinks Packaging Market Revenue Share (%), by Alcoholic Products 2025 & 2033
- Figure 22: Europe MEA Alcoholic Drinks Packaging Market Revenue (billion), by Product Type 2025 & 2033
- Figure 23: Europe MEA Alcoholic Drinks Packaging Market Revenue Share (%), by Product Type 2025 & 2033
- Figure 24: Europe MEA Alcoholic Drinks Packaging Market Revenue (billion), by Country 2025 & 2033
- Figure 25: Europe MEA Alcoholic Drinks Packaging Market Revenue Share (%), by Country 2025 & 2033
- Figure 26: Middle East & Africa MEA Alcoholic Drinks Packaging Market Revenue (billion), by Primary Material 2025 & 2033
- Figure 27: Middle East & Africa MEA Alcoholic Drinks Packaging Market Revenue Share (%), by Primary Material 2025 & 2033
- Figure 28: Middle East & Africa MEA Alcoholic Drinks Packaging Market Revenue (billion), by Alcoholic Products 2025 & 2033
- Figure 29: Middle East & Africa MEA Alcoholic Drinks Packaging Market Revenue Share (%), by Alcoholic Products 2025 & 2033
- Figure 30: Middle East & Africa MEA Alcoholic Drinks Packaging Market Revenue (billion), by Product Type 2025 & 2033
- Figure 31: Middle East & Africa MEA Alcoholic Drinks Packaging Market Revenue Share (%), by Product Type 2025 & 2033
- Figure 32: Middle East & Africa MEA Alcoholic Drinks Packaging Market Revenue (billion), by Country 2025 & 2033
- Figure 33: Middle East & Africa MEA Alcoholic Drinks Packaging Market Revenue Share (%), by Country 2025 & 2033
- Figure 34: Asia Pacific MEA Alcoholic Drinks Packaging Market Revenue (billion), by Primary Material 2025 & 2033
- Figure 35: Asia Pacific MEA Alcoholic Drinks Packaging Market Revenue Share (%), by Primary Material 2025 & 2033
- Figure 36: Asia Pacific MEA Alcoholic Drinks Packaging Market Revenue (billion), by Alcoholic Products 2025 & 2033
- Figure 37: Asia Pacific MEA Alcoholic Drinks Packaging Market Revenue Share (%), by Alcoholic Products 2025 & 2033
- Figure 38: Asia Pacific MEA Alcoholic Drinks Packaging Market Revenue (billion), by Product Type 2025 & 2033
- Figure 39: Asia Pacific MEA Alcoholic Drinks Packaging Market Revenue Share (%), by Product Type 2025 & 2033
- Figure 40: Asia Pacific MEA Alcoholic Drinks Packaging Market Revenue (billion), by Country 2025 & 2033
- Figure 41: Asia Pacific MEA Alcoholic Drinks Packaging Market Revenue Share (%), by Country 2025 & 2033
List of Tables
- Table 1: Global MEA Alcoholic Drinks Packaging Market Revenue billion Forecast, by Primary Material 2020 & 2033
- Table 2: Global MEA Alcoholic Drinks Packaging Market Revenue billion Forecast, by Alcoholic Products 2020 & 2033
- Table 3: Global MEA Alcoholic Drinks Packaging Market Revenue billion Forecast, by Product Type 2020 & 2033
- Table 4: Global MEA Alcoholic Drinks Packaging Market Revenue billion Forecast, by Region 2020 & 2033
- Table 5: Global MEA Alcoholic Drinks Packaging Market Revenue billion Forecast, by Primary Material 2020 & 2033
- Table 6: Global MEA Alcoholic Drinks Packaging Market Revenue billion Forecast, by Alcoholic Products 2020 & 2033
- Table 7: Global MEA Alcoholic Drinks Packaging Market Revenue billion Forecast, by Product Type 2020 & 2033
- Table 8: Global MEA Alcoholic Drinks Packaging Market Revenue billion Forecast, by Country 2020 & 2033
- Table 9: United States MEA Alcoholic Drinks Packaging Market Revenue (billion) Forecast, by Application 2020 & 2033
- Table 10: Canada MEA Alcoholic Drinks Packaging Market Revenue (billion) Forecast, by Application 2020 & 2033
- Table 11: Mexico MEA Alcoholic Drinks Packaging Market Revenue (billion) Forecast, by Application 2020 & 2033
- Table 12: Global MEA Alcoholic Drinks Packaging Market Revenue billion Forecast, by Primary Material 2020 & 2033
- Table 13: Global MEA Alcoholic Drinks Packaging Market Revenue billion Forecast, by Alcoholic Products 2020 & 2033
- Table 14: Global MEA Alcoholic Drinks Packaging Market Revenue billion Forecast, by Product Type 2020 & 2033
- Table 15: Global MEA Alcoholic Drinks Packaging Market Revenue billion Forecast, by Country 2020 & 2033
- Table 16: Brazil MEA Alcoholic Drinks Packaging Market Revenue (billion) Forecast, by Application 2020 & 2033
- Table 17: Argentina MEA Alcoholic Drinks Packaging Market Revenue (billion) Forecast, by Application 2020 & 2033
- Table 18: Rest of South America MEA Alcoholic Drinks Packaging Market Revenue (billion) Forecast, by Application 2020 & 2033
- Table 19: Global MEA Alcoholic Drinks Packaging Market Revenue billion Forecast, by Primary Material 2020 & 2033
- Table 20: Global MEA Alcoholic Drinks Packaging Market Revenue billion Forecast, by Alcoholic Products 2020 & 2033
- Table 21: Global MEA Alcoholic Drinks Packaging Market Revenue billion Forecast, by Product Type 2020 & 2033
- Table 22: Global MEA Alcoholic Drinks Packaging Market Revenue billion Forecast, by Country 2020 & 2033
- Table 23: United Kingdom MEA Alcoholic Drinks Packaging Market Revenue (billion) Forecast, by Application 2020 & 2033
- Table 24: Germany MEA Alcoholic Drinks Packaging Market Revenue (billion) Forecast, by Application 2020 & 2033
- Table 25: France MEA Alcoholic Drinks Packaging Market Revenue (billion) Forecast, by Application 2020 & 2033
- Table 26: Italy MEA Alcoholic Drinks Packaging Market Revenue (billion) Forecast, by Application 2020 & 2033
- Table 27: Spain MEA Alcoholic Drinks Packaging Market Revenue (billion) Forecast, by Application 2020 & 2033
- Table 28: Russia MEA Alcoholic Drinks Packaging Market Revenue (billion) Forecast, by Application 2020 & 2033
- Table 29: Benelux MEA Alcoholic Drinks Packaging Market Revenue (billion) Forecast, by Application 2020 & 2033
- Table 30: Nordics MEA Alcoholic Drinks Packaging Market Revenue (billion) Forecast, by Application 2020 & 2033
- Table 31: Rest of Europe MEA Alcoholic Drinks Packaging Market Revenue (billion) Forecast, by Application 2020 & 2033
- Table 32: Global MEA Alcoholic Drinks Packaging Market Revenue billion Forecast, by Primary Material 2020 & 2033
- Table 33: Global MEA Alcoholic Drinks Packaging Market Revenue billion Forecast, by Alcoholic Products 2020 & 2033
- Table 34: Global MEA Alcoholic Drinks Packaging Market Revenue billion Forecast, by Product Type 2020 & 2033
- Table 35: Global MEA Alcoholic Drinks Packaging Market Revenue billion Forecast, by Country 2020 & 2033
- Table 36: Turkey MEA Alcoholic Drinks Packaging Market Revenue (billion) Forecast, by Application 2020 & 2033
- Table 37: Israel MEA Alcoholic Drinks Packaging Market Revenue (billion) Forecast, by Application 2020 & 2033
- Table 38: GCC MEA Alcoholic Drinks Packaging Market Revenue (billion) Forecast, by Application 2020 & 2033
- Table 39: North Africa MEA Alcoholic Drinks Packaging Market Revenue (billion) Forecast, by Application 2020 & 2033
- Table 40: South Africa MEA Alcoholic Drinks Packaging Market Revenue (billion) Forecast, by Application 2020 & 2033
- Table 41: Rest of Middle East & Africa MEA Alcoholic Drinks Packaging Market Revenue (billion) Forecast, by Application 2020 & 2033
- Table 42: Global MEA Alcoholic Drinks Packaging Market Revenue billion Forecast, by Primary Material 2020 & 2033
- Table 43: Global MEA Alcoholic Drinks Packaging Market Revenue billion Forecast, by Alcoholic Products 2020 & 2033
- Table 44: Global MEA Alcoholic Drinks Packaging Market Revenue billion Forecast, by Product Type 2020 & 2033
- Table 45: Global MEA Alcoholic Drinks Packaging Market Revenue billion Forecast, by Country 2020 & 2033
- Table 46: China MEA Alcoholic Drinks Packaging Market Revenue (billion) Forecast, by Application 2020 & 2033
- Table 47: India MEA Alcoholic Drinks Packaging Market Revenue (billion) Forecast, by Application 2020 & 2033
- Table 48: Japan MEA Alcoholic Drinks Packaging Market Revenue (billion) Forecast, by Application 2020 & 2033
- Table 49: South Korea MEA Alcoholic Drinks Packaging Market Revenue (billion) Forecast, by Application 2020 & 2033
- Table 50: ASEAN MEA Alcoholic Drinks Packaging Market Revenue (billion) Forecast, by Application 2020 & 2033
- Table 51: Oceania MEA Alcoholic Drinks Packaging Market Revenue (billion) Forecast, by Application 2020 & 2033
- Table 52: Rest of Asia Pacific MEA Alcoholic Drinks Packaging Market Revenue (billion) Forecast, by Application 2020 & 2033
Frequently Asked Questions
1. What is the projected Compound Annual Growth Rate (CAGR) of the MEA Alcoholic Drinks Packaging Market?
The projected CAGR is approximately 5.8%.
2. Which companies are prominent players in the MEA Alcoholic Drinks Packaging Market?
Key companies in the market include Saverglass SAS, Middle East Glass Manufacturing Company SAE, Ball Corporation, Majan Glass Company SAOG, Nampak Ltd, The National Company For Glass Industries (Zouja), Crown Holdings Inc, Can-Pack S, Saudi Arabian Glass Co Ltd, Huhtamäki Oyj, Bonpak (Pty) Ltd, Consol Glass Ltd.
3. What are the main segments of the MEA Alcoholic Drinks Packaging Market?
The market segments include Primary Material, Alcoholic Products, Product Type.
4. Can you provide details about the market size?
The market size is estimated to be USD 78.63 billion as of 2022.
5. What are some drivers contributing to market growth?
Growth in Purchasing Power of Consumers; Growing Awareness Among Alcoholic Beverage Manufacturers to Differentiate Their Products Over Packaging.
6. What are the notable trends driving market growth?
Metal Can Packaging is Expected to Grow Significantly.
7. Are there any restraints impacting market growth?
Presence of Alternate Packaging Solutions.
8. Can you provide examples of recent developments in the market?
August 2021 - Huhtamäki Oyj acquired Elif Holding AŞ, a major supplier of sustainable, flexible packaging to global FMCG brand owners, with operations in Turkey and Egypt. In line with Huhtamaki's 2030 growth strategy, the acquisition adds scale in strategic geographies and supports Huhtamaki's progress toward reaching its high sustainability ambitions. The acquisition also expands Huhtamaki's technology capabilities and product range, allowing it to serve its customers even better.
9. What pricing options are available for accessing the report?
Pricing options include single-user, multi-user, and enterprise licenses priced at USD 4750, USD 4950, and USD 6800 respectively.
10. Is the market size provided in terms of value or volume?
The market size is provided in terms of value, measured in billion.
11. Are there any specific market keywords associated with the report?
Yes, the market keyword associated with the report is "MEA Alcoholic Drinks Packaging Market," which aids in identifying and referencing the specific market segment covered.
12. How do I determine which pricing option suits my needs best?
The pricing options vary based on user requirements and access needs. Individual users may opt for single-user licenses, while businesses requiring broader access may choose multi-user or enterprise licenses for cost-effective access to the report.
13. Are there any additional resources or data provided in the MEA Alcoholic Drinks Packaging Market report?
While the report offers comprehensive insights, it's advisable to review the specific contents or supplementary materials provided to ascertain if additional resources or data are available.
14. How can I stay updated on further developments or reports in the MEA Alcoholic Drinks Packaging Market?
To stay informed about further developments, trends, and reports in the MEA Alcoholic Drinks Packaging Market, consider subscribing to industry newsletters, following relevant companies and organizations, or regularly checking reputable industry news sources and publications.
Methodology
Step 1 - Identification of Relevant Samples Size from Population Database


Step 2 - Approaches for Defining Global Market Size (Value, Volume* & Price*)

Note*: In applicable scenarios
Step 3 - Data Sources
Primary Research
- Web Analytics
- Survey Reports
- Research Institute
- Latest Research Reports
- Opinion Leaders
Secondary Research
- Annual Reports
- White Paper
- Latest Press Release
- Industry Association
- Paid Database
- Investor Presentations

Step 4 - Data Triangulation
Involves using different sources of information in order to increase the validity of a study
These sources are likely to be stakeholders in a program - participants, other researchers, program staff, other community members, and so on.
Then we put all data in single framework & apply various statistical tools to find out the dynamic on the market.
During the analysis stage, feedback from the stakeholder groups would be compared to determine areas of agreement as well as areas of divergence