

Key Insights
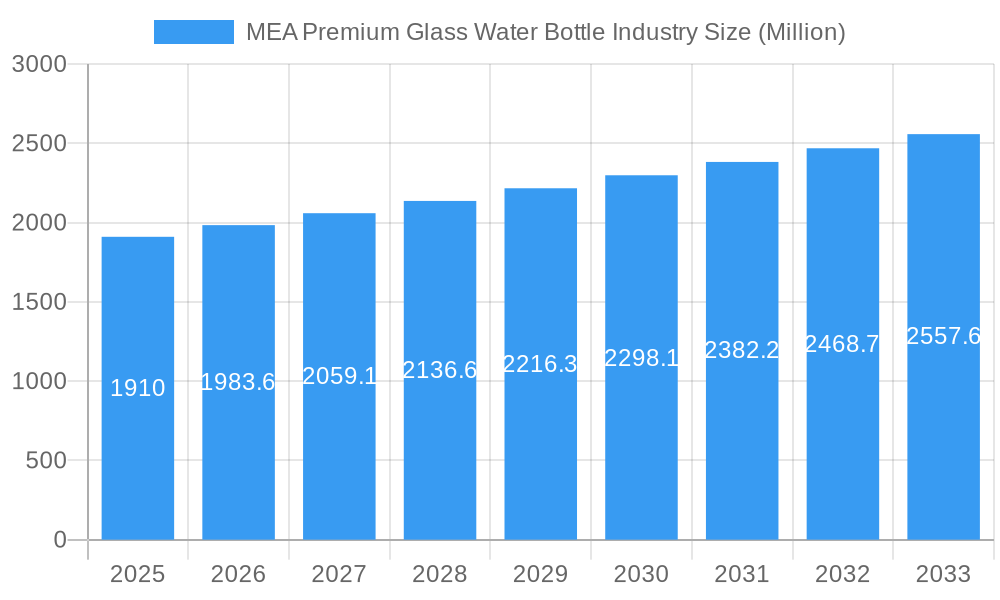
The Middle East and Africa (MEA) premium glass water bottle market, valued at $1.91 billion in 2025, is projected to experience steady growth, driven by a rising health-conscious consumer base prioritizing sustainability and premium products. The market's 3.73% Compound Annual Growth Rate (CAGR) from 2025 to 2033 indicates a significant expansion over the forecast period. This growth is fueled by several key factors. The increasing prevalence of lifestyle diseases is encouraging consumers to opt for healthier hydration choices, boosting demand for premium glass water bottles perceived as safer and more environmentally friendly than plastic alternatives. Furthermore, the burgeoning food and beverage industry in the MEA region, particularly within the premium segment, is significantly impacting demand. Growth in the cosmetics and pharmaceutical industries further contributes to the market's expansion, as these sectors utilize glass bottles for packaging premium products. The market is segmented by color (amber, flint, green, others), end-user industry (beverage, food, cosmetics, pharmaceuticals, others), and country (UAE, Saudi Arabia, Bahrain, Oman, South Africa, Rest of MEA). While challenges may arise from fluctuating raw material prices and competition from alternative packaging materials, the long-term outlook remains positive, driven by the sustained focus on health, sustainability, and premium product preference within the region.
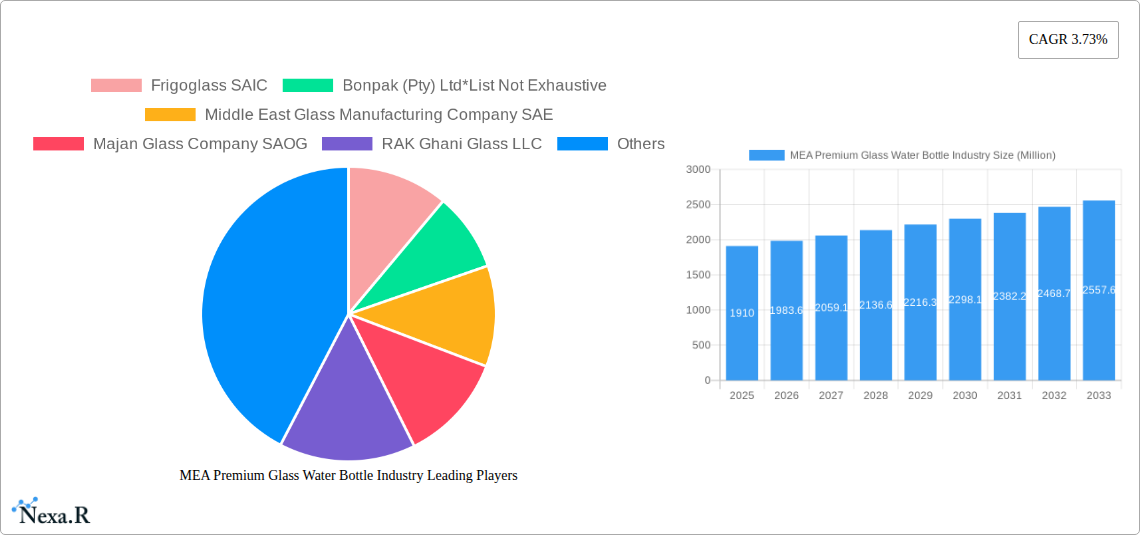
MEA Premium Glass Water Bottle Industry Market Size (In Billion)
The competitive landscape is characterized by a mix of both local and international players, with companies like Frigoglass SAIC, Bonpak (Pty) Ltd, and Middle East Glass Manufacturing Company SAE holding significant market share. However, the market is also attractive for new entrants, especially those specializing in innovative designs, sustainable manufacturing practices, and niche market segments. Future growth opportunities lie in expanding into untapped markets within the MEA region, focusing on e-commerce channels to reach a wider consumer base, and collaborating with key players in the food and beverage, cosmetics, and pharmaceutical industries. Investment in research and development to create innovative and sustainable premium glass water bottles is likely to be crucial for maintaining competitiveness and capturing a larger slice of the expanding market.
MEA Premium Glass Water Bottle Industry Company Market Share
MEA Premium Glass Water Bottle Industry: A Comprehensive Market Report (2019-2033)
This comprehensive report provides an in-depth analysis of the Middle East and Africa (MEA) premium glass water bottle industry, covering market dynamics, growth trends, competitive landscape, and future outlook. The report utilizes data from the historical period (2019-2024), base year (2025), and estimated year (2025), projecting the market's trajectory through the forecast period (2025-2033). This report is an essential resource for industry professionals, investors, and strategic decision-makers seeking a detailed understanding of this dynamic market.
MEA Premium Glass Water Bottle Industry Market Dynamics & Structure
This section analyzes the MEA premium glass water bottle market's structure, identifying key drivers and constraints shaping its evolution. The market is segmented by color type (Amber, Flint, Green, Other Color Types), end-user industry (Beverage, Food, Cosmetics, Pharmaceuticals, Other End-user Industries), and country (United Arab Emirates, Saudi Arabia, Bahrain, Oman, South Africa, Rest of Middle East and Africa).
Market Concentration: The MEA premium glass water bottle market exhibits a moderately concentrated structure, with several key players holding significant market share. The top five companies account for approximately xx% of the total market revenue in 2025 (estimated).
Technological Innovation: Technological advancements in glass manufacturing, including improved durability, lightweight designs, and sustainable production methods, drive market growth. However, high initial investment costs present a barrier to entry for smaller players.
Regulatory Framework: Government regulations concerning food safety and environmental standards influence the market. Compliance requirements impact production costs and operational strategies.
Competitive Product Substitutes: The market faces competition from alternative packaging materials, such as plastic and aluminum. However, the growing consumer preference for sustainable and eco-friendly products presents an opportunity for premium glass water bottles.
End-User Demographics: The rising disposable incomes and health-conscious consumers in MEA fuel demand for premium glass water bottles. Changing lifestyle trends and increased awareness of plastic waste are major influencing factors.
M&A Trends: The MEA premium glass water bottle industry has witnessed a moderate level of mergers and acquisitions (M&A) activity in recent years, with xx deals recorded between 2019 and 2024. Consolidation is expected to continue, driven by the need for expansion and enhanced market share.
MEA Premium Glass Water Bottle Industry Growth Trends & Insights
The MEA premium glass water bottle market is projected to experience substantial growth during the forecast period. Driven by increasing health consciousness, rising disposable incomes, and a growing preference for eco-friendly packaging options, the market is poised for expansion. The CAGR is estimated at xx% from 2025 to 2033, with the market size reaching xx million units by 2033. Market penetration is expected to increase significantly, particularly in the beverage and food segments, owing to increasing consumer demand for premium and sustainable packaging solutions. Technological disruptions, such as the development of lightweight and durable glass bottles, are further fueling market expansion.
Dominant Regions, Countries, or Segments in MEA Premium Glass Water Bottle Industry
The United Arab Emirates (UAE) and Saudi Arabia are projected to be the leading markets for premium glass water bottles in the MEA region during the forecast period, accounting for a combined xx% market share in 2025. This dominance is driven by factors such as:
Strong Economic Growth: The UAE and Saudi Arabia experience robust economic growth, leading to increased consumer spending and disposable income.
Developed Infrastructure: Advanced infrastructure facilitates efficient manufacturing and distribution networks.
Favorable Government Policies: Supportive government initiatives and policies encourage investments in the packaging industry.
Growing Tourism Sector: The thriving tourism industry in these nations boosts demand for premium packaging solutions.
Within the segments, the Beverage end-user industry dominates the market, accounting for xx% in 2025, with Flint colored bottles leading the color type segment, commanding xx% of the market. The growth in these segments is underpinned by the rising preference for premium beverages packaged in aesthetically pleasing and sustainable glass bottles.
MEA Premium Glass Water Bottle Industry Product Landscape
The MEA premium glass water bottle market showcases a wide range of products varying in size, design, color, and functionality. Innovations focus on enhancing durability, improving aesthetic appeal, and incorporating sustainable manufacturing processes. Manufacturers are leveraging lightweight glass technology, along with attractive designs and unique features like double-walled insulation to differentiate their products. These advancements cater to the increasing consumer demand for environmentally conscious and stylish water bottles.
Key Drivers, Barriers & Challenges in MEA Premium Glass Water Bottle Industry
Key Drivers:
- Rising health consciousness: Increased awareness of health benefits associated with water consumption fuels the demand for premium water bottles.
- Growing preference for eco-friendly packaging: Consumers are increasingly opting for sustainable alternatives to plastic bottles.
- Technological advancements: Innovations in glass manufacturing lead to lightweight, durable, and aesthetically appealing products.
Key Challenges:
- High production costs: Compared to plastic alternatives, glass bottles have higher manufacturing costs.
- Fragility: The inherent fragility of glass presents logistical challenges during transportation and handling.
- Competition from substitutes: Plastic and aluminum bottles pose significant competition due to their lower cost and greater durability. This results in a xx% market share loss for glass in the 2019 - 2024 period.
Emerging Opportunities in MEA Premium Glass Water Bottle Industry
- Untapped markets: Expansion into smaller and less-developed markets within the MEA region offers significant growth potential.
- Innovative applications: Exploration of innovative applications, such as reusable glass bottles for other beverages and food products, can expand market reach.
- Evolving consumer preferences: Catering to the rising demand for personalized and customized water bottles opens lucrative opportunities.
Growth Accelerators in the MEA Premium Glass Water Bottle Industry Industry
Strategic partnerships between glass manufacturers and beverage companies, coupled with technological advancements in manufacturing processes, will play a pivotal role in accelerating market growth. Expanding into new markets, increasing brand awareness, and building strong distribution networks are also key strategies. Furthermore, investing in sustainable and eco-friendly manufacturing practices aligns with growing consumer demand for environmentally responsible products.
Key Players Shaping the MEA Premium Glass Water Bottle Market
- Frigoglass SAIC
- Bonpak (Pty) Ltd
- Middle East Glass Manufacturing Company SAE
- Majan Glass Company SAOG
- RAK Ghani Glass LLC
- The National Company For Glass Industries (Zouja)
- Milly Glass Works Ltd
- Piramal Glass Private Limited
- Saudi Arabian Glass Co Ltd
- Unitrade FZE
- Saverglass (Pty) Ltd
Notable Milestones in MEA Premium Glass Water Bottle Industry Sector
January 2022: The West Pharmaceutical Services Inc. and Corning Incorporated partnership to expand Valour Glass technology significantly impacts the pharmaceutical segment's packaging solutions, potentially boosting demand for specialized glass bottles.
June 2022: The announcement of investment opportunities in the Saudi Arabian vaccines and essential medicines industry indicates future growth prospects within the pharmaceutical packaging sector.
In-Depth MEA Premium Glass Water Bottle Industry Market Outlook
The MEA premium glass water bottle industry is poised for sustained growth, driven by a confluence of factors including increasing consumer preference for sustainable products, rising disposable incomes, and advancements in glass manufacturing technology. Strategic investments in research and development, coupled with proactive market expansion strategies, will be crucial for companies to capitalize on the substantial growth potential within this dynamic market. The market is expected to continue its expansion, with opportunities for both established players and new entrants to carve out significant market shares.
MEA Premium Glass Water Bottle Industry Segmentation
-
1. End-user Industry
-
1.1. Beverages
-
1.1.1. Alcoholi
- 1.1.1.1. Wins and Spirits
- 1.1.1.2. Beer and Cider
- 1.1.1.3. Other Alcoholic-Beverages
-
1.1.2. Non-alco
- 1.1.2.1. Carbonated Drinks
- 1.1.2.2. Juices
- 1.1.2.3. Water
- 1.1.2.4. Dairy-Based
- 1.1.2.5. Flavored Drinks
- 1.1.2.6. Other Non-Alcoholic Drinks
-
1.1.1. Alcoholi
- 1.2. Food
- 1.3. Cosmetics
- 1.4. Pharmaceutical (Excluding Vials and Ampoules)
- 1.5. Other End-user Industries
-
1.1. Beverages
MEA Premium Glass Water Bottle Industry Segmentation By Geography
-
1. North America
- 1.1. United States
- 1.2. Canada
- 1.3. Mexico
-
2. South America
- 2.1. Brazil
- 2.2. Argentina
- 2.3. Rest of South America
-
3. Europe
- 3.1. United Kingdom
- 3.2. Germany
- 3.3. France
- 3.4. Italy
- 3.5. Spain
- 3.6. Russia
- 3.7. Benelux
- 3.8. Nordics
- 3.9. Rest of Europe
-
4. Middle East & Africa
- 4.1. Turkey
- 4.2. Israel
- 4.3. GCC
- 4.4. North Africa
- 4.5. South Africa
- 4.6. Rest of Middle East & Africa
-
5. Asia Pacific
- 5.1. China
- 5.2. India
- 5.3. Japan
- 5.4. South Korea
- 5.5. ASEAN
- 5.6. Oceania
- 5.7. Rest of Asia Pacific
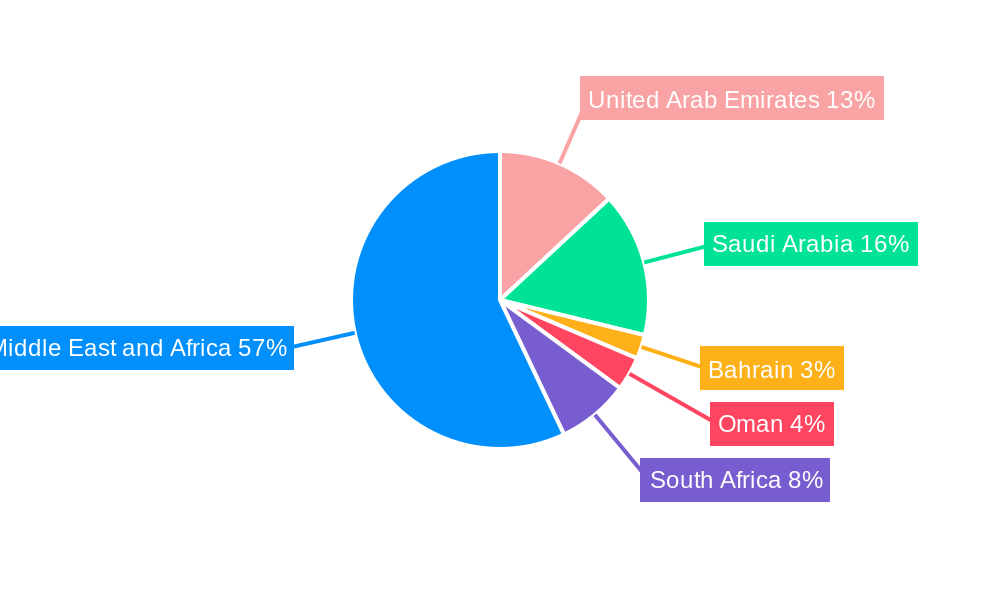
MEA Premium Glass Water Bottle Industry Regional Market Share
Geographic Coverage of MEA Premium Glass Water Bottle Industry
MEA Premium Glass Water Bottle Industry REPORT HIGHLIGHTS
| Aspects | Details |
|---|---|
| Study Period | 2020-2034 |
| Base Year | 2025 |
| Estimated Year | 2026 |
| Forecast Period | 2026-2034 |
| Historical Period | 2020-2025 |
| Growth Rate | CAGR of 3.73% from 2020-2034 |
| Segmentation |
|
Table of Contents
- 1. Introduction
- 1.1. Research Scope
- 1.2. Market Segmentation
- 1.3. Research Objective
- 1.4. Definitions and Assumptions
- 2. Executive Summary
- 2.1. Market Snapshot
- 3. Market Dynamics
- 3.1. Market Drivers
- 3.2. Market Restrains
- 3.3. Market Trends
- 3.4. Market Opportunities
- 4. Market Factor Analysis
- 4.1. Porters Five Forces
- 4.1.1. Bargaining Power of Suppliers
- 4.1.2. Bargaining Power of Buyers
- 4.1.3. Threat of New Entrants
- 4.1.4. Threat of Substitutes
- 4.1.5. Competitive Rivalry
- 4.2. PESTEL analysis
- 4.3. BCG Analysis
- 4.3.1. Stars (High Growth, High Market Share)
- 4.3.2. Cash Cows (Low Growth, High Market Share)
- 4.3.3. Question Mark (High Growth, Low Market Share)
- 4.3.4. Dogs (Low Growth, Low Market Share)
- 4.4. Ansoff Matrix Analysis
- 4.5. Supply Chain Analysis
- 4.6. Regulatory Landscape
- 4.7. Current Market Potential and Opportunity Assessment (TAM–SAM–SOM Framework)
- 4.8. NRP Analyst Note
- 4.1. Porters Five Forces
- 5. Market Analysis, Insights and Forecast 2021-2033
- 5.1. Market Analysis, Insights and Forecast - by End-user Industry
- 5.1.1. Beverages
- 5.1.1.1. Alcoholi
- 5.1.1.1.1. Wins and Spirits
- 5.1.1.1.2. Beer and Cider
- 5.1.1.1.3. Other Alcoholic-Beverages
- 5.1.1.2. Non-alco
- 5.1.1.2.1. Carbonated Drinks
- 5.1.1.2.2. Juices
- 5.1.1.2.3. Water
- 5.1.1.2.4. Dairy-Based
- 5.1.1.2.5. Flavored Drinks
- 5.1.1.2.6. Other Non-Alcoholic Drinks
- 5.1.1.1. Alcoholi
- 5.1.2. Food
- 5.1.3. Cosmetics
- 5.1.4. Pharmaceutical (Excluding Vials and Ampoules)
- 5.1.5. Other End-user Industries
- 5.1.1. Beverages
- 5.2. Market Analysis, Insights and Forecast - by Region
- 5.2.1. North America
- 5.2.2. South America
- 5.2.3. Europe
- 5.2.4. Middle East & Africa
- 5.2.5. Asia Pacific
- 5.1. Market Analysis, Insights and Forecast - by End-user Industry
- 6. Global MEA Premium Glass Water Bottle Industry Analysis, Insights and Forecast, 2021-2033
- 6.1. Market Analysis, Insights and Forecast - by End-user Industry
- 6.1.1. Beverages
- 6.1.1.1. Alcoholi
- 6.1.1.1.1. Wins and Spirits
- 6.1.1.1.2. Beer and Cider
- 6.1.1.1.3. Other Alcoholic-Beverages
- 6.1.1.2. Non-alco
- 6.1.1.2.1. Carbonated Drinks
- 6.1.1.2.2. Juices
- 6.1.1.2.3. Water
- 6.1.1.2.4. Dairy-Based
- 6.1.1.2.5. Flavored Drinks
- 6.1.1.2.6. Other Non-Alcoholic Drinks
- 6.1.1.1. Alcoholi
- 6.1.2. Food
- 6.1.3. Cosmetics
- 6.1.4. Pharmaceutical (Excluding Vials and Ampoules)
- 6.1.5. Other End-user Industries
- 6.1.1. Beverages
- 6.1. Market Analysis, Insights and Forecast - by End-user Industry
- 7. North America MEA Premium Glass Water Bottle Industry Analysis, Insights and Forecast, 2020-2032
- 7.1. Market Analysis, Insights and Forecast - by End-user Industry
- 7.1.1. Beverages
- 7.1.1.1. Alcoholi
- 7.1.1.1.1. Wins and Spirits
- 7.1.1.1.2. Beer and Cider
- 7.1.1.1.3. Other Alcoholic-Beverages
- 7.1.1.2. Non-alco
- 7.1.1.2.1. Carbonated Drinks
- 7.1.1.2.2. Juices
- 7.1.1.2.3. Water
- 7.1.1.2.4. Dairy-Based
- 7.1.1.2.5. Flavored Drinks
- 7.1.1.2.6. Other Non-Alcoholic Drinks
- 7.1.1.1. Alcoholi
- 7.1.2. Food
- 7.1.3. Cosmetics
- 7.1.4. Pharmaceutical (Excluding Vials and Ampoules)
- 7.1.5. Other End-user Industries
- 7.1.1. Beverages
- 7.1. Market Analysis, Insights and Forecast - by End-user Industry
- 8. South America MEA Premium Glass Water Bottle Industry Analysis, Insights and Forecast, 2020-2032
- 8.1. Market Analysis, Insights and Forecast - by End-user Industry
- 8.1.1. Beverages
- 8.1.1.1. Alcoholi
- 8.1.1.1.1. Wins and Spirits
- 8.1.1.1.2. Beer and Cider
- 8.1.1.1.3. Other Alcoholic-Beverages
- 8.1.1.2. Non-alco
- 8.1.1.2.1. Carbonated Drinks
- 8.1.1.2.2. Juices
- 8.1.1.2.3. Water
- 8.1.1.2.4. Dairy-Based
- 8.1.1.2.5. Flavored Drinks
- 8.1.1.2.6. Other Non-Alcoholic Drinks
- 8.1.1.1. Alcoholi
- 8.1.2. Food
- 8.1.3. Cosmetics
- 8.1.4. Pharmaceutical (Excluding Vials and Ampoules)
- 8.1.5. Other End-user Industries
- 8.1.1. Beverages
- 8.1. Market Analysis, Insights and Forecast - by End-user Industry
- 9. Europe MEA Premium Glass Water Bottle Industry Analysis, Insights and Forecast, 2020-2032
- 9.1. Market Analysis, Insights and Forecast - by End-user Industry
- 9.1.1. Beverages
- 9.1.1.1. Alcoholi
- 9.1.1.1.1. Wins and Spirits
- 9.1.1.1.2. Beer and Cider
- 9.1.1.1.3. Other Alcoholic-Beverages
- 9.1.1.2. Non-alco
- 9.1.1.2.1. Carbonated Drinks
- 9.1.1.2.2. Juices
- 9.1.1.2.3. Water
- 9.1.1.2.4. Dairy-Based
- 9.1.1.2.5. Flavored Drinks
- 9.1.1.2.6. Other Non-Alcoholic Drinks
- 9.1.1.1. Alcoholi
- 9.1.2. Food
- 9.1.3. Cosmetics
- 9.1.4. Pharmaceutical (Excluding Vials and Ampoules)
- 9.1.5. Other End-user Industries
- 9.1.1. Beverages
- 9.1. Market Analysis, Insights and Forecast - by End-user Industry
- 10. Middle East & Africa MEA Premium Glass Water Bottle Industry Analysis, Insights and Forecast, 2020-2032
- 10.1. Market Analysis, Insights and Forecast - by End-user Industry
- 10.1.1. Beverages
- 10.1.1.1. Alcoholi
- 10.1.1.1.1. Wins and Spirits
- 10.1.1.1.2. Beer and Cider
- 10.1.1.1.3. Other Alcoholic-Beverages
- 10.1.1.2. Non-alco
- 10.1.1.2.1. Carbonated Drinks
- 10.1.1.2.2. Juices
- 10.1.1.2.3. Water
- 10.1.1.2.4. Dairy-Based
- 10.1.1.2.5. Flavored Drinks
- 10.1.1.2.6. Other Non-Alcoholic Drinks
- 10.1.1.1. Alcoholi
- 10.1.2. Food
- 10.1.3. Cosmetics
- 10.1.4. Pharmaceutical (Excluding Vials and Ampoules)
- 10.1.5. Other End-user Industries
- 10.1.1. Beverages
- 10.1. Market Analysis, Insights and Forecast - by End-user Industry
- 11. Asia Pacific MEA Premium Glass Water Bottle Industry Analysis, Insights and Forecast, 2020-2032
- 11.1. Market Analysis, Insights and Forecast - by End-user Industry
- 11.1.1. Beverages
- 11.1.1.1. Alcoholi
- 11.1.1.1.1. Wins and Spirits
- 11.1.1.1.2. Beer and Cider
- 11.1.1.1.3. Other Alcoholic-Beverages
- 11.1.1.2. Non-alco
- 11.1.1.2.1. Carbonated Drinks
- 11.1.1.2.2. Juices
- 11.1.1.2.3. Water
- 11.1.1.2.4. Dairy-Based
- 11.1.1.2.5. Flavored Drinks
- 11.1.1.2.6. Other Non-Alcoholic Drinks
- 11.1.1.1. Alcoholi
- 11.1.2. Food
- 11.1.3. Cosmetics
- 11.1.4. Pharmaceutical (Excluding Vials and Ampoules)
- 11.1.5. Other End-user Industries
- 11.1.1. Beverages
- 11.1. Market Analysis, Insights and Forecast - by End-user Industry
- 12. Competitive Analysis
- 12.1. Company Profiles
- 12.1.1 Frigoglass SAIC
- 12.1.1.1. Company Overview
- 12.1.1.2. Products
- 12.1.1.3. Company Financials
- 12.1.1.4. SWOT Analysis
- 12.1.2 Bonpak (Pty) Ltd*List Not Exhaustive
- 12.1.2.1. Company Overview
- 12.1.2.2. Products
- 12.1.2.3. Company Financials
- 12.1.2.4. SWOT Analysis
- 12.1.3 Middle East Glass Manufacturing Company SAE
- 12.1.3.1. Company Overview
- 12.1.3.2. Products
- 12.1.3.3. Company Financials
- 12.1.3.4. SWOT Analysis
- 12.1.4 Majan Glass Company SAOG
- 12.1.4.1. Company Overview
- 12.1.4.2. Products
- 12.1.4.3. Company Financials
- 12.1.4.4. SWOT Analysis
- 12.1.5 RAK Ghani Glass LLC
- 12.1.5.1. Company Overview
- 12.1.5.2. Products
- 12.1.5.3. Company Financials
- 12.1.5.4. SWOT Analysis
- 12.1.6 The National Company For Glass Industries (Zouja)
- 12.1.6.1. Company Overview
- 12.1.6.2. Products
- 12.1.6.3. Company Financials
- 12.1.6.4. SWOT Analysis
- 12.1.7 Milly Glass Works Ltd
- 12.1.7.1. Company Overview
- 12.1.7.2. Products
- 12.1.7.3. Company Financials
- 12.1.7.4. SWOT Analysis
- 12.1.8 Piramal Glass Private Limited
- 12.1.8.1. Company Overview
- 12.1.8.2. Products
- 12.1.8.3. Company Financials
- 12.1.8.4. SWOT Analysis
- 12.1.9 Saudi Arabian Glass Co Ltd
- 12.1.9.1. Company Overview
- 12.1.9.2. Products
- 12.1.9.3. Company Financials
- 12.1.9.4. SWOT Analysis
- 12.1.10 Unitrade FZE
- 12.1.10.1. Company Overview
- 12.1.10.2. Products
- 12.1.10.3. Company Financials
- 12.1.10.4. SWOT Analysis
- 12.1.11 Saverglass (Pty) Ltd
- 12.1.11.1. Company Overview
- 12.1.11.2. Products
- 12.1.11.3. Company Financials
- 12.1.11.4. SWOT Analysis
- 12.1.1 Frigoglass SAIC
- 12.2. Market Entropy
- 12.2.1 Company's Key Areas Served
- 12.2.2 Recent Developments
- 12.3. Company Market Share Analysis 2025
- 12.3.1 Top 5 Companies Market Share Analysis
- 12.3.2 Top 3 Companies Market Share Analysis
- 12.4. List of Potential Customers
- 13. Research Methodology
List of Figures
- Figure 1: Global MEA Premium Glass Water Bottle Industry Revenue Breakdown (Million, %) by Region 2025 & 2033
- Figure 2: North America MEA Premium Glass Water Bottle Industry Revenue (Million), by End-user Industry 2025 & 2033
- Figure 3: North America MEA Premium Glass Water Bottle Industry Revenue Share (%), by End-user Industry 2025 & 2033
- Figure 4: North America MEA Premium Glass Water Bottle Industry Revenue (Million), by Country 2025 & 2033
- Figure 5: North America MEA Premium Glass Water Bottle Industry Revenue Share (%), by Country 2025 & 2033
- Figure 6: South America MEA Premium Glass Water Bottle Industry Revenue (Million), by End-user Industry 2025 & 2033
- Figure 7: South America MEA Premium Glass Water Bottle Industry Revenue Share (%), by End-user Industry 2025 & 2033
- Figure 8: South America MEA Premium Glass Water Bottle Industry Revenue (Million), by Country 2025 & 2033
- Figure 9: South America MEA Premium Glass Water Bottle Industry Revenue Share (%), by Country 2025 & 2033
- Figure 10: Europe MEA Premium Glass Water Bottle Industry Revenue (Million), by End-user Industry 2025 & 2033
- Figure 11: Europe MEA Premium Glass Water Bottle Industry Revenue Share (%), by End-user Industry 2025 & 2033
- Figure 12: Europe MEA Premium Glass Water Bottle Industry Revenue (Million), by Country 2025 & 2033
- Figure 13: Europe MEA Premium Glass Water Bottle Industry Revenue Share (%), by Country 2025 & 2033
- Figure 14: Middle East & Africa MEA Premium Glass Water Bottle Industry Revenue (Million), by End-user Industry 2025 & 2033
- Figure 15: Middle East & Africa MEA Premium Glass Water Bottle Industry Revenue Share (%), by End-user Industry 2025 & 2033
- Figure 16: Middle East & Africa MEA Premium Glass Water Bottle Industry Revenue (Million), by Country 2025 & 2033
- Figure 17: Middle East & Africa MEA Premium Glass Water Bottle Industry Revenue Share (%), by Country 2025 & 2033
- Figure 18: Asia Pacific MEA Premium Glass Water Bottle Industry Revenue (Million), by End-user Industry 2025 & 2033
- Figure 19: Asia Pacific MEA Premium Glass Water Bottle Industry Revenue Share (%), by End-user Industry 2025 & 2033
- Figure 20: Asia Pacific MEA Premium Glass Water Bottle Industry Revenue (Million), by Country 2025 & 2033
- Figure 21: Asia Pacific MEA Premium Glass Water Bottle Industry Revenue Share (%), by Country 2025 & 2033
List of Tables
- Table 1: Global MEA Premium Glass Water Bottle Industry Revenue Million Forecast, by End-user Industry 2020 & 2033
- Table 2: Global MEA Premium Glass Water Bottle Industry Revenue Million Forecast, by Region 2020 & 2033
- Table 3: Global MEA Premium Glass Water Bottle Industry Revenue Million Forecast, by End-user Industry 2020 & 2033
- Table 4: Global MEA Premium Glass Water Bottle Industry Revenue Million Forecast, by Country 2020 & 2033
- Table 5: United States MEA Premium Glass Water Bottle Industry Revenue (Million) Forecast, by Application 2020 & 2033
- Table 6: Canada MEA Premium Glass Water Bottle Industry Revenue (Million) Forecast, by Application 2020 & 2033
- Table 7: Mexico MEA Premium Glass Water Bottle Industry Revenue (Million) Forecast, by Application 2020 & 2033
- Table 8: Global MEA Premium Glass Water Bottle Industry Revenue Million Forecast, by End-user Industry 2020 & 2033
- Table 9: Global MEA Premium Glass Water Bottle Industry Revenue Million Forecast, by Country 2020 & 2033
- Table 10: Brazil MEA Premium Glass Water Bottle Industry Revenue (Million) Forecast, by Application 2020 & 2033
- Table 11: Argentina MEA Premium Glass Water Bottle Industry Revenue (Million) Forecast, by Application 2020 & 2033
- Table 12: Rest of South America MEA Premium Glass Water Bottle Industry Revenue (Million) Forecast, by Application 2020 & 2033
- Table 13: Global MEA Premium Glass Water Bottle Industry Revenue Million Forecast, by End-user Industry 2020 & 2033
- Table 14: Global MEA Premium Glass Water Bottle Industry Revenue Million Forecast, by Country 2020 & 2033
- Table 15: United Kingdom MEA Premium Glass Water Bottle Industry Revenue (Million) Forecast, by Application 2020 & 2033
- Table 16: Germany MEA Premium Glass Water Bottle Industry Revenue (Million) Forecast, by Application 2020 & 2033
- Table 17: France MEA Premium Glass Water Bottle Industry Revenue (Million) Forecast, by Application 2020 & 2033
- Table 18: Italy MEA Premium Glass Water Bottle Industry Revenue (Million) Forecast, by Application 2020 & 2033
- Table 19: Spain MEA Premium Glass Water Bottle Industry Revenue (Million) Forecast, by Application 2020 & 2033
- Table 20: Russia MEA Premium Glass Water Bottle Industry Revenue (Million) Forecast, by Application 2020 & 2033
- Table 21: Benelux MEA Premium Glass Water Bottle Industry Revenue (Million) Forecast, by Application 2020 & 2033
- Table 22: Nordics MEA Premium Glass Water Bottle Industry Revenue (Million) Forecast, by Application 2020 & 2033
- Table 23: Rest of Europe MEA Premium Glass Water Bottle Industry Revenue (Million) Forecast, by Application 2020 & 2033
- Table 24: Global MEA Premium Glass Water Bottle Industry Revenue Million Forecast, by End-user Industry 2020 & 2033
- Table 25: Global MEA Premium Glass Water Bottle Industry Revenue Million Forecast, by Country 2020 & 2033
- Table 26: Turkey MEA Premium Glass Water Bottle Industry Revenue (Million) Forecast, by Application 2020 & 2033
- Table 27: Israel MEA Premium Glass Water Bottle Industry Revenue (Million) Forecast, by Application 2020 & 2033
- Table 28: GCC MEA Premium Glass Water Bottle Industry Revenue (Million) Forecast, by Application 2020 & 2033
- Table 29: North Africa MEA Premium Glass Water Bottle Industry Revenue (Million) Forecast, by Application 2020 & 2033
- Table 30: South Africa MEA Premium Glass Water Bottle Industry Revenue (Million) Forecast, by Application 2020 & 2033
- Table 31: Rest of Middle East & Africa MEA Premium Glass Water Bottle Industry Revenue (Million) Forecast, by Application 2020 & 2033
- Table 32: Global MEA Premium Glass Water Bottle Industry Revenue Million Forecast, by End-user Industry 2020 & 2033
- Table 33: Global MEA Premium Glass Water Bottle Industry Revenue Million Forecast, by Country 2020 & 2033
- Table 34: China MEA Premium Glass Water Bottle Industry Revenue (Million) Forecast, by Application 2020 & 2033
- Table 35: India MEA Premium Glass Water Bottle Industry Revenue (Million) Forecast, by Application 2020 & 2033
- Table 36: Japan MEA Premium Glass Water Bottle Industry Revenue (Million) Forecast, by Application 2020 & 2033
- Table 37: South Korea MEA Premium Glass Water Bottle Industry Revenue (Million) Forecast, by Application 2020 & 2033
- Table 38: ASEAN MEA Premium Glass Water Bottle Industry Revenue (Million) Forecast, by Application 2020 & 2033
- Table 39: Oceania MEA Premium Glass Water Bottle Industry Revenue (Million) Forecast, by Application 2020 & 2033
- Table 40: Rest of Asia Pacific MEA Premium Glass Water Bottle Industry Revenue (Million) Forecast, by Application 2020 & 2033
Frequently Asked Questions
1. What is the projected Compound Annual Growth Rate (CAGR) of the MEA Premium Glass Water Bottle Industry?
The projected CAGR is approximately 3.73%.
2. Which companies are prominent players in the MEA Premium Glass Water Bottle Industry?
Key companies in the market include Frigoglass SAIC, Bonpak (Pty) Ltd*List Not Exhaustive, Middle East Glass Manufacturing Company SAE, Majan Glass Company SAOG, RAK Ghani Glass LLC, The National Company For Glass Industries (Zouja), Milly Glass Works Ltd, Piramal Glass Private Limited, Saudi Arabian Glass Co Ltd, Unitrade FZE, Saverglass (Pty) Ltd.
3. What are the main segments of the MEA Premium Glass Water Bottle Industry?
The market segments include End-user Industry.
4. Can you provide details about the market size?
The market size is estimated to be USD 1.91 Million as of 2022.
5. What are some drivers contributing to market growth?
5.1 Growing Disposable Income and Integration of Glass Bottles and Containers in Premium Packaging5.2 Growth of the Pharmaceutical Industry in Emerging Economies.
6. What are the notable trends driving market growth?
Pharmaceuticals Segment is Expected to Boost the Market Growth.
7. Are there any restraints impacting market growth?
6.1 Alternative Forms of Packaging such as Rigid Plastic are Challenging the Market Growth.
8. Can you provide examples of recent developments in the market?
January 2022: The exclusive supply and technology agreement between West Pharmaceutical Services Inc. and Corning Incorporated was announced. The new partnership was to spend millions of dollars expanding Corning's Valour Glass technology to improve patient safety and widen access to life-saving therapies. The agreement was expected to allow the pharmaceutical sector to create cutting-edge packaging and delivery methods for injectable medicine.
9. What pricing options are available for accessing the report?
Pricing options include single-user, multi-user, and enterprise licenses priced at USD 4750, USD 4950, and USD 6800 respectively.
10. Is the market size provided in terms of value or volume?
The market size is provided in terms of value, measured in Million.
11. Are there any specific market keywords associated with the report?
Yes, the market keyword associated with the report is "MEA Premium Glass Water Bottle Industry," which aids in identifying and referencing the specific market segment covered.
12. How do I determine which pricing option suits my needs best?
The pricing options vary based on user requirements and access needs. Individual users may opt for single-user licenses, while businesses requiring broader access may choose multi-user or enterprise licenses for cost-effective access to the report.
13. Are there any additional resources or data provided in the MEA Premium Glass Water Bottle Industry report?
While the report offers comprehensive insights, it's advisable to review the specific contents or supplementary materials provided to ascertain if additional resources or data are available.
14. How can I stay updated on further developments or reports in the MEA Premium Glass Water Bottle Industry?
To stay informed about further developments, trends, and reports in the MEA Premium Glass Water Bottle Industry, consider subscribing to industry newsletters, following relevant companies and organizations, or regularly checking reputable industry news sources and publications.
Methodology
Step 1 - Identification of Relevant Samples Size from Population Database


Step 2 - Approaches for Defining Global Market Size (Value, Volume* & Price*)

Note*: In applicable scenarios
Step 3 - Data Sources
Primary Research
- Web Analytics
- Survey Reports
- Research Institute
- Latest Research Reports
- Opinion Leaders
Secondary Research
- Annual Reports
- White Paper
- Latest Press Release
- Industry Association
- Paid Database
- Investor Presentations

Step 4 - Data Triangulation
Involves using different sources of information in order to increase the validity of a study
These sources are likely to be stakeholders in a program - participants, other researchers, program staff, other community members, and so on.
Then we put all data in single framework & apply various statistical tools to find out the dynamic on the market.
During the analysis stage, feedback from the stakeholder groups would be compared to determine areas of agreement as well as areas of divergence