

Key Insights
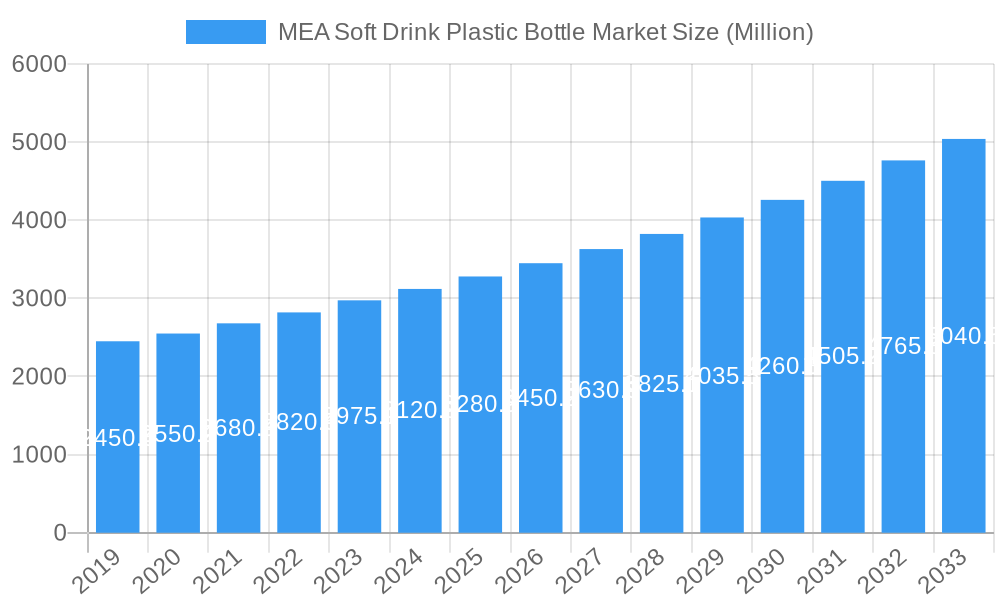
The Middle East and Africa (MEA) Soft Drink Plastic Bottle Market is projected for significant expansion, anticipating a market size of $2.43 billion by 2025. This growth trajectory is fueled by a Compound Annual Growth Rate (CAGR) of 3.89% from 2025 to 2033. Key growth drivers include escalating demand for convenient and cost-effective beverage packaging across a rapidly growing regional population. Rising disposable incomes and evolving consumer lifestyles favoring on-the-go consumption directly stimulate demand for plastic bottles, particularly PET, PP, and LDPE variants. The beverage sector remains the dominant end-user, with substantial contributions also anticipated from food and household care segments. Urbanization and a growing middle class in emerging MEA economies further amplify packaged soft drink consumption.
MEA Soft Drink Plastic Bottle Market Market Size (In Billion)
Market dynamics are further shaped by trends such as lightweighting and the development of sustainable packaging like recycled PET (rPET) and bio-based plastics. Manufacturers are focusing on innovative designs and enhanced barrier properties to preserve product freshness and extend shelf life. Potential restraints include raw material price volatility, particularly for PET and PP, impacting manufacturing costs. Stringent government regulations on plastic waste management and a push for reusable packaging solutions also present challenges. Nevertheless, sustained demand for convenient, single-use plastic bottles for soft drinks, especially in developing MEA regions, is expected to drive positive market momentum, supported by strategic investments in production capacity and technological advancements.
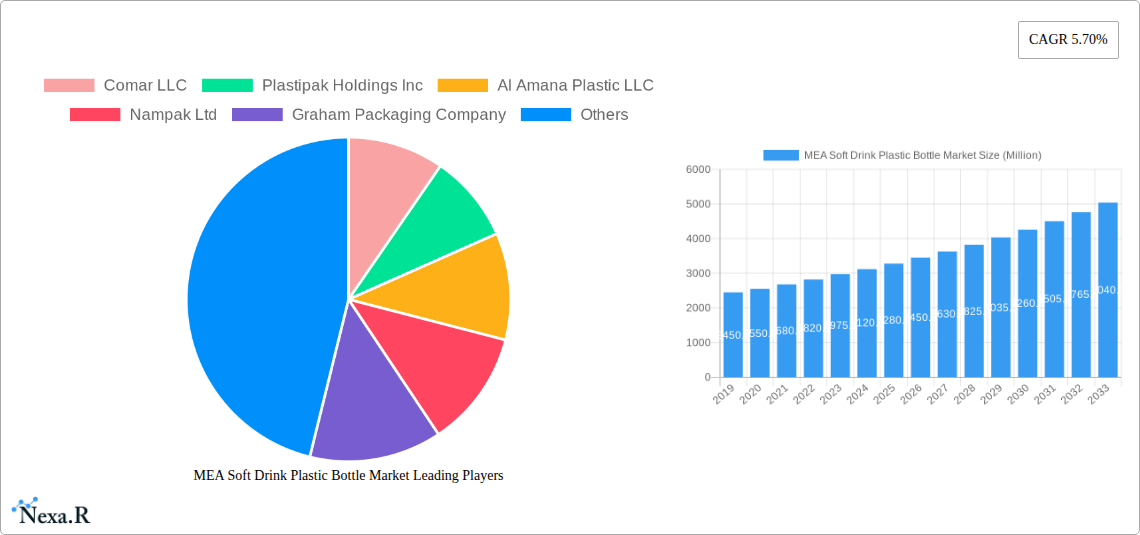
MEA Soft Drink Plastic Bottle Market Company Market Share
MEA Soft Drink Plastic Bottle Market: Comprehensive Analysis & Future Outlook (2019-2033)
This report provides an in-depth analysis of the Middle East and Africa (MEA) Soft Drink Plastic Bottle Market, offering critical insights into market dynamics, growth trends, competitive landscape, and future opportunities. With a comprehensive study period spanning from 2019 to 2033, a base year of 2025, and a forecast period of 2025-2033, this research is designed for industry professionals seeking to understand the evolving market. The report quantifies market size in Million units, delivering actionable intelligence for strategic decision-making. Explore the intricate relationships between parent and child markets, and leverage high-traffic keywords to maximize your visibility.
MEA Soft Drink Plastic Bottle Market Market Dynamics & Structure
The MEA Soft Drink Plastic Bottle Market is characterized by a moderately concentrated structure, with key players like Comar LLC, Plastipak Holdings Inc, Al Amana Plastic LLC, Nampak Ltd, Graham Packaging Company, Amcor PLC, Altium Packaging LLC, Takween Advanced Industries, Alpha Packaging, Container Corporation of Canada Ltd, Gerresheimer AG, and ALPLA Group holding significant sway. Technological innovation is a primary driver, with advancements in lightweighting, barrier properties, and sustainable materials like recycled PET (rPET) shaping product development. Regulatory frameworks, particularly concerning plastic waste management and recycling initiatives, are increasingly influencing market strategies. Competitive product substitutes, such as glass bottles and aluminum cans, pose a constant challenge, although the cost-effectiveness and convenience of plastic bottles maintain their dominance in many applications. End-user demographics, driven by a young and growing population with increasing disposable incomes, fuel demand for packaged soft drinks. Mergers and acquisitions (M&A) are observed as companies seek to consolidate their market positions, expand geographical reach, and enhance their technological capabilities.
- Market Concentration: Moderately concentrated with a few dominant global and regional players.
- Technological Innovation: Focus on lightweighting, improved barrier properties, and sustainable material integration (e.g., rPET).
- Regulatory Frameworks: Growing emphasis on Extended Producer Responsibility (EPR) and plastic waste reduction policies.
- Competitive Substitutes: Glass bottles and aluminum cans present alternatives, but cost and convenience favor plastic.
- End-User Demographics: Young, growing population and rising disposable incomes in the MEA region drive consumption.
- M&A Trends: Strategic acquisitions and partnerships to gain market share and technological edge.
MEA Soft Drink Plastic Bottle Market Growth Trends & Insights
The MEA Soft Drink Plastic Bottle Market is poised for robust growth, driven by a confluence of factors including a burgeoning population, increasing urbanization, and a rising middle class with greater purchasing power. The Beverages end-user vertical, particularly soft drinks, remains the primary market driver, witnessing steady adoption rates fueled by convenience and affordability. Technological disruptions are primarily focused on enhancing the sustainability profile of plastic bottles, with a significant push towards incorporating post-consumer recycled (PCR) PET resin. Consumer behavior is shifting towards brands that demonstrate a commitment to environmental responsibility, leading to increased demand for recyclable and recycled content packaging. The market size evolution is projected to be steady, with a consistent Compound Annual Growth Rate (CAGR) anticipated over the forecast period. Market penetration is expected to deepen across emerging economies within the region, supported by expanding retail infrastructure and greater product accessibility.
Dominant Regions, Countries, or Segments in MEA Soft Drink Plastic Bottle Market
The Beverages end-user vertical stands out as the dominant segment within the MEA Soft Drink Plastic Bottle Market, driven by the sheer volume of soft drink consumption across the region. Within the geographical landscape, Saudi Arabia and the United Arab Emirates are anticipated to lead market growth, propelled by strong economic growth, significant investments in the food and beverage industry, and high per capita consumption of soft drinks.
Dominant End-user Vertical:
- Beverages: Accounts for the largest share due to high soft drink consumption.
- Key Drivers: Growing population, increasing disposable incomes, and brand marketing efforts.
- Market Share: Estimated to be over 60% of the total market.
- Growth Potential: Continual demand for packaged beverages in convenience formats.
- Beverages: Accounts for the largest share due to high soft drink consumption.
Leading Geographies:
- Saudi Arabia:
- Key Drivers: Large domestic market, significant investment in F&B infrastructure, and a youthful demographic.
- Market Share: Projected to hold a substantial share of the MEA market.
- Growth Potential: Expansion of beverage production facilities and increased consumer spending.
- United Arab Emirates:
- Key Drivers: Strong expatriate population, high disposable income, and a robust tourism sector driving beverage demand.
- Market Share: Significant contributor to regional market value.
- Growth Potential: Continued economic diversification and a thriving hospitality industry.
- Saudi Arabia:
Dominant Raw Material:
- PET (Polyethylene Terephthalate): This remains the workhorse for soft drink bottles due to its clarity, strength, and recyclability.
- Key Drivers: Cost-effectiveness, excellent barrier properties against oxygen and carbon dioxide, and widespread availability.
- Market Share: Dominates the raw material segment for soft drink bottles.
- Growth Potential: Continued innovation in virgin PET production and increasing use of rPET.
- PET (Polyethylene Terephthalate): This remains the workhorse for soft drink bottles due to its clarity, strength, and recyclability.
MEA Soft Drink Plastic Bottle Market Product Landscape
The MEA Soft Drink Plastic Bottle Market is witnessing a surge in product innovations focused on enhancing sustainability and functionality. Manufacturers are actively developing lightweight PET bottles, reducing material usage without compromising structural integrity. Advanced barrier technologies are being integrated to extend shelf life and preserve the effervescence of carbonated beverages. The increasing adoption of post-consumer recycled (PCR) PET is a significant trend, allowing for the production of visually appealing and high-performance bottles with a reduced environmental footprint. Unique selling propositions revolve around recyclability, reduced carbon emissions during production, and compliance with evolving environmental regulations, making these bottles more attractive to both brand owners and end consumers.
Key Drivers, Barriers & Challenges in MEA Soft Drink Plastic Bottle Market
Key Drivers:
- Growing Population & Urbanization: A young, expanding population in the MEA region fuels the demand for convenience beverages packaged in plastic bottles.
- Rising Disposable Incomes: Increased purchasing power among consumers translates to higher consumption of packaged soft drinks.
- Technological Advancements: Innovations in lightweighting, material science (e.g., rPET), and barrier technologies enhance product appeal and sustainability.
- Cost-Effectiveness: Plastic bottles offer a cost-effective packaging solution compared to alternatives.
Barriers & Challenges:
- Environmental Concerns & Regulations: Increasing scrutiny over plastic waste and stricter regulations on single-use plastics can impact market growth.
- Fluctuating Raw Material Prices: Volatility in the prices of PET and other polymers can affect production costs and profitability.
- Competition from Substitutes: Glass and aluminum packaging, along with growing interest in reusable systems, pose a competitive threat.
- Infrastructure for Recycling: Inadequate collection and recycling infrastructure in some parts of the MEA region can hinder the circular economy.
Emerging Opportunities in MEA Soft Drink Plastic Bottle Market
Emerging opportunities lie in the development and widespread adoption of advanced recycling technologies, including chemical recycling, to create high-quality rPET for beverage packaging. The increasing consumer preference for sustainable products presents a significant avenue for brands to differentiate themselves by using bottles with higher recycled content. Furthermore, the untapped potential in less developed markets within the MEA region, coupled with strategic partnerships with local beverage manufacturers, offers significant growth prospects. Innovations in smart packaging, offering enhanced traceability and consumer engagement, also present a forward-looking opportunity.
Growth Accelerators in the MEA Soft Drink Plastic Bottle Market Industry
Catalysts driving long-term growth in the MEA Soft Drink Plastic Bottle Market include the relentless pursuit of circular economy solutions through enhanced PET recycling initiatives and the development of bio-based or biodegradable alternatives, although their commercial viability for mass-market soft drinks remains under scrutiny. Strategic partnerships between plastic bottle manufacturers and major beverage companies to co-invest in sustainable packaging solutions are crucial. Market expansion strategies targeting emerging economies within Africa, supported by infrastructure development and evolving consumer lifestyles, will further accelerate growth.
Key Players Shaping the MEA Soft Drink Plastic Bottle Market Market
- Comar LLC
- Plastipak Holdings Inc
- Al Amana Plastic LLC
- Nampak Ltd
- Graham Packaging Company
- Amcor PLC
- Altium Packaging LLC
- Takween Advanced Industries
- Alpha Packaging
- Container Corporation of Canada Ltd
- Gerresheimer AG
- ALPLA Group
Notable Milestones in MEA Soft Drink Plastic Bottle Market Sector
- June 2021: Plastipak Packaging teamed up with anaerobic digestion (AD) operator BioteCH4 to deliver a low carbon solution to power its Clean Tech PET recycling plant. This collaboration aimed to enhance the sustainability of PET recycling operations by utilizing renewable energy sources.
- March 2021: Amcor PLC launched its first fresh milk bottle in Argentina, made with 20% transparent post-consumer recycled (PCR) polyethylene terephthalate (PET) resin. This initiative demonstrated Amcor's commitment to increasing the use of recycled materials in food-grade packaging and supported the positioning of Mastellone's La Serenísima Original milk brand as a natural and sustainable product.
In-Depth MEA Soft Drink Plastic Bottle Market Market Outlook
The MEA Soft Drink Plastic Bottle Market is set for sustained expansion, propelled by innovative advancements in sustainable packaging and a growing consumer consciousness towards environmental responsibility. The strategic integration of higher percentages of recycled PET (rPET) will be a critical growth accelerator, aligning with stringent global and regional environmental mandates. Collaborations between key industry players, including resin suppliers, bottle manufacturers, and beverage brands, will be instrumental in driving forward the adoption of circular economy principles. Furthermore, expanding into new demographic segments and geographical regions within the MEA, supported by robust investment in localized production and distribution networks, will solidify the market's future trajectory.
MEA Soft Drink Plastic Bottle Market Segmentation
-
1. Raw Materials
- 1.1. PET
- 1.2. PP
- 1.3. LDPE
- 1.4. HDPE
- 1.5. Other Raw Materials
-
2. End-user Vertical
- 2.1. Beverages
- 2.2. Food
- 2.3. Cosmetics
- 2.4. Pharmaceuticals
- 2.5. Household Care
- 2.6. Other End-user Verticals
-
3. Geography
- 3.1. United Arab Emirates
- 3.2. Saudi Arabia
- 3.3. Egypt
- 3.4. South Africa
- 3.5. Rest of Middle East and Africa
MEA Soft Drink Plastic Bottle Market Segmentation By Geography
- 1. United Arab Emirates
- 2. Saudi Arabia
- 3. Egypt
- 4. South Africa
- 5. Rest of Middle East and Africa
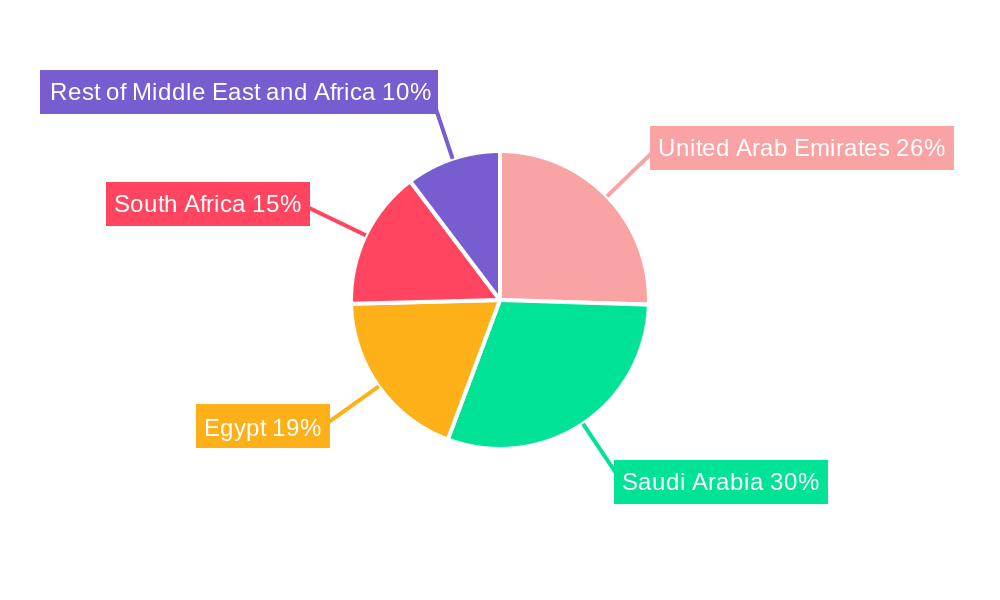
MEA Soft Drink Plastic Bottle Market Regional Market Share
Geographic Coverage of MEA Soft Drink Plastic Bottle Market
MEA Soft Drink Plastic Bottle Market REPORT HIGHLIGHTS
| Aspects | Details |
|---|---|
| Study Period | 2020-2034 |
| Base Year | 2025 |
| Estimated Year | 2026 |
| Forecast Period | 2026-2034 |
| Historical Period | 2020-2025 |
| Growth Rate | CAGR of 3.89% from 2020-2034 |
| Segmentation |
|
Table of Contents
- 1. Introduction
- 1.1. Research Scope
- 1.2. Market Segmentation
- 1.3. Research Objective
- 1.4. Definitions and Assumptions
- 2. Executive Summary
- 2.1. Market Snapshot
- 3. Market Dynamics
- 3.1. Market Drivers
- 3.2. Market Restrains
- 3.3. Market Trends
- 3.4. Market Opportunities
- 4. Market Factor Analysis
- 4.1. Porters Five Forces
- 4.1.1. Bargaining Power of Suppliers
- 4.1.2. Bargaining Power of Buyers
- 4.1.3. Threat of New Entrants
- 4.1.4. Threat of Substitutes
- 4.1.5. Competitive Rivalry
- 4.2. PESTEL analysis
- 4.3. BCG Analysis
- 4.3.1. Stars (High Growth, High Market Share)
- 4.3.2. Cash Cows (Low Growth, High Market Share)
- 4.3.3. Question Mark (High Growth, Low Market Share)
- 4.3.4. Dogs (Low Growth, Low Market Share)
- 4.4. Ansoff Matrix Analysis
- 4.5. Supply Chain Analysis
- 4.6. Regulatory Landscape
- 4.7. Current Market Potential and Opportunity Assessment (TAM–SAM–SOM Framework)
- 4.8. NRP Analyst Note
- 4.1. Porters Five Forces
- 5. Market Analysis, Insights and Forecast 2021-2033
- 5.1. Market Analysis, Insights and Forecast - by Raw Materials
- 5.1.1. PET
- 5.1.2. PP
- 5.1.3. LDPE
- 5.1.4. HDPE
- 5.1.5. Other Raw Materials
- 5.2. Market Analysis, Insights and Forecast - by End-user Vertical
- 5.2.1. Beverages
- 5.2.2. Food
- 5.2.3. Cosmetics
- 5.2.4. Pharmaceuticals
- 5.2.5. Household Care
- 5.2.6. Other End-user Verticals
- 5.3. Market Analysis, Insights and Forecast - by Geography
- 5.3.1. United Arab Emirates
- 5.3.2. Saudi Arabia
- 5.3.3. Egypt
- 5.3.4. South Africa
- 5.3.5. Rest of Middle East and Africa
- 5.4. Market Analysis, Insights and Forecast - by Region
- 5.4.1. United Arab Emirates
- 5.4.2. Saudi Arabia
- 5.4.3. Egypt
- 5.4.4. South Africa
- 5.4.5. Rest of Middle East and Africa
- 5.1. Market Analysis, Insights and Forecast - by Raw Materials
- 6. Global MEA Soft Drink Plastic Bottle Market Analysis, Insights and Forecast, 2021-2033
- 6.1. Market Analysis, Insights and Forecast - by Raw Materials
- 6.1.1. PET
- 6.1.2. PP
- 6.1.3. LDPE
- 6.1.4. HDPE
- 6.1.5. Other Raw Materials
- 6.2. Market Analysis, Insights and Forecast - by End-user Vertical
- 6.2.1. Beverages
- 6.2.2. Food
- 6.2.3. Cosmetics
- 6.2.4. Pharmaceuticals
- 6.2.5. Household Care
- 6.2.6. Other End-user Verticals
- 6.3. Market Analysis, Insights and Forecast - by Geography
- 6.3.1. United Arab Emirates
- 6.3.2. Saudi Arabia
- 6.3.3. Egypt
- 6.3.4. South Africa
- 6.3.5. Rest of Middle East and Africa
- 6.1. Market Analysis, Insights and Forecast - by Raw Materials
- 7. United Arab Emirates MEA Soft Drink Plastic Bottle Market Analysis, Insights and Forecast, 2020-2032
- 7.1. Market Analysis, Insights and Forecast - by Raw Materials
- 7.1.1. PET
- 7.1.2. PP
- 7.1.3. LDPE
- 7.1.4. HDPE
- 7.1.5. Other Raw Materials
- 7.2. Market Analysis, Insights and Forecast - by End-user Vertical
- 7.2.1. Beverages
- 7.2.2. Food
- 7.2.3. Cosmetics
- 7.2.4. Pharmaceuticals
- 7.2.5. Household Care
- 7.2.6. Other End-user Verticals
- 7.3. Market Analysis, Insights and Forecast - by Geography
- 7.3.1. United Arab Emirates
- 7.3.2. Saudi Arabia
- 7.3.3. Egypt
- 7.3.4. South Africa
- 7.3.5. Rest of Middle East and Africa
- 7.1. Market Analysis, Insights and Forecast - by Raw Materials
- 8. Saudi Arabia MEA Soft Drink Plastic Bottle Market Analysis, Insights and Forecast, 2020-2032
- 8.1. Market Analysis, Insights and Forecast - by Raw Materials
- 8.1.1. PET
- 8.1.2. PP
- 8.1.3. LDPE
- 8.1.4. HDPE
- 8.1.5. Other Raw Materials
- 8.2. Market Analysis, Insights and Forecast - by End-user Vertical
- 8.2.1. Beverages
- 8.2.2. Food
- 8.2.3. Cosmetics
- 8.2.4. Pharmaceuticals
- 8.2.5. Household Care
- 8.2.6. Other End-user Verticals
- 8.3. Market Analysis, Insights and Forecast - by Geography
- 8.3.1. United Arab Emirates
- 8.3.2. Saudi Arabia
- 8.3.3. Egypt
- 8.3.4. South Africa
- 8.3.5. Rest of Middle East and Africa
- 8.1. Market Analysis, Insights and Forecast - by Raw Materials
- 9. Egypt MEA Soft Drink Plastic Bottle Market Analysis, Insights and Forecast, 2020-2032
- 9.1. Market Analysis, Insights and Forecast - by Raw Materials
- 9.1.1. PET
- 9.1.2. PP
- 9.1.3. LDPE
- 9.1.4. HDPE
- 9.1.5. Other Raw Materials
- 9.2. Market Analysis, Insights and Forecast - by End-user Vertical
- 9.2.1. Beverages
- 9.2.2. Food
- 9.2.3. Cosmetics
- 9.2.4. Pharmaceuticals
- 9.2.5. Household Care
- 9.2.6. Other End-user Verticals
- 9.3. Market Analysis, Insights and Forecast - by Geography
- 9.3.1. United Arab Emirates
- 9.3.2. Saudi Arabia
- 9.3.3. Egypt
- 9.3.4. South Africa
- 9.3.5. Rest of Middle East and Africa
- 9.1. Market Analysis, Insights and Forecast - by Raw Materials
- 10. South Africa MEA Soft Drink Plastic Bottle Market Analysis, Insights and Forecast, 2020-2032
- 10.1. Market Analysis, Insights and Forecast - by Raw Materials
- 10.1.1. PET
- 10.1.2. PP
- 10.1.3. LDPE
- 10.1.4. HDPE
- 10.1.5. Other Raw Materials
- 10.2. Market Analysis, Insights and Forecast - by End-user Vertical
- 10.2.1. Beverages
- 10.2.2. Food
- 10.2.3. Cosmetics
- 10.2.4. Pharmaceuticals
- 10.2.5. Household Care
- 10.2.6. Other End-user Verticals
- 10.3. Market Analysis, Insights and Forecast - by Geography
- 10.3.1. United Arab Emirates
- 10.3.2. Saudi Arabia
- 10.3.3. Egypt
- 10.3.4. South Africa
- 10.3.5. Rest of Middle East and Africa
- 10.1. Market Analysis, Insights and Forecast - by Raw Materials
- 11. Rest of Middle East and Africa MEA Soft Drink Plastic Bottle Market Analysis, Insights and Forecast, 2020-2032
- 11.1. Market Analysis, Insights and Forecast - by Raw Materials
- 11.1.1. PET
- 11.1.2. PP
- 11.1.3. LDPE
- 11.1.4. HDPE
- 11.1.5. Other Raw Materials
- 11.2. Market Analysis, Insights and Forecast - by End-user Vertical
- 11.2.1. Beverages
- 11.2.2. Food
- 11.2.3. Cosmetics
- 11.2.4. Pharmaceuticals
- 11.2.5. Household Care
- 11.2.6. Other End-user Verticals
- 11.3. Market Analysis, Insights and Forecast - by Geography
- 11.3.1. United Arab Emirates
- 11.3.2. Saudi Arabia
- 11.3.3. Egypt
- 11.3.4. South Africa
- 11.3.5. Rest of Middle East and Africa
- 11.1. Market Analysis, Insights and Forecast - by Raw Materials
- 12. Competitive Analysis
- 12.1. Company Profiles
- 12.1.1 Comar LLC
- 12.1.1.1. Company Overview
- 12.1.1.2. Products
- 12.1.1.3. Company Financials
- 12.1.1.4. SWOT Analysis
- 12.1.2 Plastipak Holdings Inc
- 12.1.2.1. Company Overview
- 12.1.2.2. Products
- 12.1.2.3. Company Financials
- 12.1.2.4. SWOT Analysis
- 12.1.3 Al Amana Plastic LLC
- 12.1.3.1. Company Overview
- 12.1.3.2. Products
- 12.1.3.3. Company Financials
- 12.1.3.4. SWOT Analysis
- 12.1.4 Nampak Ltd
- 12.1.4.1. Company Overview
- 12.1.4.2. Products
- 12.1.4.3. Company Financials
- 12.1.4.4. SWOT Analysis
- 12.1.5 Graham Packaging Company
- 12.1.5.1. Company Overview
- 12.1.5.2. Products
- 12.1.5.3. Company Financials
- 12.1.5.4. SWOT Analysis
- 12.1.6 Amcor PLC
- 12.1.6.1. Company Overview
- 12.1.6.2. Products
- 12.1.6.3. Company Financials
- 12.1.6.4. SWOT Analysis
- 12.1.7 Altium Packaging LLC
- 12.1.7.1. Company Overview
- 12.1.7.2. Products
- 12.1.7.3. Company Financials
- 12.1.7.4. SWOT Analysis
- 12.1.8 Takween Advanced Industries*List Not Exhaustive
- 12.1.8.1. Company Overview
- 12.1.8.2. Products
- 12.1.8.3. Company Financials
- 12.1.8.4. SWOT Analysis
- 12.1.9 Alpha Packaging
- 12.1.9.1. Company Overview
- 12.1.9.2. Products
- 12.1.9.3. Company Financials
- 12.1.9.4. SWOT Analysis
- 12.1.10 Container Corporation of Canada Ltd
- 12.1.10.1. Company Overview
- 12.1.10.2. Products
- 12.1.10.3. Company Financials
- 12.1.10.4. SWOT Analysis
- 12.1.11 Gerresheimer AG
- 12.1.11.1. Company Overview
- 12.1.11.2. Products
- 12.1.11.3. Company Financials
- 12.1.11.4. SWOT Analysis
- 12.1.12 ALPLA Group
- 12.1.12.1. Company Overview
- 12.1.12.2. Products
- 12.1.12.3. Company Financials
- 12.1.12.4. SWOT Analysis
- 12.1.1 Comar LLC
- 12.2. Market Entropy
- 12.2.1 Company's Key Areas Served
- 12.2.2 Recent Developments
- 12.3. Company Market Share Analysis 2025
- 12.3.1 Top 5 Companies Market Share Analysis
- 12.3.2 Top 3 Companies Market Share Analysis
- 12.4. List of Potential Customers
- 13. Research Methodology
List of Figures
- Figure 1: Global MEA Soft Drink Plastic Bottle Market Revenue Breakdown (billion, %) by Region 2025 & 2033
- Figure 2: United Arab Emirates MEA Soft Drink Plastic Bottle Market Revenue (billion), by Raw Materials 2025 & 2033
- Figure 3: United Arab Emirates MEA Soft Drink Plastic Bottle Market Revenue Share (%), by Raw Materials 2025 & 2033
- Figure 4: United Arab Emirates MEA Soft Drink Plastic Bottle Market Revenue (billion), by End-user Vertical 2025 & 2033
- Figure 5: United Arab Emirates MEA Soft Drink Plastic Bottle Market Revenue Share (%), by End-user Vertical 2025 & 2033
- Figure 6: United Arab Emirates MEA Soft Drink Plastic Bottle Market Revenue (billion), by Geography 2025 & 2033
- Figure 7: United Arab Emirates MEA Soft Drink Plastic Bottle Market Revenue Share (%), by Geography 2025 & 2033
- Figure 8: United Arab Emirates MEA Soft Drink Plastic Bottle Market Revenue (billion), by Country 2025 & 2033
- Figure 9: United Arab Emirates MEA Soft Drink Plastic Bottle Market Revenue Share (%), by Country 2025 & 2033
- Figure 10: Saudi Arabia MEA Soft Drink Plastic Bottle Market Revenue (billion), by Raw Materials 2025 & 2033
- Figure 11: Saudi Arabia MEA Soft Drink Plastic Bottle Market Revenue Share (%), by Raw Materials 2025 & 2033
- Figure 12: Saudi Arabia MEA Soft Drink Plastic Bottle Market Revenue (billion), by End-user Vertical 2025 & 2033
- Figure 13: Saudi Arabia MEA Soft Drink Plastic Bottle Market Revenue Share (%), by End-user Vertical 2025 & 2033
- Figure 14: Saudi Arabia MEA Soft Drink Plastic Bottle Market Revenue (billion), by Geography 2025 & 2033
- Figure 15: Saudi Arabia MEA Soft Drink Plastic Bottle Market Revenue Share (%), by Geography 2025 & 2033
- Figure 16: Saudi Arabia MEA Soft Drink Plastic Bottle Market Revenue (billion), by Country 2025 & 2033
- Figure 17: Saudi Arabia MEA Soft Drink Plastic Bottle Market Revenue Share (%), by Country 2025 & 2033
- Figure 18: Egypt MEA Soft Drink Plastic Bottle Market Revenue (billion), by Raw Materials 2025 & 2033
- Figure 19: Egypt MEA Soft Drink Plastic Bottle Market Revenue Share (%), by Raw Materials 2025 & 2033
- Figure 20: Egypt MEA Soft Drink Plastic Bottle Market Revenue (billion), by End-user Vertical 2025 & 2033
- Figure 21: Egypt MEA Soft Drink Plastic Bottle Market Revenue Share (%), by End-user Vertical 2025 & 2033
- Figure 22: Egypt MEA Soft Drink Plastic Bottle Market Revenue (billion), by Geography 2025 & 2033
- Figure 23: Egypt MEA Soft Drink Plastic Bottle Market Revenue Share (%), by Geography 2025 & 2033
- Figure 24: Egypt MEA Soft Drink Plastic Bottle Market Revenue (billion), by Country 2025 & 2033
- Figure 25: Egypt MEA Soft Drink Plastic Bottle Market Revenue Share (%), by Country 2025 & 2033
- Figure 26: South Africa MEA Soft Drink Plastic Bottle Market Revenue (billion), by Raw Materials 2025 & 2033
- Figure 27: South Africa MEA Soft Drink Plastic Bottle Market Revenue Share (%), by Raw Materials 2025 & 2033
- Figure 28: South Africa MEA Soft Drink Plastic Bottle Market Revenue (billion), by End-user Vertical 2025 & 2033
- Figure 29: South Africa MEA Soft Drink Plastic Bottle Market Revenue Share (%), by End-user Vertical 2025 & 2033
- Figure 30: South Africa MEA Soft Drink Plastic Bottle Market Revenue (billion), by Geography 2025 & 2033
- Figure 31: South Africa MEA Soft Drink Plastic Bottle Market Revenue Share (%), by Geography 2025 & 2033
- Figure 32: South Africa MEA Soft Drink Plastic Bottle Market Revenue (billion), by Country 2025 & 2033
- Figure 33: South Africa MEA Soft Drink Plastic Bottle Market Revenue Share (%), by Country 2025 & 2033
- Figure 34: Rest of Middle East and Africa MEA Soft Drink Plastic Bottle Market Revenue (billion), by Raw Materials 2025 & 2033
- Figure 35: Rest of Middle East and Africa MEA Soft Drink Plastic Bottle Market Revenue Share (%), by Raw Materials 2025 & 2033
- Figure 36: Rest of Middle East and Africa MEA Soft Drink Plastic Bottle Market Revenue (billion), by End-user Vertical 2025 & 2033
- Figure 37: Rest of Middle East and Africa MEA Soft Drink Plastic Bottle Market Revenue Share (%), by End-user Vertical 2025 & 2033
- Figure 38: Rest of Middle East and Africa MEA Soft Drink Plastic Bottle Market Revenue (billion), by Geography 2025 & 2033
- Figure 39: Rest of Middle East and Africa MEA Soft Drink Plastic Bottle Market Revenue Share (%), by Geography 2025 & 2033
- Figure 40: Rest of Middle East and Africa MEA Soft Drink Plastic Bottle Market Revenue (billion), by Country 2025 & 2033
- Figure 41: Rest of Middle East and Africa MEA Soft Drink Plastic Bottle Market Revenue Share (%), by Country 2025 & 2033
List of Tables
- Table 1: Global MEA Soft Drink Plastic Bottle Market Revenue billion Forecast, by Raw Materials 2020 & 2033
- Table 2: Global MEA Soft Drink Plastic Bottle Market Revenue billion Forecast, by End-user Vertical 2020 & 2033
- Table 3: Global MEA Soft Drink Plastic Bottle Market Revenue billion Forecast, by Geography 2020 & 2033
- Table 4: Global MEA Soft Drink Plastic Bottle Market Revenue billion Forecast, by Region 2020 & 2033
- Table 5: Global MEA Soft Drink Plastic Bottle Market Revenue billion Forecast, by Raw Materials 2020 & 2033
- Table 6: Global MEA Soft Drink Plastic Bottle Market Revenue billion Forecast, by End-user Vertical 2020 & 2033
- Table 7: Global MEA Soft Drink Plastic Bottle Market Revenue billion Forecast, by Geography 2020 & 2033
- Table 8: Global MEA Soft Drink Plastic Bottle Market Revenue billion Forecast, by Country 2020 & 2033
- Table 9: Global MEA Soft Drink Plastic Bottle Market Revenue billion Forecast, by Raw Materials 2020 & 2033
- Table 10: Global MEA Soft Drink Plastic Bottle Market Revenue billion Forecast, by End-user Vertical 2020 & 2033
- Table 11: Global MEA Soft Drink Plastic Bottle Market Revenue billion Forecast, by Geography 2020 & 2033
- Table 12: Global MEA Soft Drink Plastic Bottle Market Revenue billion Forecast, by Country 2020 & 2033
- Table 13: Global MEA Soft Drink Plastic Bottle Market Revenue billion Forecast, by Raw Materials 2020 & 2033
- Table 14: Global MEA Soft Drink Plastic Bottle Market Revenue billion Forecast, by End-user Vertical 2020 & 2033
- Table 15: Global MEA Soft Drink Plastic Bottle Market Revenue billion Forecast, by Geography 2020 & 2033
- Table 16: Global MEA Soft Drink Plastic Bottle Market Revenue billion Forecast, by Country 2020 & 2033
- Table 17: Global MEA Soft Drink Plastic Bottle Market Revenue billion Forecast, by Raw Materials 2020 & 2033
- Table 18: Global MEA Soft Drink Plastic Bottle Market Revenue billion Forecast, by End-user Vertical 2020 & 2033
- Table 19: Global MEA Soft Drink Plastic Bottle Market Revenue billion Forecast, by Geography 2020 & 2033
- Table 20: Global MEA Soft Drink Plastic Bottle Market Revenue billion Forecast, by Country 2020 & 2033
- Table 21: Global MEA Soft Drink Plastic Bottle Market Revenue billion Forecast, by Raw Materials 2020 & 2033
- Table 22: Global MEA Soft Drink Plastic Bottle Market Revenue billion Forecast, by End-user Vertical 2020 & 2033
- Table 23: Global MEA Soft Drink Plastic Bottle Market Revenue billion Forecast, by Geography 2020 & 2033
- Table 24: Global MEA Soft Drink Plastic Bottle Market Revenue billion Forecast, by Country 2020 & 2033
Frequently Asked Questions
1. What is the projected Compound Annual Growth Rate (CAGR) of the MEA Soft Drink Plastic Bottle Market?
The projected CAGR is approximately 3.89%.
2. Which companies are prominent players in the MEA Soft Drink Plastic Bottle Market?
Key companies in the market include Comar LLC, Plastipak Holdings Inc, Al Amana Plastic LLC, Nampak Ltd, Graham Packaging Company, Amcor PLC, Altium Packaging LLC, Takween Advanced Industries*List Not Exhaustive, Alpha Packaging, Container Corporation of Canada Ltd, Gerresheimer AG, ALPLA Group.
3. What are the main segments of the MEA Soft Drink Plastic Bottle Market?
The market segments include Raw Materials, End-user Vertical, Geography.
4. Can you provide details about the market size?
The market size is estimated to be USD 2.43 billion as of 2022.
5. What are some drivers contributing to market growth?
Increasing Adoption of Lightweight Packaging Methods.
6. What are the notable trends driving market growth?
Food and Beverage Industry is Expected to Witness Significant Growth.
7. Are there any restraints impacting market growth?
Environmental Concerns Regarding Use of Plastics.
8. Can you provide examples of recent developments in the market?
June 2021 - Plastipak Packaging has teamed up with anaerobic digestion (AD) operator BioteCH4 to deliver a low carbon solution to power its Clean Tech PET recycling plant. Based in Hemswell, Lincolnshire, BioteCH4 operates an anaerobic digestion plant, recycling over 90,000 tonnes of food waste per year.
9. What pricing options are available for accessing the report?
Pricing options include single-user, multi-user, and enterprise licenses priced at USD 4750, USD 5250, and USD 8750 respectively.
10. Is the market size provided in terms of value or volume?
The market size is provided in terms of value, measured in billion.
11. Are there any specific market keywords associated with the report?
Yes, the market keyword associated with the report is "MEA Soft Drink Plastic Bottle Market," which aids in identifying and referencing the specific market segment covered.
12. How do I determine which pricing option suits my needs best?
The pricing options vary based on user requirements and access needs. Individual users may opt for single-user licenses, while businesses requiring broader access may choose multi-user or enterprise licenses for cost-effective access to the report.
13. Are there any additional resources or data provided in the MEA Soft Drink Plastic Bottle Market report?
While the report offers comprehensive insights, it's advisable to review the specific contents or supplementary materials provided to ascertain if additional resources or data are available.
14. How can I stay updated on further developments or reports in the MEA Soft Drink Plastic Bottle Market?
To stay informed about further developments, trends, and reports in the MEA Soft Drink Plastic Bottle Market, consider subscribing to industry newsletters, following relevant companies and organizations, or regularly checking reputable industry news sources and publications.
Methodology
Step 1 - Identification of Relevant Samples Size from Population Database


Step 2 - Approaches for Defining Global Market Size (Value, Volume* & Price*)

Note*: In applicable scenarios
Step 3 - Data Sources
Primary Research
- Web Analytics
- Survey Reports
- Research Institute
- Latest Research Reports
- Opinion Leaders
Secondary Research
- Annual Reports
- White Paper
- Latest Press Release
- Industry Association
- Paid Database
- Investor Presentations

Step 4 - Data Triangulation
Involves using different sources of information in order to increase the validity of a study
These sources are likely to be stakeholders in a program - participants, other researchers, program staff, other community members, and so on.
Then we put all data in single framework & apply various statistical tools to find out the dynamic on the market.
During the analysis stage, feedback from the stakeholder groups would be compared to determine areas of agreement as well as areas of divergence