

Key Insights
The nanotechnology industry is experiencing robust growth, projected to reach a significant market size driven by advancements in drug delivery, biomaterials, and diagnostics. The Compound Annual Growth Rate (CAGR) of 11.90% from 2019-2033 signifies considerable market expansion, fueled by increasing demand for effective treatments across various disease areas. The application segments, particularly drug delivery systems leveraging targeted therapies and enhanced bioavailability, are major contributors to this growth. The rising prevalence of chronic diseases like cardiovascular diseases, oncological diseases, and neurological disorders is a key driver, as nanotechnology offers promising solutions for improved diagnostics and therapeutics. Further driving market expansion is the development of novel biomaterials with enhanced properties for implants and tissue regeneration, alongside the ongoing research into advanced diagnostic imaging techniques that offer greater precision and sensitivity. While regulatory hurdles and high research and development costs pose some challenges, the potential benefits of nanotechnology in healthcare are undeniable, creating a positive outlook for sustained growth throughout the forecast period.
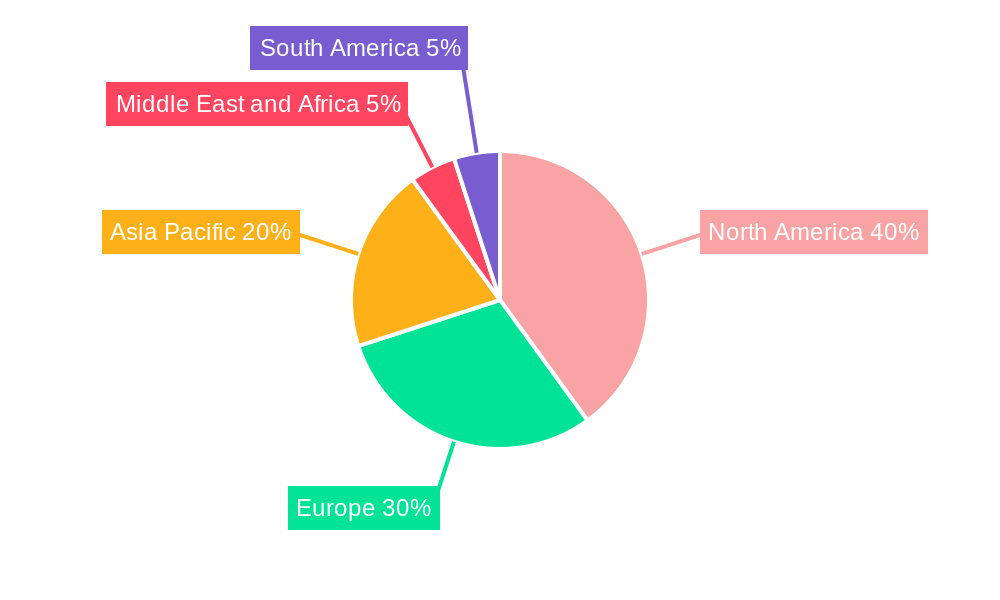
Significant regional variations in market share are anticipated. North America and Europe, with their established healthcare infrastructure and robust research capabilities, currently dominate the market. However, Asia Pacific is poised for rapid expansion, fueled by increasing healthcare spending, growing adoption of advanced medical technologies, and a burgeoning pharmaceutical industry. The competitive landscape features a mix of large pharmaceutical companies and specialized nanotechnology firms, fostering innovation and collaborative partnerships. This collaborative approach is crucial for translating research into commercially viable products, thereby further bolstering the overall growth trajectory of the nanotechnology industry in the healthcare sector. The ongoing investments in research and development, coupled with strategic alliances and acquisitions, will ensure the continued expansion of this dynamic sector, creating significant opportunities for both established players and emerging companies.
Nanotechnology Industry Market Report: 2019-2033
This comprehensive report provides an in-depth analysis of the nanotechnology industry, encompassing market dynamics, growth trends, regional dominance, product landscape, challenges, opportunities, and key players. With a focus on the medical nanotechnology sector, the report covers the period 2019-2033, utilizing 2025 as the base and estimated year. The report projects a market value of xx Million by 2033.
Nanotechnology Industry Market Dynamics & Structure
The global nanotechnology industry, specifically within the medical sector, is characterized by a moderately fragmented market structure. Market concentration is influenced by the diverse range of applications and the continuous influx of innovative players. Technological innovation, driven by advancements in materials science, drug delivery systems, and diagnostic imaging, is a key growth driver. Stringent regulatory frameworks, particularly for medical applications, pose both challenges and opportunities, necessitating rigorous testing and approvals. Competitive pressures arise from both established pharmaceutical companies and emerging nanotechnology firms. The increasing demand for personalized medicine and targeted therapies fuels market expansion. Mergers and acquisitions (M&A) activity is significant, with larger players acquiring smaller companies with specialized nanotechnology platforms.
- Market Concentration: Moderately Fragmented (HHI xx)
- Technological Innovation Drivers: Advancements in materials science, drug delivery, diagnostics.
- Regulatory Frameworks: Stringent regulations impacting time-to-market and cost.
- Competitive Product Substitutes: Traditional therapies and alternative diagnostic tools.
- End-User Demographics: Growing geriatric population, increased prevalence of chronic diseases.
- M&A Trends: Significant activity, driven by technological acquisition and market consolidation (xx deals in 2024).
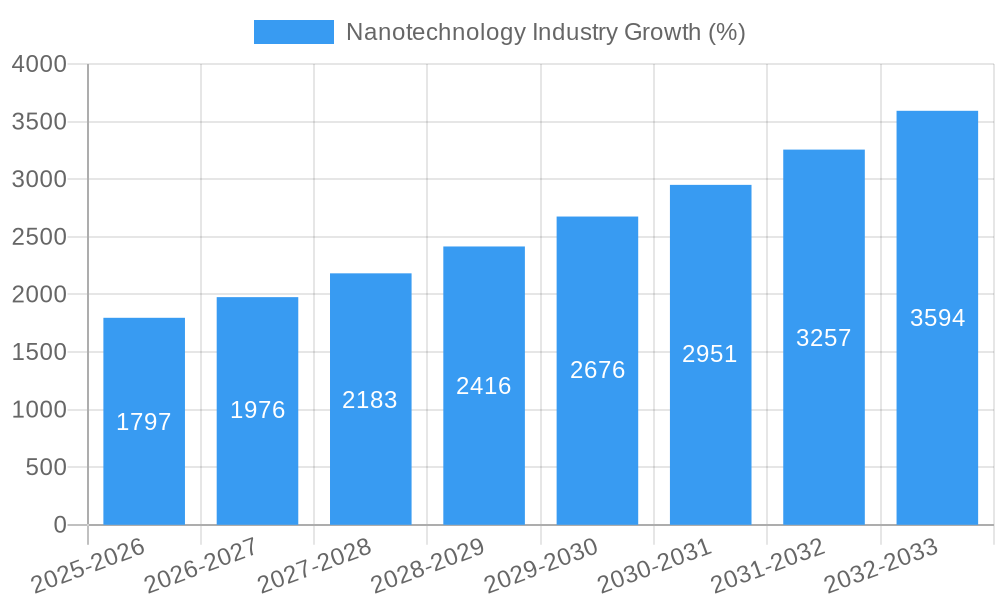
Nanotechnology Industry Growth Trends & Insights
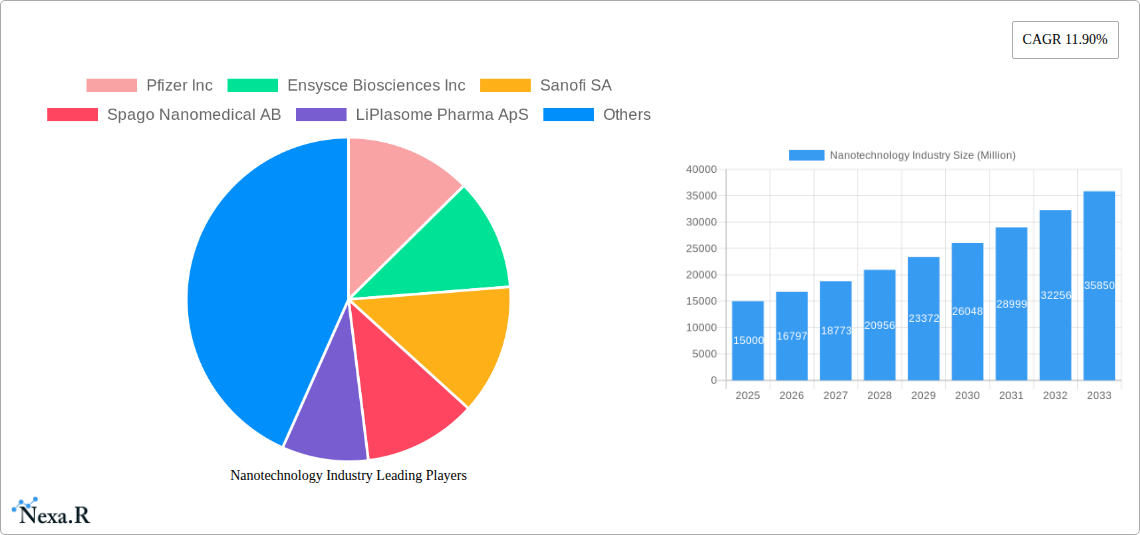
The nanotechnology industry exhibits robust growth, driven by the increasing adoption of nanomaterials in various medical applications. The market is witnessing a steady increase in the number of nanotechnology-based products receiving regulatory approvals, further accelerating market penetration. Technological disruptions, particularly in areas like targeted drug delivery and advanced imaging techniques, are transforming healthcare practices. A shift in consumer behavior towards personalized and effective treatments contributes to the growth. The CAGR for the period 2025-2033 is projected to be xx%, reaching a market value of xx Million by 2033. Market penetration is increasing across various disease segments, with a focus on unmet clinical needs.
Dominant Regions, Countries, or Segments in Nanotechnology Industry
North America currently dominates the medical nanotechnology market, driven by robust R&D investments, a well-established healthcare infrastructure, and the presence of major pharmaceutical and biotechnology companies. Europe is also a significant market with substantial government funding and a strong focus on nanomedicine research. Within the application segments, Drug Delivery holds the largest market share, owing to its wide applicability in treating various diseases. Oncological Diseases constitute a major disease segment due to the high prevalence and unmet needs in cancer therapy.
- Key Drivers (North America): High R&D investment, advanced healthcare infrastructure, strong regulatory support.
- Key Drivers (Europe): Government funding, collaborative research initiatives, focus on nanomedicine innovation.
- Dominant Application Segment: Drug Delivery (xx% market share in 2025)
- Dominant Disease Segment: Oncological Diseases (xx% market share in 2025)
Nanotechnology Industry Product Landscape
The nanotechnology industry offers a diverse range of products, including targeted drug delivery systems, advanced biomaterials for tissue engineering, and high-resolution diagnostic imaging agents. These products leverage unique nanomaterial properties such as high surface area, biocompatibility, and targeted functionality to achieve superior performance compared to conventional methods. Continuous innovations are leading to the development of more effective and safer nanotechnology-based therapies and diagnostic tools. Unique selling propositions include enhanced efficacy, reduced toxicity, and personalized treatment approaches.
Key Drivers, Barriers & Challenges in Nanotechnology Industry
Key Drivers:
- Increasing prevalence of chronic diseases.
- Growing demand for personalized medicine.
- Technological advancements in nanomaterials and drug delivery systems.
- Significant government funding and industry investment.
Key Challenges & Restraints:
- High R&D costs and long regulatory approval pathways.
- Concerns regarding the toxicity and long-term effects of nanomaterials.
- Lack of standardization and quality control for nanomaterials.
- Competitive pressures from established pharmaceutical companies.
- Supply chain complexities (xx% increase in material cost predicted by 2030).
Emerging Opportunities in Nanotechnology Industry
- Expanding applications in theranostics (combining diagnostics and therapeutics).
- Development of novel nanomaterials with enhanced properties.
- Increased focus on nanotechnology-based point-of-care diagnostics.
- Growing demand for personalized nanomedicine solutions.
- Exploration of nanotechnology for disease prevention and early detection.
Growth Accelerators in the Nanotechnology Industry
Technological breakthroughs in areas such as targeted drug delivery and advanced imaging continue to propel market growth. Strategic partnerships between pharmaceutical companies and nanotechnology firms enhance innovation and facilitate faster product commercialization. Market expansion into new therapeutic areas and geographical regions further fuels industry expansion.
Key Players Shaping the Nanotechnology Industry Market
- Pfizer Inc
- Ensysce Biosciences Inc
- Sanofi SA
- Spago Nanomedical AB
- LiPlasome Pharma ApS
- CytImmune Sciences
- Genetic Immunity
- NanoCarrier Co Ltd
- Copernicus Therapeutics Inc
- Merck & Co Inc
- Nanobiotix
- Nanospectra Biosciences
- CytImmune Sciences Inc
- Starpharma Holdings Limited
- Nami Therapeutics Corp
- Taiwan Liposome Company Ltd
- Johnson & Johnson
- Ocuphire Pharma Inc
- Luminex Corporation
- Bristol-Myers Squibb Company
Notable Milestones in Nanotechnology Industry Sector
- January 2022: NaNotics LLC research collaboration with Mayo Clinic to develop a NaNot targeting soluble PD-L1.
- March 2021: EUR 12 million in funding for advancements in European medical nanotechnology (Barcelona & Manchester collaboration).
In-Depth Nanotechnology Industry Market Outlook
The nanotechnology industry is poised for significant growth over the next decade, driven by continuous innovation and expanding applications. Strategic partnerships and investments in R&D will further accelerate market expansion. Emerging opportunities in personalized medicine and theranostics present substantial potential for future market growth. Companies focusing on innovative nanomaterials and advanced drug delivery systems are expected to lead the market.
Nanotechnology Industry Segmentation
-
1. Application
- 1.1. Drug Delivery
- 1.2. Biomaterials
- 1.3. Active Implants
- 1.4. Diagnostic Imaging
- 1.5. Tissue Regeneration
-
2. Disease
- 2.1. Cardiovascular Diseases
- 2.2. Oncological Diseases
- 2.3. Neurological Diseases
- 2.4. Orthopedic Diseases
- 2.5. Infectious Diseases
- 2.6. Other Diseases
Nanotechnology Industry Segmentation By Geography
-
1. North America
- 1.1. United States
- 1.2. Canada
- 1.3. Mexico
-
2. Europe
- 2.1. France
- 2.2. Germany
- 2.3. United Kingdom
- 2.4. Italy
- 2.5. Spain
- 2.6. Rest of Europe
-
3. Asia Pacific
- 3.1. China
- 3.2. Japan
- 3.3. India
- 3.4. Australia
- 3.5. South Korea
- 3.6. Rest of Asia Pacific
-
4. Middle East and Africa
- 4.1. GCC
- 4.2. South Africa
- 4.3. Rest of Middle East and Africa
-
5. South America
- 5.1. Brazil
- 5.2. Argentina
- 5.3. Rest of South America
Nanotechnology Industry REPORT HIGHLIGHTS
| Aspects | Details |
|---|---|
| Study Period | 2019-2033 |
| Base Year | 2024 |
| Estimated Year | 2025 |
| Forecast Period | 2025-2033 |
| Historical Period | 2019-2024 |
| Growth Rate | CAGR of 11.90% from 2019-2033 |
| Segmentation |
|
Table of Contents
- 1. Introduction
- 1.1. Research Scope
- 1.2. Market Segmentation
- 1.3. Research Methodology
- 1.4. Definitions and Assumptions
- 2. Executive Summary
- 2.1. Introduction
- 3. Market Dynamics
- 3.1. Introduction
- 3.2. Market Drivers
- 3.2.1. Growing Prevalence of Cancer and Genetic and Cardiovascular Diseases; Increasing Advancements in Nanoscale Technologies for Diagnostic Procedures; Growing Preference for Personalized Medicines
- 3.3. Market Restrains
- 3.3.1. High Costs; Stringent Regulations for Commercial Introduction
- 3.4. Market Trends
- 3.4.1. The Oncological Diseases Segment is Expected to Show Better Growth During the Forecast Period
- 4. Market Factor Analysis
- 4.1. Porters Five Forces
- 4.2. Supply/Value Chain
- 4.3. PESTEL analysis
- 4.4. Market Entropy
- 4.5. Patent/Trademark Analysis
- 5. Global Nanotechnology Industry Analysis, Insights and Forecast, 2019-2031
- 5.1. Market Analysis, Insights and Forecast - by Application
- 5.1.1. Drug Delivery
- 5.1.2. Biomaterials
- 5.1.3. Active Implants
- 5.1.4. Diagnostic Imaging
- 5.1.5. Tissue Regeneration
- 5.2. Market Analysis, Insights and Forecast - by Disease
- 5.2.1. Cardiovascular Diseases
- 5.2.2. Oncological Diseases
- 5.2.3. Neurological Diseases
- 5.2.4. Orthopedic Diseases
- 5.2.5. Infectious Diseases
- 5.2.6. Other Diseases
- 5.3. Market Analysis, Insights and Forecast - by Region
- 5.3.1. North America
- 5.3.2. Europe
- 5.3.3. Asia Pacific
- 5.3.4. Middle East and Africa
- 5.3.5. South America
- 5.1. Market Analysis, Insights and Forecast - by Application
- 6. North America Nanotechnology Industry Analysis, Insights and Forecast, 2019-2031
- 6.1. Market Analysis, Insights and Forecast - by Application
- 6.1.1. Drug Delivery
- 6.1.2. Biomaterials
- 6.1.3. Active Implants
- 6.1.4. Diagnostic Imaging
- 6.1.5. Tissue Regeneration
- 6.2. Market Analysis, Insights and Forecast - by Disease
- 6.2.1. Cardiovascular Diseases
- 6.2.2. Oncological Diseases
- 6.2.3. Neurological Diseases
- 6.2.4. Orthopedic Diseases
- 6.2.5. Infectious Diseases
- 6.2.6. Other Diseases
- 6.1. Market Analysis, Insights and Forecast - by Application
- 7. Europe Nanotechnology Industry Analysis, Insights and Forecast, 2019-2031
- 7.1. Market Analysis, Insights and Forecast - by Application
- 7.1.1. Drug Delivery
- 7.1.2. Biomaterials
- 7.1.3. Active Implants
- 7.1.4. Diagnostic Imaging
- 7.1.5. Tissue Regeneration
- 7.2. Market Analysis, Insights and Forecast - by Disease
- 7.2.1. Cardiovascular Diseases
- 7.2.2. Oncological Diseases
- 7.2.3. Neurological Diseases
- 7.2.4. Orthopedic Diseases
- 7.2.5. Infectious Diseases
- 7.2.6. Other Diseases
- 7.1. Market Analysis, Insights and Forecast - by Application
- 8. Asia Pacific Nanotechnology Industry Analysis, Insights and Forecast, 2019-2031
- 8.1. Market Analysis, Insights and Forecast - by Application
- 8.1.1. Drug Delivery
- 8.1.2. Biomaterials
- 8.1.3. Active Implants
- 8.1.4. Diagnostic Imaging
- 8.1.5. Tissue Regeneration
- 8.2. Market Analysis, Insights and Forecast - by Disease
- 8.2.1. Cardiovascular Diseases
- 8.2.2. Oncological Diseases
- 8.2.3. Neurological Diseases
- 8.2.4. Orthopedic Diseases
- 8.2.5. Infectious Diseases
- 8.2.6. Other Diseases
- 8.1. Market Analysis, Insights and Forecast - by Application
- 9. Middle East and Africa Nanotechnology Industry Analysis, Insights and Forecast, 2019-2031
- 9.1. Market Analysis, Insights and Forecast - by Application
- 9.1.1. Drug Delivery
- 9.1.2. Biomaterials
- 9.1.3. Active Implants
- 9.1.4. Diagnostic Imaging
- 9.1.5. Tissue Regeneration
- 9.2. Market Analysis, Insights and Forecast - by Disease
- 9.2.1. Cardiovascular Diseases
- 9.2.2. Oncological Diseases
- 9.2.3. Neurological Diseases
- 9.2.4. Orthopedic Diseases
- 9.2.5. Infectious Diseases
- 9.2.6. Other Diseases
- 9.1. Market Analysis, Insights and Forecast - by Application
- 10. South America Nanotechnology Industry Analysis, Insights and Forecast, 2019-2031
- 10.1. Market Analysis, Insights and Forecast - by Application
- 10.1.1. Drug Delivery
- 10.1.2. Biomaterials
- 10.1.3. Active Implants
- 10.1.4. Diagnostic Imaging
- 10.1.5. Tissue Regeneration
- 10.2. Market Analysis, Insights and Forecast - by Disease
- 10.2.1. Cardiovascular Diseases
- 10.2.2. Oncological Diseases
- 10.2.3. Neurological Diseases
- 10.2.4. Orthopedic Diseases
- 10.2.5. Infectious Diseases
- 10.2.6. Other Diseases
- 10.1. Market Analysis, Insights and Forecast - by Application
- 11. North America Nanotechnology Industry Analysis, Insights and Forecast, 2019-2031
- 11.1. Market Analysis, Insights and Forecast - By Country/Sub-region
- 11.1.1 United States
- 11.1.2 Canada
- 11.1.3 Mexico
- 12. Europe Nanotechnology Industry Analysis, Insights and Forecast, 2019-2031
- 12.1. Market Analysis, Insights and Forecast - By Country/Sub-region
- 12.1.1 France
- 12.1.2 Germany
- 12.1.3 United Kingdom
- 12.1.4 Italy
- 12.1.5 Spain
- 12.1.6 Rest of Europe
- 13. Asia Pacific Nanotechnology Industry Analysis, Insights and Forecast, 2019-2031
- 13.1. Market Analysis, Insights and Forecast - By Country/Sub-region
- 13.1.1 China
- 13.1.2 Japan
- 13.1.3 India
- 13.1.4 Australia
- 13.1.5 South Korea
- 13.1.6 Rest of Asia Pacific
- 14. Middle East and Africa Nanotechnology Industry Analysis, Insights and Forecast, 2019-2031
- 14.1. Market Analysis, Insights and Forecast - By Country/Sub-region
- 14.1.1 GCC
- 14.1.2 South Africa
- 14.1.3 Rest of Middle East and Africa
- 15. South America Nanotechnology Industry Analysis, Insights and Forecast, 2019-2031
- 15.1. Market Analysis, Insights and Forecast - By Country/Sub-region
- 15.1.1 Brazil
- 15.1.2 Argentina
- 15.1.3 Rest of South America
- 16. Competitive Analysis
- 16.1. Global Market Share Analysis 2024
- 16.2. Company Profiles
- 16.2.1 Pfizer Inc
- 16.2.1.1. Overview
- 16.2.1.2. Products
- 16.2.1.3. SWOT Analysis
- 16.2.1.4. Recent Developments
- 16.2.1.5. Financials (Based on Availability)
- 16.2.2 Ensysce Biosciences Inc
- 16.2.2.1. Overview
- 16.2.2.2. Products
- 16.2.2.3. SWOT Analysis
- 16.2.2.4. Recent Developments
- 16.2.2.5. Financials (Based on Availability)
- 16.2.3 Sanofi SA
- 16.2.3.1. Overview
- 16.2.3.2. Products
- 16.2.3.3. SWOT Analysis
- 16.2.3.4. Recent Developments
- 16.2.3.5. Financials (Based on Availability)
- 16.2.4 Spago Nanomedical AB
- 16.2.4.1. Overview
- 16.2.4.2. Products
- 16.2.4.3. SWOT Analysis
- 16.2.4.4. Recent Developments
- 16.2.4.5. Financials (Based on Availability)
- 16.2.5 LiPlasome Pharma ApS
- 16.2.5.1. Overview
- 16.2.5.2. Products
- 16.2.5.3. SWOT Analysis
- 16.2.5.4. Recent Developments
- 16.2.5.5. Financials (Based on Availability)
- 16.2.6 CytImmune Sciences
- 16.2.6.1. Overview
- 16.2.6.2. Products
- 16.2.6.3. SWOT Analysis
- 16.2.6.4. Recent Developments
- 16.2.6.5. Financials (Based on Availability)
- 16.2.7 Genetic Immunity
- 16.2.7.1. Overview
- 16.2.7.2. Products
- 16.2.7.3. SWOT Analysis
- 16.2.7.4. Recent Developments
- 16.2.7.5. Financials (Based on Availability)
- 16.2.8 NanoCarrier Co Ltd
- 16.2.8.1. Overview
- 16.2.8.2. Products
- 16.2.8.3. SWOT Analysis
- 16.2.8.4. Recent Developments
- 16.2.8.5. Financials (Based on Availability)
- 16.2.9 Copernicus Therapeutics Inc
- 16.2.9.1. Overview
- 16.2.9.2. Products
- 16.2.9.3. SWOT Analysis
- 16.2.9.4. Recent Developments
- 16.2.9.5. Financials (Based on Availability)
- 16.2.10 Merck & Co Inc
- 16.2.10.1. Overview
- 16.2.10.2. Products
- 16.2.10.3. SWOT Analysis
- 16.2.10.4. Recent Developments
- 16.2.10.5. Financials (Based on Availability)
- 16.2.11 Nanobiotix
- 16.2.11.1. Overview
- 16.2.11.2. Products
- 16.2.11.3. SWOT Analysis
- 16.2.11.4. Recent Developments
- 16.2.11.5. Financials (Based on Availability)
- 16.2.12 Nanospectra Biosciences
- 16.2.12.1. Overview
- 16.2.12.2. Products
- 16.2.12.3. SWOT Analysis
- 16.2.12.4. Recent Developments
- 16.2.12.5. Financials (Based on Availability)
- 16.2.13 CytImmune Sciences Inc
- 16.2.13.1. Overview
- 16.2.13.2. Products
- 16.2.13.3. SWOT Analysis
- 16.2.13.4. Recent Developments
- 16.2.13.5. Financials (Based on Availability)
- 16.2.14 Starpharma Holdings Limited
- 16.2.14.1. Overview
- 16.2.14.2. Products
- 16.2.14.3. SWOT Analysis
- 16.2.14.4. Recent Developments
- 16.2.14.5. Financials (Based on Availability)
- 16.2.15 Nami Therapeutics Corp
- 16.2.15.1. Overview
- 16.2.15.2. Products
- 16.2.15.3. SWOT Analysis
- 16.2.15.4. Recent Developments
- 16.2.15.5. Financials (Based on Availability)
- 16.2.16 Taiwan Liposome Company Ltd
- 16.2.16.1. Overview
- 16.2.16.2. Products
- 16.2.16.3. SWOT Analysis
- 16.2.16.4. Recent Developments
- 16.2.16.5. Financials (Based on Availability)
- 16.2.17 Johnson & Johnson
- 16.2.17.1. Overview
- 16.2.17.2. Products
- 16.2.17.3. SWOT Analysis
- 16.2.17.4. Recent Developments
- 16.2.17.5. Financials (Based on Availability)
- 16.2.18 Ocuphire Pharma Inc
- 16.2.18.1. Overview
- 16.2.18.2. Products
- 16.2.18.3. SWOT Analysis
- 16.2.18.4. Recent Developments
- 16.2.18.5. Financials (Based on Availability)
- 16.2.19 Luminex Corporation
- 16.2.19.1. Overview
- 16.2.19.2. Products
- 16.2.19.3. SWOT Analysis
- 16.2.19.4. Recent Developments
- 16.2.19.5. Financials (Based on Availability)
- 16.2.20 Bristol-Myers Squibb Company
- 16.2.20.1. Overview
- 16.2.20.2. Products
- 16.2.20.3. SWOT Analysis
- 16.2.20.4. Recent Developments
- 16.2.20.5. Financials (Based on Availability)
- 16.2.1 Pfizer Inc
List of Figures
- Figure 1: Global Nanotechnology Industry Revenue Breakdown (Million, %) by Region 2024 & 2032
- Figure 2: North America Nanotechnology Industry Revenue (Million), by Country 2024 & 2032
- Figure 3: North America Nanotechnology Industry Revenue Share (%), by Country 2024 & 2032
- Figure 4: Europe Nanotechnology Industry Revenue (Million), by Country 2024 & 2032
- Figure 5: Europe Nanotechnology Industry Revenue Share (%), by Country 2024 & 2032
- Figure 6: Asia Pacific Nanotechnology Industry Revenue (Million), by Country 2024 & 2032
- Figure 7: Asia Pacific Nanotechnology Industry Revenue Share (%), by Country 2024 & 2032
- Figure 8: Middle East and Africa Nanotechnology Industry Revenue (Million), by Country 2024 & 2032
- Figure 9: Middle East and Africa Nanotechnology Industry Revenue Share (%), by Country 2024 & 2032
- Figure 10: South America Nanotechnology Industry Revenue (Million), by Country 2024 & 2032
- Figure 11: South America Nanotechnology Industry Revenue Share (%), by Country 2024 & 2032
- Figure 12: North America Nanotechnology Industry Revenue (Million), by Application 2024 & 2032
- Figure 13: North America Nanotechnology Industry Revenue Share (%), by Application 2024 & 2032
- Figure 14: North America Nanotechnology Industry Revenue (Million), by Disease 2024 & 2032
- Figure 15: North America Nanotechnology Industry Revenue Share (%), by Disease 2024 & 2032
- Figure 16: North America Nanotechnology Industry Revenue (Million), by Country 2024 & 2032
- Figure 17: North America Nanotechnology Industry Revenue Share (%), by Country 2024 & 2032
- Figure 18: Europe Nanotechnology Industry Revenue (Million), by Application 2024 & 2032
- Figure 19: Europe Nanotechnology Industry Revenue Share (%), by Application 2024 & 2032
- Figure 20: Europe Nanotechnology Industry Revenue (Million), by Disease 2024 & 2032
- Figure 21: Europe Nanotechnology Industry Revenue Share (%), by Disease 2024 & 2032
- Figure 22: Europe Nanotechnology Industry Revenue (Million), by Country 2024 & 2032
- Figure 23: Europe Nanotechnology Industry Revenue Share (%), by Country 2024 & 2032
- Figure 24: Asia Pacific Nanotechnology Industry Revenue (Million), by Application 2024 & 2032
- Figure 25: Asia Pacific Nanotechnology Industry Revenue Share (%), by Application 2024 & 2032
- Figure 26: Asia Pacific Nanotechnology Industry Revenue (Million), by Disease 2024 & 2032
- Figure 27: Asia Pacific Nanotechnology Industry Revenue Share (%), by Disease 2024 & 2032
- Figure 28: Asia Pacific Nanotechnology Industry Revenue (Million), by Country 2024 & 2032
- Figure 29: Asia Pacific Nanotechnology Industry Revenue Share (%), by Country 2024 & 2032
- Figure 30: Middle East and Africa Nanotechnology Industry Revenue (Million), by Application 2024 & 2032
- Figure 31: Middle East and Africa Nanotechnology Industry Revenue Share (%), by Application 2024 & 2032
- Figure 32: Middle East and Africa Nanotechnology Industry Revenue (Million), by Disease 2024 & 2032
- Figure 33: Middle East and Africa Nanotechnology Industry Revenue Share (%), by Disease 2024 & 2032
- Figure 34: Middle East and Africa Nanotechnology Industry Revenue (Million), by Country 2024 & 2032
- Figure 35: Middle East and Africa Nanotechnology Industry Revenue Share (%), by Country 2024 & 2032
- Figure 36: South America Nanotechnology Industry Revenue (Million), by Application 2024 & 2032
- Figure 37: South America Nanotechnology Industry Revenue Share (%), by Application 2024 & 2032
- Figure 38: South America Nanotechnology Industry Revenue (Million), by Disease 2024 & 2032
- Figure 39: South America Nanotechnology Industry Revenue Share (%), by Disease 2024 & 2032
- Figure 40: South America Nanotechnology Industry Revenue (Million), by Country 2024 & 2032
- Figure 41: South America Nanotechnology Industry Revenue Share (%), by Country 2024 & 2032
List of Tables
- Table 1: Global Nanotechnology Industry Revenue Million Forecast, by Region 2019 & 2032
- Table 2: Global Nanotechnology Industry Revenue Million Forecast, by Application 2019 & 2032
- Table 3: Global Nanotechnology Industry Revenue Million Forecast, by Disease 2019 & 2032
- Table 4: Global Nanotechnology Industry Revenue Million Forecast, by Region 2019 & 2032
- Table 5: Global Nanotechnology Industry Revenue Million Forecast, by Country 2019 & 2032
- Table 6: United States Nanotechnology Industry Revenue (Million) Forecast, by Application 2019 & 2032
- Table 7: Canada Nanotechnology Industry Revenue (Million) Forecast, by Application 2019 & 2032
- Table 8: Mexico Nanotechnology Industry Revenue (Million) Forecast, by Application 2019 & 2032
- Table 9: Global Nanotechnology Industry Revenue Million Forecast, by Country 2019 & 2032
- Table 10: France Nanotechnology Industry Revenue (Million) Forecast, by Application 2019 & 2032
- Table 11: Germany Nanotechnology Industry Revenue (Million) Forecast, by Application 2019 & 2032
- Table 12: United Kingdom Nanotechnology Industry Revenue (Million) Forecast, by Application 2019 & 2032
- Table 13: Italy Nanotechnology Industry Revenue (Million) Forecast, by Application 2019 & 2032
- Table 14: Spain Nanotechnology Industry Revenue (Million) Forecast, by Application 2019 & 2032
- Table 15: Rest of Europe Nanotechnology Industry Revenue (Million) Forecast, by Application 2019 & 2032
- Table 16: Global Nanotechnology Industry Revenue Million Forecast, by Country 2019 & 2032
- Table 17: China Nanotechnology Industry Revenue (Million) Forecast, by Application 2019 & 2032
- Table 18: Japan Nanotechnology Industry Revenue (Million) Forecast, by Application 2019 & 2032
- Table 19: India Nanotechnology Industry Revenue (Million) Forecast, by Application 2019 & 2032
- Table 20: Australia Nanotechnology Industry Revenue (Million) Forecast, by Application 2019 & 2032
- Table 21: South Korea Nanotechnology Industry Revenue (Million) Forecast, by Application 2019 & 2032
- Table 22: Rest of Asia Pacific Nanotechnology Industry Revenue (Million) Forecast, by Application 2019 & 2032
- Table 23: Global Nanotechnology Industry Revenue Million Forecast, by Country 2019 & 2032
- Table 24: GCC Nanotechnology Industry Revenue (Million) Forecast, by Application 2019 & 2032
- Table 25: South Africa Nanotechnology Industry Revenue (Million) Forecast, by Application 2019 & 2032
- Table 26: Rest of Middle East and Africa Nanotechnology Industry Revenue (Million) Forecast, by Application 2019 & 2032
- Table 27: Global Nanotechnology Industry Revenue Million Forecast, by Country 2019 & 2032
- Table 28: Brazil Nanotechnology Industry Revenue (Million) Forecast, by Application 2019 & 2032
- Table 29: Argentina Nanotechnology Industry Revenue (Million) Forecast, by Application 2019 & 2032
- Table 30: Rest of South America Nanotechnology Industry Revenue (Million) Forecast, by Application 2019 & 2032
- Table 31: Global Nanotechnology Industry Revenue Million Forecast, by Application 2019 & 2032
- Table 32: Global Nanotechnology Industry Revenue Million Forecast, by Disease 2019 & 2032
- Table 33: Global Nanotechnology Industry Revenue Million Forecast, by Country 2019 & 2032
- Table 34: United States Nanotechnology Industry Revenue (Million) Forecast, by Application 2019 & 2032
- Table 35: Canada Nanotechnology Industry Revenue (Million) Forecast, by Application 2019 & 2032
- Table 36: Mexico Nanotechnology Industry Revenue (Million) Forecast, by Application 2019 & 2032
- Table 37: Global Nanotechnology Industry Revenue Million Forecast, by Application 2019 & 2032
- Table 38: Global Nanotechnology Industry Revenue Million Forecast, by Disease 2019 & 2032
- Table 39: Global Nanotechnology Industry Revenue Million Forecast, by Country 2019 & 2032
- Table 40: France Nanotechnology Industry Revenue (Million) Forecast, by Application 2019 & 2032
- Table 41: Germany Nanotechnology Industry Revenue (Million) Forecast, by Application 2019 & 2032
- Table 42: United Kingdom Nanotechnology Industry Revenue (Million) Forecast, by Application 2019 & 2032
- Table 43: Italy Nanotechnology Industry Revenue (Million) Forecast, by Application 2019 & 2032
- Table 44: Spain Nanotechnology Industry Revenue (Million) Forecast, by Application 2019 & 2032
- Table 45: Rest of Europe Nanotechnology Industry Revenue (Million) Forecast, by Application 2019 & 2032
- Table 46: Global Nanotechnology Industry Revenue Million Forecast, by Application 2019 & 2032
- Table 47: Global Nanotechnology Industry Revenue Million Forecast, by Disease 2019 & 2032
- Table 48: Global Nanotechnology Industry Revenue Million Forecast, by Country 2019 & 2032
- Table 49: China Nanotechnology Industry Revenue (Million) Forecast, by Application 2019 & 2032
- Table 50: Japan Nanotechnology Industry Revenue (Million) Forecast, by Application 2019 & 2032
- Table 51: India Nanotechnology Industry Revenue (Million) Forecast, by Application 2019 & 2032
- Table 52: Australia Nanotechnology Industry Revenue (Million) Forecast, by Application 2019 & 2032
- Table 53: South Korea Nanotechnology Industry Revenue (Million) Forecast, by Application 2019 & 2032
- Table 54: Rest of Asia Pacific Nanotechnology Industry Revenue (Million) Forecast, by Application 2019 & 2032
- Table 55: Global Nanotechnology Industry Revenue Million Forecast, by Application 2019 & 2032
- Table 56: Global Nanotechnology Industry Revenue Million Forecast, by Disease 2019 & 2032
- Table 57: Global Nanotechnology Industry Revenue Million Forecast, by Country 2019 & 2032
- Table 58: GCC Nanotechnology Industry Revenue (Million) Forecast, by Application 2019 & 2032
- Table 59: South Africa Nanotechnology Industry Revenue (Million) Forecast, by Application 2019 & 2032
- Table 60: Rest of Middle East and Africa Nanotechnology Industry Revenue (Million) Forecast, by Application 2019 & 2032
- Table 61: Global Nanotechnology Industry Revenue Million Forecast, by Application 2019 & 2032
- Table 62: Global Nanotechnology Industry Revenue Million Forecast, by Disease 2019 & 2032
- Table 63: Global Nanotechnology Industry Revenue Million Forecast, by Country 2019 & 2032
- Table 64: Brazil Nanotechnology Industry Revenue (Million) Forecast, by Application 2019 & 2032
- Table 65: Argentina Nanotechnology Industry Revenue (Million) Forecast, by Application 2019 & 2032
- Table 66: Rest of South America Nanotechnology Industry Revenue (Million) Forecast, by Application 2019 & 2032
Frequently Asked Questions
1. What is the projected Compound Annual Growth Rate (CAGR) of the Nanotechnology Industry?
The projected CAGR is approximately 11.90%.
2. Which companies are prominent players in the Nanotechnology Industry?
Key companies in the market include Pfizer Inc, Ensysce Biosciences Inc, Sanofi SA, Spago Nanomedical AB, LiPlasome Pharma ApS, CytImmune Sciences, Genetic Immunity, NanoCarrier Co Ltd, Copernicus Therapeutics Inc, Merck & Co Inc, Nanobiotix, Nanospectra Biosciences, CytImmune Sciences Inc, Starpharma Holdings Limited, Nami Therapeutics Corp, Taiwan Liposome Company Ltd, Johnson & Johnson, Ocuphire Pharma Inc, Luminex Corporation, Bristol-Myers Squibb Company.
3. What are the main segments of the Nanotechnology Industry?
The market segments include Application, Disease.
4. Can you provide details about the market size?
The market size is estimated to be USD XX Million as of 2022.
5. What are some drivers contributing to market growth?
Growing Prevalence of Cancer and Genetic and Cardiovascular Diseases; Increasing Advancements in Nanoscale Technologies for Diagnostic Procedures; Growing Preference for Personalized Medicines.
6. What are the notable trends driving market growth?
The Oncological Diseases Segment is Expected to Show Better Growth During the Forecast Period.
7. Are there any restraints impacting market growth?
High Costs; Stringent Regulations for Commercial Introduction.
8. Can you provide examples of recent developments in the market?
In January 2022, NaNotics LLC entered a research collaboration with Mayo Clinic to develop a NaNot that targets the soluble form of PD-L1, a tumor-generated immune inhibitor.
9. What pricing options are available for accessing the report?
Pricing options include single-user, multi-user, and enterprise licenses priced at USD 4750, USD 5250, and USD 8750 respectively.
10. Is the market size provided in terms of value or volume?
The market size is provided in terms of value, measured in Million.
11. Are there any specific market keywords associated with the report?
Yes, the market keyword associated with the report is "Nanotechnology Industry," which aids in identifying and referencing the specific market segment covered.
12. How do I determine which pricing option suits my needs best?
The pricing options vary based on user requirements and access needs. Individual users may opt for single-user licenses, while businesses requiring broader access may choose multi-user or enterprise licenses for cost-effective access to the report.
13. Are there any additional resources or data provided in the Nanotechnology Industry report?
While the report offers comprehensive insights, it's advisable to review the specific contents or supplementary materials provided to ascertain if additional resources or data are available.
14. How can I stay updated on further developments or reports in the Nanotechnology Industry?
To stay informed about further developments, trends, and reports in the Nanotechnology Industry, consider subscribing to industry newsletters, following relevant companies and organizations, or regularly checking reputable industry news sources and publications.
Methodology
Step 1 - Identification of Relevant Samples Size from Population Database


Step 2 - Approaches for Defining Global Market Size (Value, Volume* & Price*)

Note*: In applicable scenarios
Step 3 - Data Sources
Primary Research
- Web Analytics
- Survey Reports
- Research Institute
- Latest Research Reports
- Opinion Leaders
Secondary Research
- Annual Reports
- White Paper
- Latest Press Release
- Industry Association
- Paid Database
- Investor Presentations

Step 4 - Data Triangulation
Involves using different sources of information in order to increase the validity of a study
These sources are likely to be stakeholders in a program - participants, other researchers, program staff, other community members, and so on.
Then we put all data in single framework & apply various statistical tools to find out the dynamic on the market.
During the analysis stage, feedback from the stakeholder groups would be compared to determine areas of agreement as well as areas of divergence
