

Key Insights
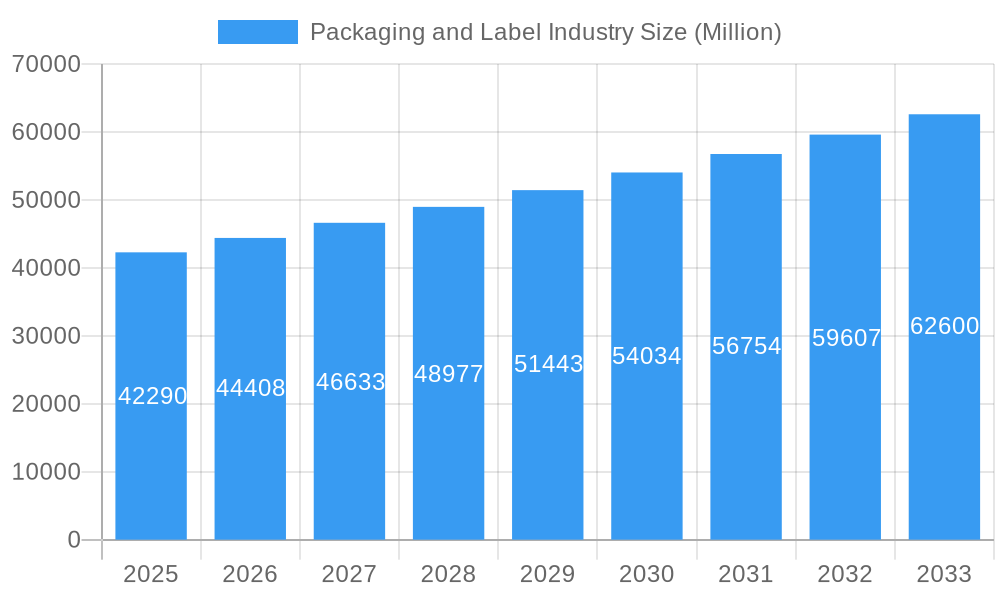
The global packaging and label industry, currently valued at $42.29 billion in 2025, is projected to experience robust growth, driven by a compound annual growth rate (CAGR) of 4.90% from 2025 to 2033. This expansion is fueled by several key factors. The increasing demand for convenient and attractive packaging across diverse end-use industries, particularly food & beverages and pharmaceuticals & healthcare, is a significant driver. E-commerce growth further contributes to the demand for sophisticated labels and packaging solutions to protect goods during transit and enhance branding. Consumer preference for sustainable and eco-friendly packaging materials, such as paper and bioplastics (PLA, PO), is creating new market opportunities. Simultaneously, technological advancements in printing techniques, such as digital printing, are enabling greater customization and cost-effectiveness. While fluctuating raw material prices and stringent regulatory compliance pose challenges, the overall market outlook remains positive, indicating significant growth potential across various segments.
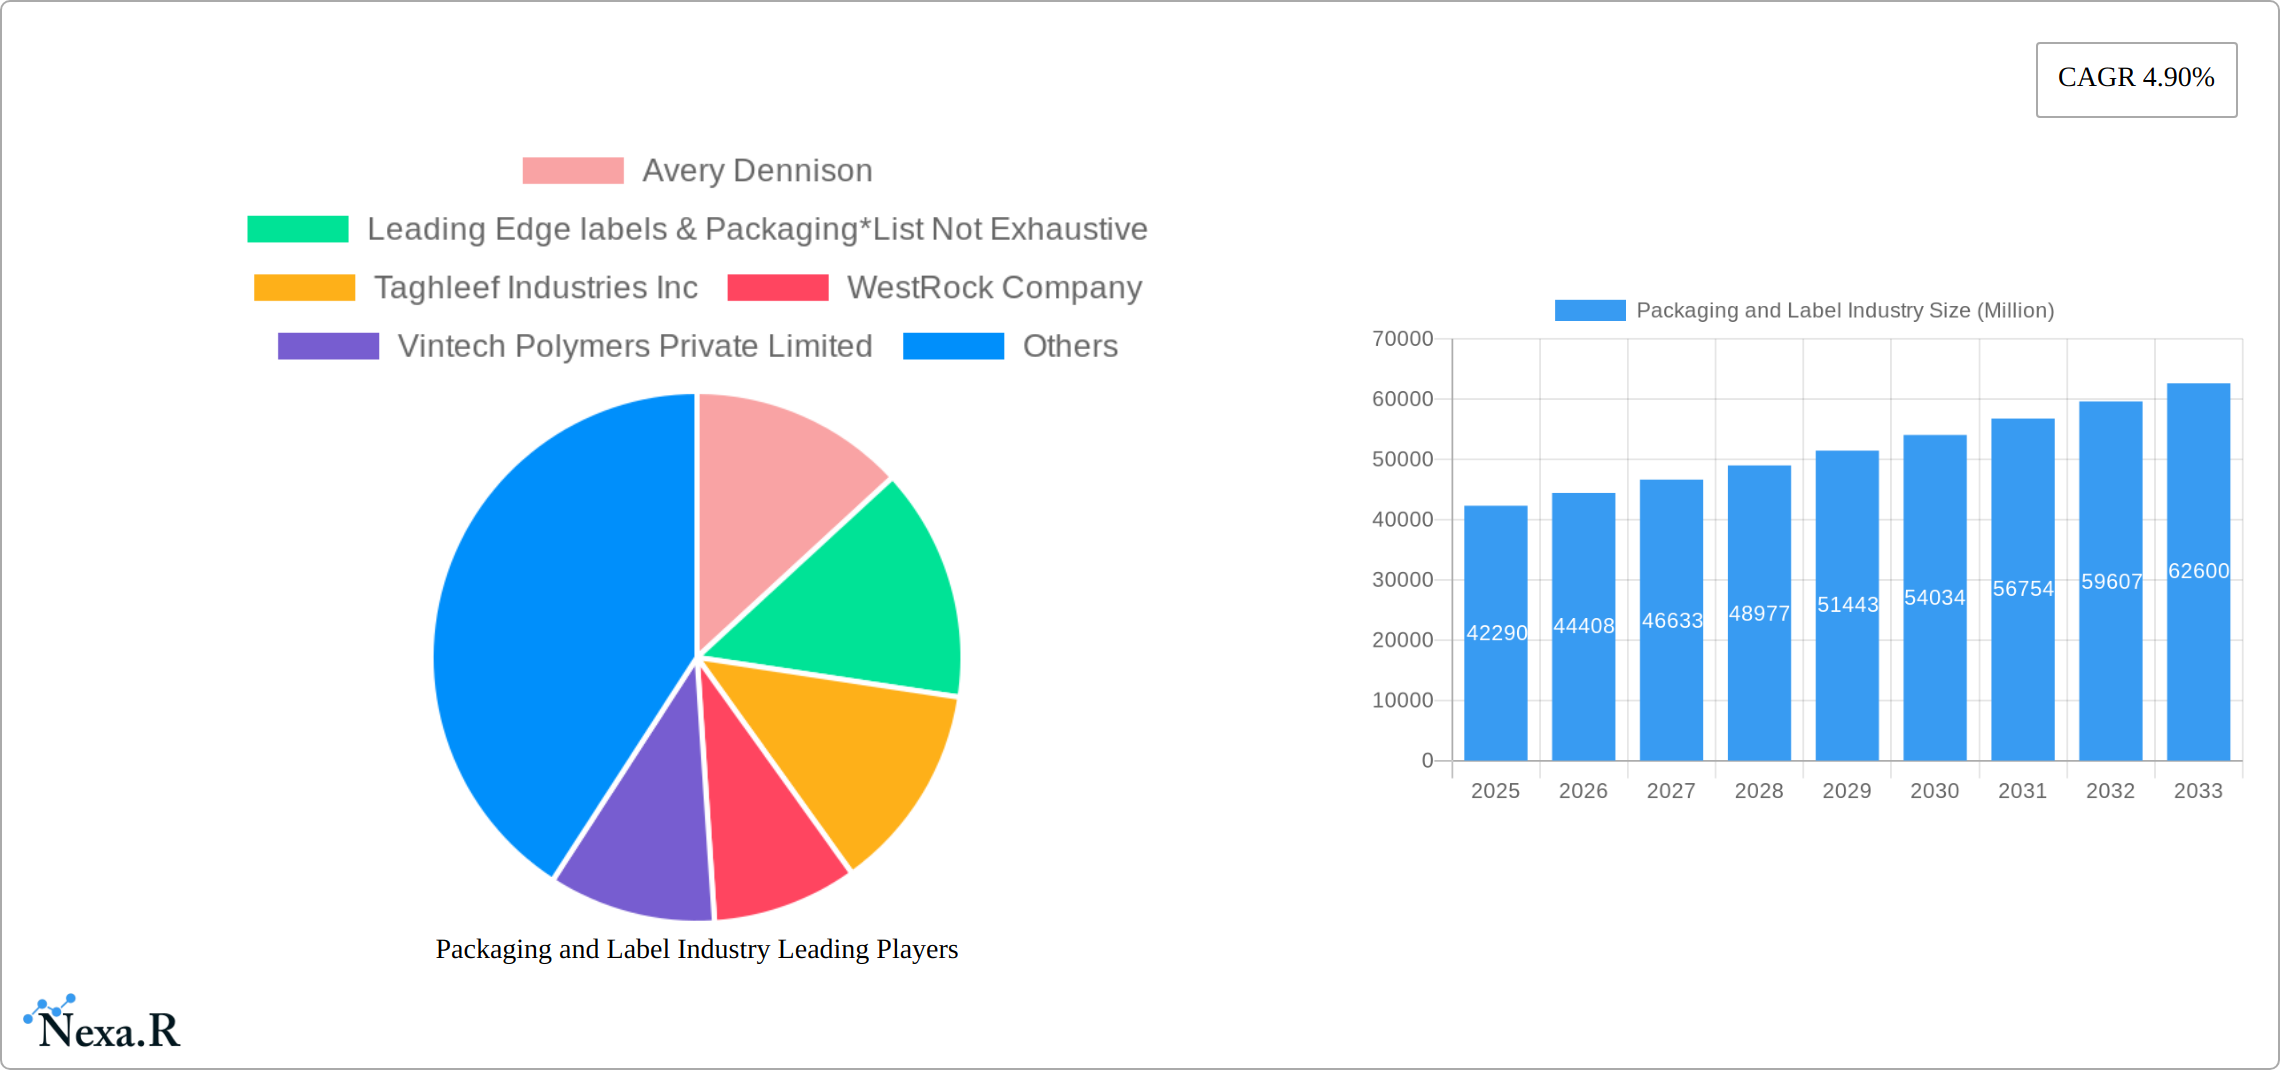
Packaging and Label Industry Market Size (In Billion)
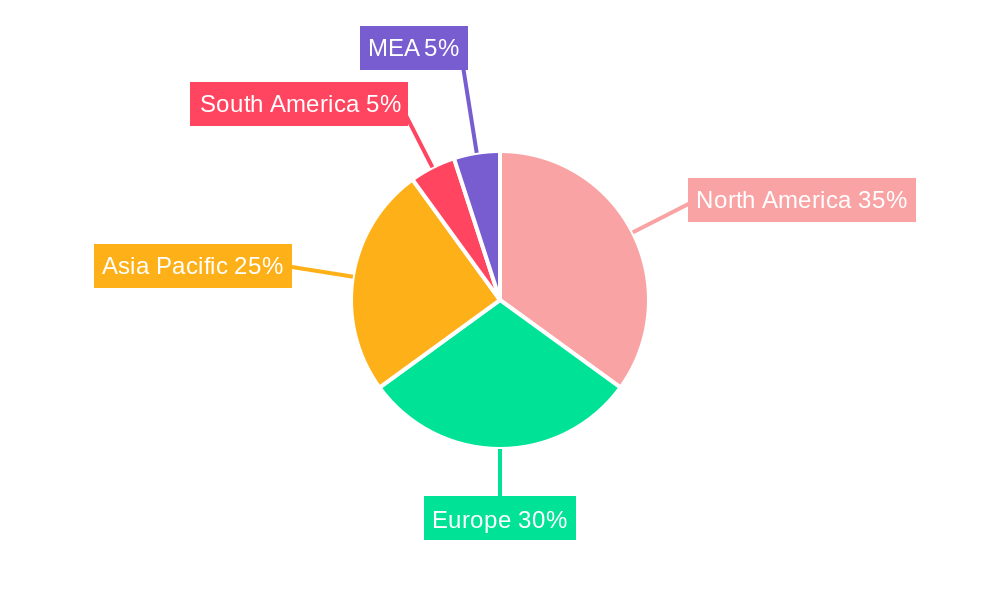
The industry's segmentation reveals diverse growth opportunities. Pressure-sensitive labels, shrink sleeves, and stretch sleeves remain dominant product types, while segments like linerless labels and functional & security labels are experiencing rapid expansion driven by increasing demand for tamper-evident packaging and advanced product identification technologies. Geographically, North America and Europe currently hold substantial market shares, yet the Asia-Pacific region is poised for significant growth due to rapid industrialization and rising consumer spending. Major players like Avery Dennison, CCL Industries, and 3M are leveraging innovation and strategic acquisitions to strengthen their market positions. The competitive landscape is characterized by both established multinational corporations and regional players, highlighting opportunities for both large-scale production and niche market specialization. The forecast period (2025-2033) indicates continued market expansion, with growth primarily driven by emerging economies and evolving consumer demands for enhanced packaging solutions.
Packaging and Label Industry Company Market Share
Packaging and Label Industry Market Report: 2019-2033
This comprehensive report provides a detailed analysis of the Packaging and Label Industry, encompassing market dynamics, growth trends, key players, and future outlook. The study period covers 2019-2033, with a base year of 2025 and a forecast period of 2025-2033. The report segments the market by product type, end-user industry, material, type, and print process, offering granular insights into this dynamic sector valued at xx Million units.
Packaging and Label Industry Market Dynamics & Structure
The Packaging and Label Industry is a dynamic and evolving sector, characterized by a moderately concentrated market structure. This means that while several large, influential players command significant market share, there's also ample room for agility and specialization. Prominent global leaders such as Avery Dennison, CCL Industries LLC, and 3M Company are at the forefront, driving innovation and setting industry standards. Alongside these giants, a vibrant ecosystem of smaller, specialized companies thrives, particularly in niche segments like intricate promotional labels and high-security labels designed for brand protection and anti-counterfeiting.
Driving this market's growth is a relentless wave of technological innovation. Advancements in printing technologies, including the precision of digital printing and the efficiency of flexography, are transforming how labels and packaging are produced. Simultaneously, a heightened focus on material science is yielding a new generation of sustainable alternatives, from compostable films to recycled paper stocks. Automation is further streamlining production processes, enhancing efficiency and enabling greater customization. Overlaying these developments are crucial regulatory frameworks. Stringent requirements related to food safety, product traceability, and enhanced recyclability and biodegradability are not merely compliance hurdles but are actively shaping product development and influencing market access. The industry also navigates competition from alternative packaging solutions, such as the growing adoption of reusable containers, and remains susceptible to the volatility of raw material prices.
Consolidation through mergers and acquisitions (M&A) is a prevalent strategy within the industry, reflecting a strategic drive for enhanced scale, broader technological capabilities, and expanded market reach. The past few years have seen a notable surge in M&A activities, indicating a continuous reshaping of the competitive landscape.
- Market Concentration: A balanced market with a few major players alongside a significant number of agile, specialized firms.
- Technological Innovation: Cutting-edge developments in digital printing, advanced material science focused on sustainability, and sophisticated automation are key growth catalysts.
- Regulatory Landscape: Evolving global regulations concerning food safety, sustainability, and product lifecycle management are powerful drivers of innovation and market strategy.
- Competitive Substitutes: The emergence and adoption of alternative packaging formats and reuse models present ongoing competitive challenges and opportunities.
- M&A Activity: Robust M&A activity is a strategic lever for companies seeking to achieve economies of scale, acquire new technologies, and broaden their market presence.
Packaging and Label Industry Growth Trends & Insights
The Packaging and Label Industry exhibits a steady growth trajectory, driven by factors such as increasing consumer demand, expanding end-use industries (particularly food & beverage and pharmaceuticals), and the rising adoption of innovative packaging solutions. The market size experienced significant expansion during the historical period (2019-2024) and is projected to continue growing at a Compound Annual Growth Rate (CAGR) of xx% during the forecast period (2025-2033), reaching an estimated market size of xx million units by 2033. This growth is fueled by increased demand for sustainable packaging, personalized labels, and advanced security features. Technological disruptions, such as the widespread adoption of digital printing, have significantly impacted production efficiency and customization options. Consumer behavior shifts towards eco-friendly products and personalized experiences further drive market evolution.
Dominant Regions, Countries, or Segments in Packaging and Label Industry
Currently, North America and Europe stand as the dominant forces in the Packaging and Label Industry, collectively accounting for a substantial portion of the global market share. However, the Asia-Pacific region is emerging as a powerhouse of growth, propelled by a burgeoning middle class with increasing disposable incomes, rapid industrialization creating demand for packaging solutions, and supportive government policies encouraging manufacturing and innovation. Within the product segments, pressure-sensitive labels continue to hold the largest market share, offering versatility and ease of application. Following closely are shrink sleeves and stretch sleeves, which provide excellent product visibility and tamper-evident features. The food & beverage industry remains the most significant end-user segment, a testament to the universal need for product identification, branding, and protection. The pharmaceuticals and healthcare sectors also represent crucial and growing markets due to stringent labeling requirements and the need for product integrity. The established dominance of certain regions and segments is largely attributed to robust manufacturing infrastructure, higher consumer purchasing power, and rigorous regulatory standards that often necessitate advanced labeling solutions. While mature markets continue to grow steadily, the Asia-Pacific region is anticipated to experience the highest growth rate in the coming years, driven by its dynamic economic development.
- Key Growth Drivers (Asia-Pacific): Rapidly increasing consumer purchasing power, accelerated industrial expansion, and proactive government initiatives fostering industry growth.
- Key Growth Drivers (North America & Europe): Well-established industrial infrastructure, stringent quality and safety regulations spurring demand for advanced labeling, and a mature consumer market.
- Dominant Segments: Pressure-sensitive labels remain the primary product type, with the food & beverage industry being the largest and most consistent end-user.
Packaging and Label Industry Product Landscape
The Packaging and Label Industry presents an exceptionally diverse and continually evolving product landscape, marked by a relentless pursuit of innovation and functional diversification. The product spectrum ranges from the foundational, everyday pressure-sensitive labels, essential for countless applications, to highly sophisticated solutions like shrink sleeves that provide 360-degree branding and product protection, and in-mold labels seamlessly integrated into plastic packaging during the manufacturing process. Beyond basic identification and aesthetics, these labels are increasingly incorporating advanced functionalities. This includes integrated tamper-evidence features that enhance security and consumer trust, track-and-trace capabilities utilizing advanced printing and encoding technologies for supply chain visibility and counterfeit prevention, and enhanced branding elements that elevate product appeal on crowded shelves. A significant driver of this evolution is the material innovation segment, which is championing the development of eco-friendly alternatives. This includes a growing array of biodegradable and recyclable labels, often derived from sustainably sourced recycled paper or innovative plant-based materials. Complementing material advancements are technological leaps in printing processes, enabling unprecedented high-resolution printing for intricate designs, superior color accuracy for brand consistency, and highly cost-effective customization for short runs and personalized marketing campaigns. The unique selling propositions of these products lie in their enhanced durability to withstand diverse environmental conditions, their improved aesthetic appeal that captures consumer attention, and their advanced functionalities that address the specific needs of a wide array of end-user industries, from consumer goods to high-tech applications.
Key Drivers, Barriers & Challenges in Packaging and Label Industry
Key Drivers: Increasing demand for consumer packaged goods, growing emphasis on product branding and differentiation, technological advancements in printing and material science, and the expanding pharmaceutical and healthcare sectors.
Challenges & Restraints: Fluctuations in raw material prices (e.g., paper, polymers), stringent environmental regulations impacting material selection and waste management, competition from alternative packaging solutions, and supply chain disruptions. These challenges represent significant barriers to industry growth and profitability.
Emerging Opportunities in Packaging and Label Industry
Emerging opportunities arise from the growing adoption of sustainable packaging materials, expanding e-commerce and its associated packaging needs, and the increasing demand for customized and personalized labels. Untapped markets in developing economies, coupled with the rise of smart packaging incorporating technology such as RFID and NFC tags, present significant growth potential. The adoption of Industry 4.0 technologies, including automation and data analytics, further unlocks efficiency gains and improved supply chain management.
Growth Accelerators in the Packaging and Label Industry Industry
The trajectory of sustained growth for the Packaging and Label Industry will be significantly amplified by several critical factors. Substantial investments in research and development are paramount, particularly in pioneering innovative and highly sustainable packaging materials that meet growing environmental consciousness and regulatory demands. Fostering strong, collaborative strategic partnerships between packaging manufacturers and brand owners will be instrumental in co-creating packaging designs and functionalities that not only enhance product appeal but also optimize supply chain efficiency and reduce waste. Furthermore, the strategic expansion of market presence into emerging economies presents a vast untapped potential for growth. This geographic expansion, coupled with the continuous pursuit of technological breakthroughs, such as further advancements in high-speed digital printing technologies and the integration of artificial intelligence in automation, will collectively shape the industry's future growth trajectory.
Key Players Shaping the Packaging and Label Industry Market
- Avery Dennison Corporation
- Leading Edge Labels & Packaging
- Taghleef Industries Inc.
- WestRock Company
- Vintech Polymers Private Limited
- Fort Dearborn Company
- KRIS FLEXIPACKS PVT LTD
- Constantia Flexibles Group GmbH
- Bemis Company, Inc. (now part of Amcor)
- UPM Raflatac
- Royal Sens Group
- Klöckner Pentaplast
- CCL Industries LLC
- 3M Company
- Huhtamaki Group
- Lintec Corporation
- Multi-Color Corporation
- Fuji Seal International Inc.
- Lintec
- Mondi Group
- CPC Packaging
- Berry Global Group, Inc.
- GTPL (Global Trustworthy Packaging Leaders)
- Neenah, Inc.
Notable Milestones in Packaging and Label Industry Sector
- March 2021: Fort Dearborn Company acquired Hammer Packaging Corporation, expanding its capacity and geographic footprint.
- February 2021: Mondi Group launched a range of sustainable paper-based release liners made from recycled materials.
In-Depth Packaging and Label Industry Market Outlook
The future of the Packaging and Label Industry appears bright, with continued growth driven by sustainable solutions, technological innovation, and expansion into new markets. Strategic opportunities lie in developing eco-friendly packaging materials, leveraging advanced printing technologies for enhanced customization, and catering to the growing demand for functional and security labels. The industry’s focus on sustainability, combined with technological advancements, positions it for sustained long-term growth and profitability.
Packaging and Label Industry Segmentation
-
1. Type
-
1.1. Pressure-Sensitive Label
-
1.1.1. By Print Process
- 1.1.1.1. Offset Printing
- 1.1.1.2. Flexography Printing
- 1.1.1.3. Gravure
- 1.1.1.4. Other Analog Printing Process
- 1.1.1.5. Digital Printing
-
1.1.2. By Product Type
- 1.1.2.1. Liner
- 1.1.2.2. Linerless
- 1.1.2.3. VIP
- 1.1.2.4. Prime
- 1.1.2.5. Functional & Security
- 1.1.2.6. Promotional
-
1.1.3. End-User Industry
- 1.1.3.1. Food & Beverages
- 1.1.3.2. Pharmaceutical & Healthcare
- 1.1.3.3. Other End-Users
-
1.1.1. By Print Process
-
1.2. Shrink & Stretch Sleeve Label
- 1.2.1. Shrink Sleeve
-
1.2.2. By Material
- 1.2.2.1. PVC
- 1.2.2.2. PET
- 1.2.2.3. OPP & OPS
- 1.2.2.4. Other Materials (PO, PLA, etc.)
- 1.3. In-Mold Label
- 1.4. Wet Glue Label
-
1.5. Thermal Transfer Label
- 1.5.1. Paper
- 1.5.2. Polyester
- 1.6. Wrap Around Label
-
1.1. Pressure-Sensitive Label
Packaging and Label Industry Segmentation By Geography
- 1. North America
- 2. Europe
- 3. Asia Pacific
- 4. Middle East
- 5. Latin America
Packaging and Label Industry Regional Market Share
Geographic Coverage of Packaging and Label Industry
Packaging and Label Industry REPORT HIGHLIGHTS
| Aspects | Details |
|---|---|
| Study Period | 2020-2034 |
| Base Year | 2025 |
| Estimated Year | 2026 |
| Forecast Period | 2026-2034 |
| Historical Period | 2020-2025 |
| Growth Rate | CAGR of 4.90% from 2020-2034 |
| Segmentation |
|
Table of Contents
- 1. Introduction
- 1.1. Research Scope
- 1.2. Market Segmentation
- 1.3. Research Objective
- 1.4. Definitions and Assumptions
- 2. Executive Summary
- 2.1. Market Snapshot
- 3. Market Dynamics
- 3.1. Market Drivers
- 3.2. Market Restrains
- 3.3. Market Trends
- 3.4. Market Opportunities
- 4. Market Factor Analysis
- 4.1. Porters Five Forces
- 4.1.1. Bargaining Power of Suppliers
- 4.1.2. Bargaining Power of Buyers
- 4.1.3. Threat of New Entrants
- 4.1.4. Threat of Substitutes
- 4.1.5. Competitive Rivalry
- 4.2. PESTEL analysis
- 4.3. BCG Analysis
- 4.3.1. Stars (High Growth, High Market Share)
- 4.3.2. Cash Cows (Low Growth, High Market Share)
- 4.3.3. Question Mark (High Growth, Low Market Share)
- 4.3.4. Dogs (Low Growth, Low Market Share)
- 4.4. Ansoff Matrix Analysis
- 4.5. Supply Chain Analysis
- 4.6. Regulatory Landscape
- 4.7. Current Market Potential and Opportunity Assessment (TAM–SAM–SOM Framework)
- 4.8. NRP Analyst Note
- 4.1. Porters Five Forces
- 5. Market Analysis, Insights and Forecast 2021-2033
- 5.1. Market Analysis, Insights and Forecast - by Type
- 5.1.1. Pressure-Sensitive Label
- 5.1.1.1. By Print Process
- 5.1.1.1.1. Offset Printing
- 5.1.1.1.2. Flexography Printing
- 5.1.1.1.3. Gravure
- 5.1.1.1.4. Other Analog Printing Process
- 5.1.1.1.5. Digital Printing
- 5.1.1.2. By Product Type
- 5.1.1.2.1. Liner
- 5.1.1.2.2. Linerless
- 5.1.1.2.3. VIP
- 5.1.1.2.4. Prime
- 5.1.1.2.5. Functional & Security
- 5.1.1.2.6. Promotional
- 5.1.1.3. End-User Industry
- 5.1.1.3.1. Food & Beverages
- 5.1.1.3.2. Pharmaceutical & Healthcare
- 5.1.1.3.3. Other End-Users
- 5.1.1.1. By Print Process
- 5.1.2. Shrink & Stretch Sleeve Label
- 5.1.2.1. Shrink Sleeve
- 5.1.2.2. By Material
- 5.1.2.2.1. PVC
- 5.1.2.2.2. PET
- 5.1.2.2.3. OPP & OPS
- 5.1.2.2.4. Other Materials (PO, PLA, etc.)
- 5.1.3. In-Mold Label
- 5.1.4. Wet Glue Label
- 5.1.5. Thermal Transfer Label
- 5.1.5.1. Paper
- 5.1.5.2. Polyester
- 5.1.6. Wrap Around Label
- 5.1.1. Pressure-Sensitive Label
- 5.2. Market Analysis, Insights and Forecast - by Region
- 5.2.1. North America
- 5.2.2. Europe
- 5.2.3. Asia Pacific
- 5.2.4. Middle East
- 5.2.5. Latin America
- 5.1. Market Analysis, Insights and Forecast - by Type
- 6. Global Packaging and Label Industry Analysis, Insights and Forecast, 2021-2033
- 6.1. Market Analysis, Insights and Forecast - by Type
- 6.1.1. Pressure-Sensitive Label
- 6.1.1.1. By Print Process
- 6.1.1.1.1. Offset Printing
- 6.1.1.1.2. Flexography Printing
- 6.1.1.1.3. Gravure
- 6.1.1.1.4. Other Analog Printing Process
- 6.1.1.1.5. Digital Printing
- 6.1.1.2. By Product Type
- 6.1.1.2.1. Liner
- 6.1.1.2.2. Linerless
- 6.1.1.2.3. VIP
- 6.1.1.2.4. Prime
- 6.1.1.2.5. Functional & Security
- 6.1.1.2.6. Promotional
- 6.1.1.3. End-User Industry
- 6.1.1.3.1. Food & Beverages
- 6.1.1.3.2. Pharmaceutical & Healthcare
- 6.1.1.3.3. Other End-Users
- 6.1.1.1. By Print Process
- 6.1.2. Shrink & Stretch Sleeve Label
- 6.1.2.1. Shrink Sleeve
- 6.1.2.2. By Material
- 6.1.2.2.1. PVC
- 6.1.2.2.2. PET
- 6.1.2.2.3. OPP & OPS
- 6.1.2.2.4. Other Materials (PO, PLA, etc.)
- 6.1.3. In-Mold Label
- 6.1.4. Wet Glue Label
- 6.1.5. Thermal Transfer Label
- 6.1.5.1. Paper
- 6.1.5.2. Polyester
- 6.1.6. Wrap Around Label
- 6.1.1. Pressure-Sensitive Label
- 6.1. Market Analysis, Insights and Forecast - by Type
- 7. North America Packaging and Label Industry Analysis, Insights and Forecast, 2020-2032
- 7.1. Market Analysis, Insights and Forecast - by Type
- 7.1.1. Pressure-Sensitive Label
- 7.1.1.1. By Print Process
- 7.1.1.1.1. Offset Printing
- 7.1.1.1.2. Flexography Printing
- 7.1.1.1.3. Gravure
- 7.1.1.1.4. Other Analog Printing Process
- 7.1.1.1.5. Digital Printing
- 7.1.1.2. By Product Type
- 7.1.1.2.1. Liner
- 7.1.1.2.2. Linerless
- 7.1.1.2.3. VIP
- 7.1.1.2.4. Prime
- 7.1.1.2.5. Functional & Security
- 7.1.1.2.6. Promotional
- 7.1.1.3. End-User Industry
- 7.1.1.3.1. Food & Beverages
- 7.1.1.3.2. Pharmaceutical & Healthcare
- 7.1.1.3.3. Other End-Users
- 7.1.1.1. By Print Process
- 7.1.2. Shrink & Stretch Sleeve Label
- 7.1.2.1. Shrink Sleeve
- 7.1.2.2. By Material
- 7.1.2.2.1. PVC
- 7.1.2.2.2. PET
- 7.1.2.2.3. OPP & OPS
- 7.1.2.2.4. Other Materials (PO, PLA, etc.)
- 7.1.3. In-Mold Label
- 7.1.4. Wet Glue Label
- 7.1.5. Thermal Transfer Label
- 7.1.5.1. Paper
- 7.1.5.2. Polyester
- 7.1.6. Wrap Around Label
- 7.1.1. Pressure-Sensitive Label
- 7.1. Market Analysis, Insights and Forecast - by Type
- 8. Europe Packaging and Label Industry Analysis, Insights and Forecast, 2020-2032
- 8.1. Market Analysis, Insights and Forecast - by Type
- 8.1.1. Pressure-Sensitive Label
- 8.1.1.1. By Print Process
- 8.1.1.1.1. Offset Printing
- 8.1.1.1.2. Flexography Printing
- 8.1.1.1.3. Gravure
- 8.1.1.1.4. Other Analog Printing Process
- 8.1.1.1.5. Digital Printing
- 8.1.1.2. By Product Type
- 8.1.1.2.1. Liner
- 8.1.1.2.2. Linerless
- 8.1.1.2.3. VIP
- 8.1.1.2.4. Prime
- 8.1.1.2.5. Functional & Security
- 8.1.1.2.6. Promotional
- 8.1.1.3. End-User Industry
- 8.1.1.3.1. Food & Beverages
- 8.1.1.3.2. Pharmaceutical & Healthcare
- 8.1.1.3.3. Other End-Users
- 8.1.1.1. By Print Process
- 8.1.2. Shrink & Stretch Sleeve Label
- 8.1.2.1. Shrink Sleeve
- 8.1.2.2. By Material
- 8.1.2.2.1. PVC
- 8.1.2.2.2. PET
- 8.1.2.2.3. OPP & OPS
- 8.1.2.2.4. Other Materials (PO, PLA, etc.)
- 8.1.3. In-Mold Label
- 8.1.4. Wet Glue Label
- 8.1.5. Thermal Transfer Label
- 8.1.5.1. Paper
- 8.1.5.2. Polyester
- 8.1.6. Wrap Around Label
- 8.1.1. Pressure-Sensitive Label
- 8.1. Market Analysis, Insights and Forecast - by Type
- 9. Asia Pacific Packaging and Label Industry Analysis, Insights and Forecast, 2020-2032
- 9.1. Market Analysis, Insights and Forecast - by Type
- 9.1.1. Pressure-Sensitive Label
- 9.1.1.1. By Print Process
- 9.1.1.1.1. Offset Printing
- 9.1.1.1.2. Flexography Printing
- 9.1.1.1.3. Gravure
- 9.1.1.1.4. Other Analog Printing Process
- 9.1.1.1.5. Digital Printing
- 9.1.1.2. By Product Type
- 9.1.1.2.1. Liner
- 9.1.1.2.2. Linerless
- 9.1.1.2.3. VIP
- 9.1.1.2.4. Prime
- 9.1.1.2.5. Functional & Security
- 9.1.1.2.6. Promotional
- 9.1.1.3. End-User Industry
- 9.1.1.3.1. Food & Beverages
- 9.1.1.3.2. Pharmaceutical & Healthcare
- 9.1.1.3.3. Other End-Users
- 9.1.1.1. By Print Process
- 9.1.2. Shrink & Stretch Sleeve Label
- 9.1.2.1. Shrink Sleeve
- 9.1.2.2. By Material
- 9.1.2.2.1. PVC
- 9.1.2.2.2. PET
- 9.1.2.2.3. OPP & OPS
- 9.1.2.2.4. Other Materials (PO, PLA, etc.)
- 9.1.3. In-Mold Label
- 9.1.4. Wet Glue Label
- 9.1.5. Thermal Transfer Label
- 9.1.5.1. Paper
- 9.1.5.2. Polyester
- 9.1.6. Wrap Around Label
- 9.1.1. Pressure-Sensitive Label
- 9.1. Market Analysis, Insights and Forecast - by Type
- 10. Middle East Packaging and Label Industry Analysis, Insights and Forecast, 2020-2032
- 10.1. Market Analysis, Insights and Forecast - by Type
- 10.1.1. Pressure-Sensitive Label
- 10.1.1.1. By Print Process
- 10.1.1.1.1. Offset Printing
- 10.1.1.1.2. Flexography Printing
- 10.1.1.1.3. Gravure
- 10.1.1.1.4. Other Analog Printing Process
- 10.1.1.1.5. Digital Printing
- 10.1.1.2. By Product Type
- 10.1.1.2.1. Liner
- 10.1.1.2.2. Linerless
- 10.1.1.2.3. VIP
- 10.1.1.2.4. Prime
- 10.1.1.2.5. Functional & Security
- 10.1.1.2.6. Promotional
- 10.1.1.3. End-User Industry
- 10.1.1.3.1. Food & Beverages
- 10.1.1.3.2. Pharmaceutical & Healthcare
- 10.1.1.3.3. Other End-Users
- 10.1.1.1. By Print Process
- 10.1.2. Shrink & Stretch Sleeve Label
- 10.1.2.1. Shrink Sleeve
- 10.1.2.2. By Material
- 10.1.2.2.1. PVC
- 10.1.2.2.2. PET
- 10.1.2.2.3. OPP & OPS
- 10.1.2.2.4. Other Materials (PO, PLA, etc.)
- 10.1.3. In-Mold Label
- 10.1.4. Wet Glue Label
- 10.1.5. Thermal Transfer Label
- 10.1.5.1. Paper
- 10.1.5.2. Polyester
- 10.1.6. Wrap Around Label
- 10.1.1. Pressure-Sensitive Label
- 10.1. Market Analysis, Insights and Forecast - by Type
- 11. Latin America Packaging and Label Industry Analysis, Insights and Forecast, 2020-2032
- 11.1. Market Analysis, Insights and Forecast - by Type
- 11.1.1. Pressure-Sensitive Label
- 11.1.1.1. By Print Process
- 11.1.1.1.1. Offset Printing
- 11.1.1.1.2. Flexography Printing
- 11.1.1.1.3. Gravure
- 11.1.1.1.4. Other Analog Printing Process
- 11.1.1.1.5. Digital Printing
- 11.1.1.2. By Product Type
- 11.1.1.2.1. Liner
- 11.1.1.2.2. Linerless
- 11.1.1.2.3. VIP
- 11.1.1.2.4. Prime
- 11.1.1.2.5. Functional & Security
- 11.1.1.2.6. Promotional
- 11.1.1.3. End-User Industry
- 11.1.1.3.1. Food & Beverages
- 11.1.1.3.2. Pharmaceutical & Healthcare
- 11.1.1.3.3. Other End-Users
- 11.1.1.1. By Print Process
- 11.1.2. Shrink & Stretch Sleeve Label
- 11.1.2.1. Shrink Sleeve
- 11.1.2.2. By Material
- 11.1.2.2.1. PVC
- 11.1.2.2.2. PET
- 11.1.2.2.3. OPP & OPS
- 11.1.2.2.4. Other Materials (PO, PLA, etc.)
- 11.1.3. In-Mold Label
- 11.1.4. Wet Glue Label
- 11.1.5. Thermal Transfer Label
- 11.1.5.1. Paper
- 11.1.5.2. Polyester
- 11.1.6. Wrap Around Label
- 11.1.1. Pressure-Sensitive Label
- 11.1. Market Analysis, Insights and Forecast - by Type
- 12. Competitive Analysis
- 12.1. Company Profiles
- 12.1.1 Avery Dennison
- 12.1.1.1. Company Overview
- 12.1.1.2. Products
- 12.1.1.3. Company Financials
- 12.1.1.4. SWOT Analysis
- 12.1.2 Leading Edge labels & Packaging*List Not Exhaustive
- 12.1.2.1. Company Overview
- 12.1.2.2. Products
- 12.1.2.3. Company Financials
- 12.1.2.4. SWOT Analysis
- 12.1.3 Taghleef Industries Inc
- 12.1.3.1. Company Overview
- 12.1.3.2. Products
- 12.1.3.3. Company Financials
- 12.1.3.4. SWOT Analysis
- 12.1.4 WestRock Company
- 12.1.4.1. Company Overview
- 12.1.4.2. Products
- 12.1.4.3. Company Financials
- 12.1.4.4. SWOT Analysis
- 12.1.5 Vintech Polymers Private Limited
- 12.1.5.1. Company Overview
- 12.1.5.2. Products
- 12.1.5.3. Company Financials
- 12.1.5.4. SWOT Analysis
- 12.1.6 Fort Dearborn
- 12.1.6.1. Company Overview
- 12.1.6.2. Products
- 12.1.6.3. Company Financials
- 12.1.6.4. SWOT Analysis
- 12.1.7 KRIS FLEXIPACKS PVT LTD
- 12.1.7.1. Company Overview
- 12.1.7.2. Products
- 12.1.7.3. Company Financials
- 12.1.7.4. SWOT Analysis
- 12.1.8 Fort Dearborn Company
- 12.1.8.1. Company Overview
- 12.1.8.2. Products
- 12.1.8.3. Company Financials
- 12.1.8.4. SWOT Analysis
- 12.1.9 Constantia Flexibles Group GmbH
- 12.1.9.1. Company Overview
- 12.1.9.2. Products
- 12.1.9.3. Company Financials
- 12.1.9.4. SWOT Analysis
- 12.1.10 Bemis Company
- 12.1.10.1. Company Overview
- 12.1.10.2. Products
- 12.1.10.3. Company Financials
- 12.1.10.4. SWOT Analysis
- 12.1.11 UPM Raflatc
- 12.1.11.1. Company Overview
- 12.1.11.2. Products
- 12.1.11.3. Company Financials
- 12.1.11.4. SWOT Analysis
- 12.1.12 Royal Sens Group
- 12.1.12.1. Company Overview
- 12.1.12.2. Products
- 12.1.12.3. Company Financials
- 12.1.12.4. SWOT Analysis
- 12.1.13 Klockner Pentaplast
- 12.1.13.1. Company Overview
- 12.1.13.2. Products
- 12.1.13.3. Company Financials
- 12.1.13.4. SWOT Analysis
- 12.1.14 CCL Industries LLC
- 12.1.14.1. Company Overview
- 12.1.14.2. Products
- 12.1.14.3. Company Financials
- 12.1.14.4. SWOT Analysis
- 12.1.15 3M Company
- 12.1.15.1. Company Overview
- 12.1.15.2. Products
- 12.1.15.3. Company Financials
- 12.1.15.4. SWOT Analysis
- 12.1.16 Huhtamaki Group
- 12.1.16.1. Company Overview
- 12.1.16.2. Products
- 12.1.16.3. Company Financials
- 12.1.16.4. SWOT Analysis
- 12.1.17 Lintec Corporation
- 12.1.17.1. Company Overview
- 12.1.17.2. Products
- 12.1.17.3. Company Financials
- 12.1.17.4. SWOT Analysis
- 12.1.18 Multi-Color Corporation
- 12.1.18.1. Company Overview
- 12.1.18.2. Products
- 12.1.18.3. Company Financials
- 12.1.18.4. SWOT Analysis
- 12.1.19 Fuji Seal International Inc
- 12.1.19.1. Company Overview
- 12.1.19.2. Products
- 12.1.19.3. Company Financials
- 12.1.19.4. SWOT Analysis
- 12.1.20 Lintec
- 12.1.20.1. Company Overview
- 12.1.20.2. Products
- 12.1.20.3. Company Financials
- 12.1.20.4. SWOT Analysis
- 12.1.21 Mondi
- 12.1.21.1. Company Overview
- 12.1.21.2. Products
- 12.1.21.3. Company Financials
- 12.1.21.4. SWOT Analysis
- 12.1.22 CPC Packaging
- 12.1.22.1. Company Overview
- 12.1.22.2. Products
- 12.1.22.3. Company Financials
- 12.1.22.4. SWOT Analysis
- 12.1.23 Berry Global
- 12.1.23.1. Company Overview
- 12.1.23.2. Products
- 12.1.23.3. Company Financials
- 12.1.23.4. SWOT Analysis
- 12.1.24 GTPL
- 12.1.24.1. Company Overview
- 12.1.24.2. Products
- 12.1.24.3. Company Financials
- 12.1.24.4. SWOT Analysis
- 12.1.25 Neenah Inc
- 12.1.25.1. Company Overview
- 12.1.25.2. Products
- 12.1.25.3. Company Financials
- 12.1.25.4. SWOT Analysis
- 12.1.1 Avery Dennison
- 12.2. Market Entropy
- 12.2.1 Company's Key Areas Served
- 12.2.2 Recent Developments
- 12.3. Company Market Share Analysis 2025
- 12.3.1 Top 5 Companies Market Share Analysis
- 12.3.2 Top 3 Companies Market Share Analysis
- 12.4. List of Potential Customers
- 13. Research Methodology
List of Figures
- Figure 1: Global Packaging and Label Industry Revenue Breakdown (Million, %) by Region 2025 & 2033
- Figure 2: North America Packaging and Label Industry Revenue (Million), by Type 2025 & 2033
- Figure 3: North America Packaging and Label Industry Revenue Share (%), by Type 2025 & 2033
- Figure 4: North America Packaging and Label Industry Revenue (Million), by Country 2025 & 2033
- Figure 5: North America Packaging and Label Industry Revenue Share (%), by Country 2025 & 2033
- Figure 6: Europe Packaging and Label Industry Revenue (Million), by Type 2025 & 2033
- Figure 7: Europe Packaging and Label Industry Revenue Share (%), by Type 2025 & 2033
- Figure 8: Europe Packaging and Label Industry Revenue (Million), by Country 2025 & 2033
- Figure 9: Europe Packaging and Label Industry Revenue Share (%), by Country 2025 & 2033
- Figure 10: Asia Pacific Packaging and Label Industry Revenue (Million), by Type 2025 & 2033
- Figure 11: Asia Pacific Packaging and Label Industry Revenue Share (%), by Type 2025 & 2033
- Figure 12: Asia Pacific Packaging and Label Industry Revenue (Million), by Country 2025 & 2033
- Figure 13: Asia Pacific Packaging and Label Industry Revenue Share (%), by Country 2025 & 2033
- Figure 14: Middle East Packaging and Label Industry Revenue (Million), by Type 2025 & 2033
- Figure 15: Middle East Packaging and Label Industry Revenue Share (%), by Type 2025 & 2033
- Figure 16: Middle East Packaging and Label Industry Revenue (Million), by Country 2025 & 2033
- Figure 17: Middle East Packaging and Label Industry Revenue Share (%), by Country 2025 & 2033
- Figure 18: Latin America Packaging and Label Industry Revenue (Million), by Type 2025 & 2033
- Figure 19: Latin America Packaging and Label Industry Revenue Share (%), by Type 2025 & 2033
- Figure 20: Latin America Packaging and Label Industry Revenue (Million), by Country 2025 & 2033
- Figure 21: Latin America Packaging and Label Industry Revenue Share (%), by Country 2025 & 2033
List of Tables
- Table 1: Global Packaging and Label Industry Revenue Million Forecast, by Type 2020 & 2033
- Table 2: Global Packaging and Label Industry Revenue Million Forecast, by Region 2020 & 2033
- Table 3: Global Packaging and Label Industry Revenue Million Forecast, by Type 2020 & 2033
- Table 4: Global Packaging and Label Industry Revenue Million Forecast, by Country 2020 & 2033
- Table 5: Global Packaging and Label Industry Revenue Million Forecast, by Type 2020 & 2033
- Table 6: Global Packaging and Label Industry Revenue Million Forecast, by Country 2020 & 2033
- Table 7: Global Packaging and Label Industry Revenue Million Forecast, by Type 2020 & 2033
- Table 8: Global Packaging and Label Industry Revenue Million Forecast, by Country 2020 & 2033
- Table 9: Global Packaging and Label Industry Revenue Million Forecast, by Type 2020 & 2033
- Table 10: Global Packaging and Label Industry Revenue Million Forecast, by Country 2020 & 2033
- Table 11: Global Packaging and Label Industry Revenue Million Forecast, by Type 2020 & 2033
- Table 12: Global Packaging and Label Industry Revenue Million Forecast, by Country 2020 & 2033
Frequently Asked Questions
1. What is the projected Compound Annual Growth Rate (CAGR) of the Packaging and Label Industry?
The projected CAGR is approximately 4.90%.
2. Which companies are prominent players in the Packaging and Label Industry?
Key companies in the market include Avery Dennison, Leading Edge labels & Packaging*List Not Exhaustive, Taghleef Industries Inc, WestRock Company, Vintech Polymers Private Limited, Fort Dearborn, KRIS FLEXIPACKS PVT LTD, Fort Dearborn Company, Constantia Flexibles Group GmbH, Bemis Company, UPM Raflatc, Royal Sens Group, Klockner Pentaplast, CCL Industries LLC, 3M Company, Huhtamaki Group, Lintec Corporation, Multi-Color Corporation, Fuji Seal International Inc, Lintec, Mondi, CPC Packaging, Berry Global, GTPL, Neenah Inc.
3. What are the main segments of the Packaging and Label Industry?
The market segments include Type.
4. Can you provide details about the market size?
The market size is estimated to be USD 42.29 Million as of 2022.
5. What are some drivers contributing to market growth?
The issues related to recycling of release liners and the ability to enable direct digital printing is expected to spur demand; Ability to conform to any size and shape. and yet provide the necessary protection.
6. What are the notable trends driving market growth?
Food and Beverage End-User Segment is Expected to Drive Growth of Labels.
7. Are there any restraints impacting market growth?
; Fluctuating Oil Prices.
8. Can you provide examples of recent developments in the market?
March 2021 - Dearborn Company has announced that it has acquired Hammer Packaging Corporation. The combined organization takes advantage of Hammer's state-of-the-art technology to enhance Fort Dearborn's leadership position in the decorative label and packaging marketplace by further expanding the company's geographic footprint, capacity, and capabilities.
9. What pricing options are available for accessing the report?
Pricing options include single-user, multi-user, and enterprise licenses priced at USD 4750, USD 5250, and USD 8750 respectively.
10. Is the market size provided in terms of value or volume?
The market size is provided in terms of value, measured in Million.
11. Are there any specific market keywords associated with the report?
Yes, the market keyword associated with the report is "Packaging and Label Industry," which aids in identifying and referencing the specific market segment covered.
12. How do I determine which pricing option suits my needs best?
The pricing options vary based on user requirements and access needs. Individual users may opt for single-user licenses, while businesses requiring broader access may choose multi-user or enterprise licenses for cost-effective access to the report.
13. Are there any additional resources or data provided in the Packaging and Label Industry report?
While the report offers comprehensive insights, it's advisable to review the specific contents or supplementary materials provided to ascertain if additional resources or data are available.
14. How can I stay updated on further developments or reports in the Packaging and Label Industry?
To stay informed about further developments, trends, and reports in the Packaging and Label Industry, consider subscribing to industry newsletters, following relevant companies and organizations, or regularly checking reputable industry news sources and publications.
Methodology
Step 1 - Identification of Relevant Samples Size from Population Database


Step 2 - Approaches for Defining Global Market Size (Value, Volume* & Price*)

Note*: In applicable scenarios
Step 3 - Data Sources
Primary Research
- Web Analytics
- Survey Reports
- Research Institute
- Latest Research Reports
- Opinion Leaders
Secondary Research
- Annual Reports
- White Paper
- Latest Press Release
- Industry Association
- Paid Database
- Investor Presentations

Step 4 - Data Triangulation
Involves using different sources of information in order to increase the validity of a study
These sources are likely to be stakeholders in a program - participants, other researchers, program staff, other community members, and so on.
Then we put all data in single framework & apply various statistical tools to find out the dynamic on the market.
During the analysis stage, feedback from the stakeholder groups would be compared to determine areas of agreement as well as areas of divergence