

Key Insights
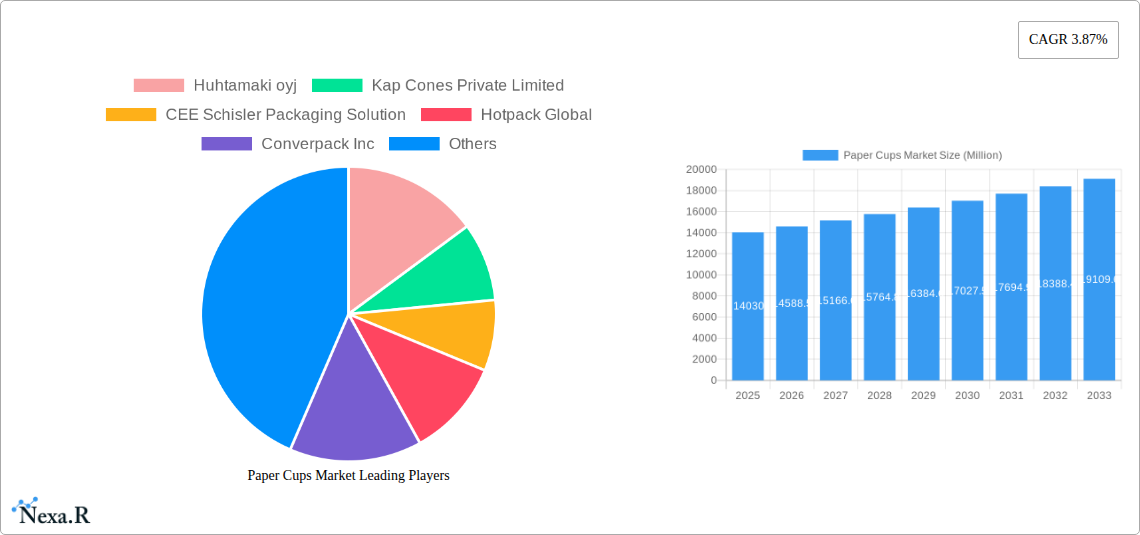
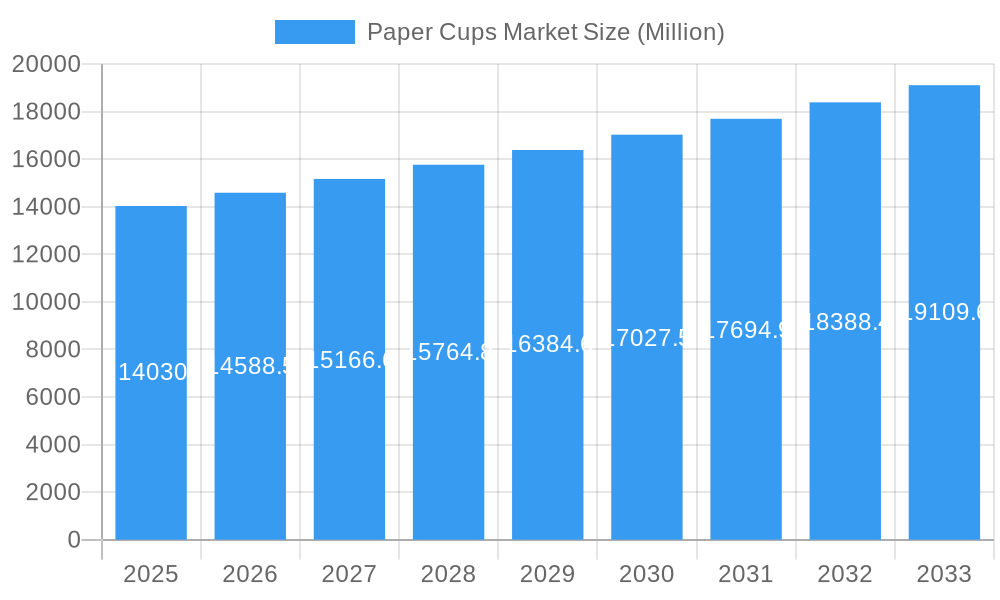
The global paper cups market, valued at $14.03 billion in 2025, is projected to experience steady growth, driven by the increasing demand from the quick-service restaurant (QSR) sector and a rising preference for convenient, disposable food packaging. The market's Compound Annual Growth Rate (CAGR) of 3.87% from 2025 to 2033 indicates a consistent expansion, fueled by factors such as rising disposable incomes, urbanization, and the proliferation of coffee shops and takeaway food services. The segmentation reveals significant opportunities within specific product types; double-wall paper cups, offering superior insulation, are expected to witness robust growth compared to single-wall alternatives. Furthermore, the increasing focus on sustainability within the food service industry is likely to influence the demand for eco-friendly paper cups made from recycled materials or possessing biodegradable properties. This trend necessitates manufacturers to adapt and invest in sustainable production practices to remain competitive. Regional variations in market growth are anticipated, with North America and Asia expected to dominate, driven by established QSR markets and rapid economic expansion in several Asian countries. However, challenges such as fluctuating raw material prices and growing environmental concerns might pose certain restraints on market expansion. Competitive pressures among established players like Huhtamaki oyj and Dart Container Corporation alongside emerging regional brands will shape the future landscape.
Paper Cups Market Market Size (In Billion)
The market is witnessing innovation in cup designs, including improved insulation capabilities, leak-proof features, and customizable printing options catering to the branding requirements of various food and beverage outlets. The integration of smart technologies into packaging, such as QR codes for tracking and tracing purposes, or the inclusion of heat-sensitive ink for temperature indication, presents further potential for growth. While the institutional sector, comprising schools, hospitals, and offices, contributes significantly, the evolving preference for individual servings and single-use options is likely to further drive growth in the QSR segment. A comprehensive understanding of consumer preferences, coupled with strategic partnerships across the value chain, will be crucial for success in this dynamic and competitive market.
Paper Cups Market Company Market Share
Paper Cups Market: A Comprehensive Market Research Report (2019-2033)
This comprehensive report provides an in-depth analysis of the global Paper Cups Market, encompassing market dynamics, growth trends, regional segmentation, product landscape, key players, and future outlook. The report covers the historical period from 2019 to 2024, the base year 2025, and forecasts market performance until 2033. The market is segmented by cup type (hot and cold), end-user (QSRs, institutional, others), and wall type (single, double, triple). This detailed analysis is crucial for businesses operating within the paper cups industry, including manufacturers, distributors, and investors, to gain a competitive edge. The total market size is projected to reach xx Million units by 2033.
Paper Cups Market Dynamics & Structure
The global paper cups market is characterized by moderate concentration, with a few major players holding significant market share. However, the market also features several regional and niche players. Technological innovation, particularly in sustainable and eco-friendly materials, is a key driver of growth. Stringent environmental regulations are also shaping the market, pushing manufacturers to adopt more sustainable practices. The market faces competition from reusable cups and other beverage containers. Consumer preferences, driven by factors like convenience and sustainability, significantly influence market demand. Mergers and acquisitions (M&A) activity has been relatively moderate in recent years, with xx deals recorded between 2019 and 2024.
- Market Concentration: Moderately concentrated, with top 5 players holding approximately xx% market share in 2024.
- Technological Innovation: Focus on biodegradable and compostable materials, improved insulation, and enhanced designs.
- Regulatory Framework: Increasing emphasis on recyclability and reduced environmental impact.
- Competitive Substitutes: Reusable cups, plastic cups, and other beverage containers.
- End-User Demographics: Growing demand from QSRs and institutional settings, driven by population growth and changing lifestyles.
- M&A Trends: Moderate activity in recent years, with a focus on expanding product lines and geographical reach.
Paper Cups Market Growth Trends & Insights
The global paper cups market experienced a CAGR of xx% during the historical period (2019-2024), driven primarily by the rising demand from the food service industry. The market is expected to continue its growth trajectory, with a projected CAGR of xx% during the forecast period (2025-2033). This growth is attributable to factors such as increasing disposable incomes, rising urbanization, and changing consumer preferences toward convenient packaging solutions. Technological advancements in sustainable materials and manufacturing processes are also fueling market expansion. The market penetration rate in developing economies is expected to increase significantly in the coming years.
Dominant Regions, Countries, or Segments in Paper Cups Market
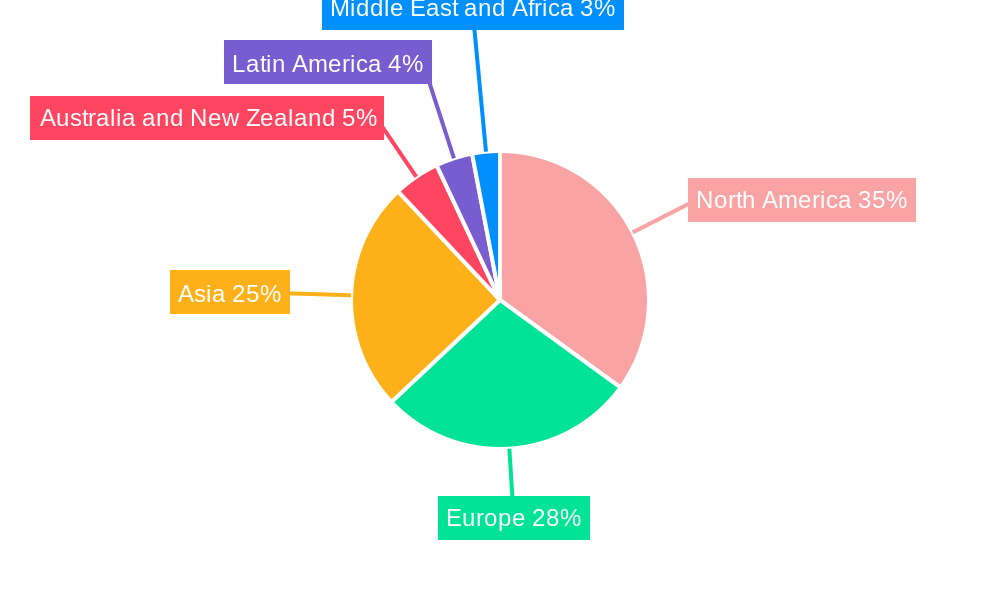
North America currently holds the largest market share in the global paper cups market, followed by Europe and Asia-Pacific. Within the segment breakdown, Hot Paper Cups hold a larger market share than Cold Paper Cups due to higher demand from the hot beverage industry. Quick Service Restaurants (QSRs) are the leading end-user segment, followed by institutional settings. Single wall paper cups constitute the largest share of the market based on wall type.
- Key Drivers in North America: High disposable income, strong QSR sector, and robust consumer demand for convenience.
- Key Drivers in Europe: Growing demand for eco-friendly and recyclable paper cups, stringent regulations, and rising awareness of sustainability.
- Key Drivers in Asia-Pacific: Rapid economic growth, expanding middle class, urbanization, and increasing tourism.
- Segment Dominance: Hot Paper Cups (xx Million units), QSRs (xx Million units), Single Wall Paper Cups (xx Million units).
Paper Cups Market Product Landscape
The paper cups market offers a diverse range of products, encompassing various sizes, designs, and functionalities. Innovations focus on enhanced insulation, leak-proof designs, and sustainable materials. Key features include improved printing capabilities for branding and custom designs, and advancements in coatings to enhance durability and reduce liquid leakage. The market is witnessing the adoption of advanced materials like PLA (polylactic acid) and other bio-based polymers.
Key Drivers, Barriers & Challenges in Paper Cups Market
Key Drivers:
- Rising demand from the food service and beverage industry.
- Growing popularity of takeaway and on-the-go consumption patterns.
- Increasing emphasis on convenience and disposability.
Key Challenges:
- Fluctuations in raw material prices (e.g., pulp).
- Environmental concerns and regulations related to waste management.
- Intense competition from alternative packaging solutions.
- Supply chain disruptions impacting raw materials and production.
Emerging Opportunities in Paper Cups Market
- Growing demand for customized and branded paper cups.
- Expansion into emerging markets with rising disposable incomes.
- Development of innovative paper cup designs with enhanced functionalities.
- Increased focus on sustainable and eco-friendly solutions (biodegradable, compostable).
Growth Accelerators in the Paper Cups Market Industry
Technological advancements, especially in sustainable materials and manufacturing processes, are key growth catalysts. Strategic partnerships and collaborations between manufacturers and raw material suppliers can streamline the supply chain and improve efficiency. Expansion into emerging markets and diversification of product offerings represent significant opportunities for growth.
Key Players Shaping the Paper Cups Market Market
- Huhtamaki oyj
- Kap Cones Private Limited
- CEE Schisler Packaging Solution
- Hotpack Global
- Converpack Inc
- Tekni-Plex Inc
- Go-Pak UK Ltd (SCGP Packaging)
- Graphic Packaging International LLC
- Benders Paper Cups
- Dart Container Corporation
Notable Milestones in Paper Cups Market Sector
- February 2024: Linstol and Smart Planet Technologies partnered to launch the Super Cool Cup, an eco-friendly, recyclable, and compostable cup for cold beverages in flights.
- January 2024: Biffa launched a nationwide recycling service for takeaway drink cups in the UK, providing comprehensive support to businesses.
In-Depth Paper Cups Market Market Outlook
The global paper cups market is poised for continued growth, driven by the aforementioned factors. Strategic investments in R&D, sustainable material sourcing, and efficient manufacturing processes will be critical for success. Companies focusing on innovation, sustainability, and expanding into emerging markets are best positioned to capitalize on future opportunities within this dynamic sector.
Paper Cups Market Segmentation
-
1. Cup Type
- 1.1. Hot Paper Cups
- 1.2. Cold Paper Cups
-
2. End User
- 2.1. Quick Service Restaurants (QSRs)
- 2.2. Institutional
- 2.3. Other End Users
-
3. Wall Type
- 3.1. Single Wall Paper Cups
- 3.2. Double Wall Paper Cups
- 3.3. Triple Wall Paper Cups
Paper Cups Market Segmentation By Geography
-
1. North America
- 1.1. United States
- 1.2. Canada
-
2. Europe
- 2.1. United Kingdom
- 2.2. France
- 2.3. Germany
- 2.4. Italy
- 2.5. Spain
-
3. Asia
- 3.1. China
- 3.2. Japan
- 3.3. India
- 4. Australia and New Zealand
-
5. Latin America
- 5.1. Brazil
- 5.2. Argentina
- 5.3. Mexico
-
6. Middle East and Africa
- 6.1. Saudi Arabia
- 6.2. South Africa
- 6.3. Egypt
Paper Cups Market Regional Market Share
Geographic Coverage of Paper Cups Market
Paper Cups Market REPORT HIGHLIGHTS
| Aspects | Details |
|---|---|
| Study Period | 2020-2034 |
| Base Year | 2025 |
| Estimated Year | 2026 |
| Forecast Period | 2026-2034 |
| Historical Period | 2020-2025 |
| Growth Rate | CAGR of 3.87% from 2020-2034 |
| Segmentation |
|
Table of Contents
- 1. Introduction
- 1.1. Research Scope
- 1.2. Market Segmentation
- 1.3. Research Objective
- 1.4. Definitions and Assumptions
- 2. Executive Summary
- 2.1. Market Snapshot
- 3. Market Dynamics
- 3.1. Market Drivers
- 3.2. Market Restrains
- 3.3. Market Trends
- 3.4. Market Opportunities
- 4. Market Factor Analysis
- 4.1. Porters Five Forces
- 4.1.1. Bargaining Power of Suppliers
- 4.1.2. Bargaining Power of Buyers
- 4.1.3. Threat of New Entrants
- 4.1.4. Threat of Substitutes
- 4.1.5. Competitive Rivalry
- 4.2. PESTEL analysis
- 4.3. BCG Analysis
- 4.3.1. Stars (High Growth, High Market Share)
- 4.3.2. Cash Cows (Low Growth, High Market Share)
- 4.3.3. Question Mark (High Growth, Low Market Share)
- 4.3.4. Dogs (Low Growth, Low Market Share)
- 4.4. Ansoff Matrix Analysis
- 4.5. Supply Chain Analysis
- 4.6. Regulatory Landscape
- 4.7. Current Market Potential and Opportunity Assessment (TAM–SAM–SOM Framework)
- 4.8. NRP Analyst Note
- 4.1. Porters Five Forces
- 5. Market Analysis, Insights and Forecast 2021-2033
- 5.1. Market Analysis, Insights and Forecast - by Cup Type
- 5.1.1. Hot Paper Cups
- 5.1.2. Cold Paper Cups
- 5.2. Market Analysis, Insights and Forecast - by End User
- 5.2.1. Quick Service Restaurants (QSRs)
- 5.2.2. Institutional
- 5.2.3. Other End Users
- 5.3. Market Analysis, Insights and Forecast - by Wall Type
- 5.3.1. Single Wall Paper Cups
- 5.3.2. Double Wall Paper Cups
- 5.3.3. Triple Wall Paper Cups
- 5.4. Market Analysis, Insights and Forecast - by Region
- 5.4.1. North America
- 5.4.2. Europe
- 5.4.3. Asia
- 5.4.4. Australia and New Zealand
- 5.4.5. Latin America
- 5.4.6. Middle East and Africa
- 5.1. Market Analysis, Insights and Forecast - by Cup Type
- 6. Global Paper Cups Market Analysis, Insights and Forecast, 2021-2033
- 6.1. Market Analysis, Insights and Forecast - by Cup Type
- 6.1.1. Hot Paper Cups
- 6.1.2. Cold Paper Cups
- 6.2. Market Analysis, Insights and Forecast - by End User
- 6.2.1. Quick Service Restaurants (QSRs)
- 6.2.2. Institutional
- 6.2.3. Other End Users
- 6.3. Market Analysis, Insights and Forecast - by Wall Type
- 6.3.1. Single Wall Paper Cups
- 6.3.2. Double Wall Paper Cups
- 6.3.3. Triple Wall Paper Cups
- 6.1. Market Analysis, Insights and Forecast - by Cup Type
- 7. North America Paper Cups Market Analysis, Insights and Forecast, 2020-2032
- 7.1. Market Analysis, Insights and Forecast - by Cup Type
- 7.1.1. Hot Paper Cups
- 7.1.2. Cold Paper Cups
- 7.2. Market Analysis, Insights and Forecast - by End User
- 7.2.1. Quick Service Restaurants (QSRs)
- 7.2.2. Institutional
- 7.2.3. Other End Users
- 7.3. Market Analysis, Insights and Forecast - by Wall Type
- 7.3.1. Single Wall Paper Cups
- 7.3.2. Double Wall Paper Cups
- 7.3.3. Triple Wall Paper Cups
- 7.1. Market Analysis, Insights and Forecast - by Cup Type
- 8. Europe Paper Cups Market Analysis, Insights and Forecast, 2020-2032
- 8.1. Market Analysis, Insights and Forecast - by Cup Type
- 8.1.1. Hot Paper Cups
- 8.1.2. Cold Paper Cups
- 8.2. Market Analysis, Insights and Forecast - by End User
- 8.2.1. Quick Service Restaurants (QSRs)
- 8.2.2. Institutional
- 8.2.3. Other End Users
- 8.3. Market Analysis, Insights and Forecast - by Wall Type
- 8.3.1. Single Wall Paper Cups
- 8.3.2. Double Wall Paper Cups
- 8.3.3. Triple Wall Paper Cups
- 8.1. Market Analysis, Insights and Forecast - by Cup Type
- 9. Asia Paper Cups Market Analysis, Insights and Forecast, 2020-2032
- 9.1. Market Analysis, Insights and Forecast - by Cup Type
- 9.1.1. Hot Paper Cups
- 9.1.2. Cold Paper Cups
- 9.2. Market Analysis, Insights and Forecast - by End User
- 9.2.1. Quick Service Restaurants (QSRs)
- 9.2.2. Institutional
- 9.2.3. Other End Users
- 9.3. Market Analysis, Insights and Forecast - by Wall Type
- 9.3.1. Single Wall Paper Cups
- 9.3.2. Double Wall Paper Cups
- 9.3.3. Triple Wall Paper Cups
- 9.1. Market Analysis, Insights and Forecast - by Cup Type
- 10. Australia and New Zealand Paper Cups Market Analysis, Insights and Forecast, 2020-2032
- 10.1. Market Analysis, Insights and Forecast - by Cup Type
- 10.1.1. Hot Paper Cups
- 10.1.2. Cold Paper Cups
- 10.2. Market Analysis, Insights and Forecast - by End User
- 10.2.1. Quick Service Restaurants (QSRs)
- 10.2.2. Institutional
- 10.2.3. Other End Users
- 10.3. Market Analysis, Insights and Forecast - by Wall Type
- 10.3.1. Single Wall Paper Cups
- 10.3.2. Double Wall Paper Cups
- 10.3.3. Triple Wall Paper Cups
- 10.1. Market Analysis, Insights and Forecast - by Cup Type
- 11. Latin America Paper Cups Market Analysis, Insights and Forecast, 2020-2032
- 11.1. Market Analysis, Insights and Forecast - by Cup Type
- 11.1.1. Hot Paper Cups
- 11.1.2. Cold Paper Cups
- 11.2. Market Analysis, Insights and Forecast - by End User
- 11.2.1. Quick Service Restaurants (QSRs)
- 11.2.2. Institutional
- 11.2.3. Other End Users
- 11.3. Market Analysis, Insights and Forecast - by Wall Type
- 11.3.1. Single Wall Paper Cups
- 11.3.2. Double Wall Paper Cups
- 11.3.3. Triple Wall Paper Cups
- 11.1. Market Analysis, Insights and Forecast - by Cup Type
- 12. Middle East and Africa Paper Cups Market Analysis, Insights and Forecast, 2020-2032
- 12.1. Market Analysis, Insights and Forecast - by Cup Type
- 12.1.1. Hot Paper Cups
- 12.1.2. Cold Paper Cups
- 12.2. Market Analysis, Insights and Forecast - by End User
- 12.2.1. Quick Service Restaurants (QSRs)
- 12.2.2. Institutional
- 12.2.3. Other End Users
- 12.3. Market Analysis, Insights and Forecast - by Wall Type
- 12.3.1. Single Wall Paper Cups
- 12.3.2. Double Wall Paper Cups
- 12.3.3. Triple Wall Paper Cups
- 12.1. Market Analysis, Insights and Forecast - by Cup Type
- 13. Competitive Analysis
- 13.1. Company Profiles
- 13.1.1 Huhtamaki oyj
- 13.1.1.1. Company Overview
- 13.1.1.2. Products
- 13.1.1.3. Company Financials
- 13.1.1.4. SWOT Analysis
- 13.1.2 Kap Cones Private Limited
- 13.1.2.1. Company Overview
- 13.1.2.2. Products
- 13.1.2.3. Company Financials
- 13.1.2.4. SWOT Analysis
- 13.1.3 CEE Schisler Packaging Solution
- 13.1.3.1. Company Overview
- 13.1.3.2. Products
- 13.1.3.3. Company Financials
- 13.1.3.4. SWOT Analysis
- 13.1.4 Hotpack Global
- 13.1.4.1. Company Overview
- 13.1.4.2. Products
- 13.1.4.3. Company Financials
- 13.1.4.4. SWOT Analysis
- 13.1.5 Converpack Inc
- 13.1.5.1. Company Overview
- 13.1.5.2. Products
- 13.1.5.3. Company Financials
- 13.1.5.4. SWOT Analysis
- 13.1.6 Tekni-Plex Inc
- 13.1.6.1. Company Overview
- 13.1.6.2. Products
- 13.1.6.3. Company Financials
- 13.1.6.4. SWOT Analysis
- 13.1.7 Go-Pak UK Ltd (SCGP Packaging)
- 13.1.7.1. Company Overview
- 13.1.7.2. Products
- 13.1.7.3. Company Financials
- 13.1.7.4. SWOT Analysis
- 13.1.8 Graphic Packaging International LLC
- 13.1.8.1. Company Overview
- 13.1.8.2. Products
- 13.1.8.3. Company Financials
- 13.1.8.4. SWOT Analysis
- 13.1.9 Benders Paper Cups
- 13.1.9.1. Company Overview
- 13.1.9.2. Products
- 13.1.9.3. Company Financials
- 13.1.9.4. SWOT Analysis
- 13.1.10 Dart Container Corporation
- 13.1.10.1. Company Overview
- 13.1.10.2. Products
- 13.1.10.3. Company Financials
- 13.1.10.4. SWOT Analysis
- 13.1.1 Huhtamaki oyj
- 13.2. Market Entropy
- 13.2.1 Company's Key Areas Served
- 13.2.2 Recent Developments
- 13.3. Company Market Share Analysis 2025
- 13.3.1 Top 5 Companies Market Share Analysis
- 13.3.2 Top 3 Companies Market Share Analysis
- 13.4. List of Potential Customers
- 14. Research Methodology
List of Figures
- Figure 1: Global Paper Cups Market Revenue Breakdown (Million, %) by Region 2025 & 2033
- Figure 2: North America Paper Cups Market Revenue (Million), by Cup Type 2025 & 2033
- Figure 3: North America Paper Cups Market Revenue Share (%), by Cup Type 2025 & 2033
- Figure 4: North America Paper Cups Market Revenue (Million), by End User 2025 & 2033
- Figure 5: North America Paper Cups Market Revenue Share (%), by End User 2025 & 2033
- Figure 6: North America Paper Cups Market Revenue (Million), by Wall Type 2025 & 2033
- Figure 7: North America Paper Cups Market Revenue Share (%), by Wall Type 2025 & 2033
- Figure 8: North America Paper Cups Market Revenue (Million), by Country 2025 & 2033
- Figure 9: North America Paper Cups Market Revenue Share (%), by Country 2025 & 2033
- Figure 10: Europe Paper Cups Market Revenue (Million), by Cup Type 2025 & 2033
- Figure 11: Europe Paper Cups Market Revenue Share (%), by Cup Type 2025 & 2033
- Figure 12: Europe Paper Cups Market Revenue (Million), by End User 2025 & 2033
- Figure 13: Europe Paper Cups Market Revenue Share (%), by End User 2025 & 2033
- Figure 14: Europe Paper Cups Market Revenue (Million), by Wall Type 2025 & 2033
- Figure 15: Europe Paper Cups Market Revenue Share (%), by Wall Type 2025 & 2033
- Figure 16: Europe Paper Cups Market Revenue (Million), by Country 2025 & 2033
- Figure 17: Europe Paper Cups Market Revenue Share (%), by Country 2025 & 2033
- Figure 18: Asia Paper Cups Market Revenue (Million), by Cup Type 2025 & 2033
- Figure 19: Asia Paper Cups Market Revenue Share (%), by Cup Type 2025 & 2033
- Figure 20: Asia Paper Cups Market Revenue (Million), by End User 2025 & 2033
- Figure 21: Asia Paper Cups Market Revenue Share (%), by End User 2025 & 2033
- Figure 22: Asia Paper Cups Market Revenue (Million), by Wall Type 2025 & 2033
- Figure 23: Asia Paper Cups Market Revenue Share (%), by Wall Type 2025 & 2033
- Figure 24: Asia Paper Cups Market Revenue (Million), by Country 2025 & 2033
- Figure 25: Asia Paper Cups Market Revenue Share (%), by Country 2025 & 2033
- Figure 26: Australia and New Zealand Paper Cups Market Revenue (Million), by Cup Type 2025 & 2033
- Figure 27: Australia and New Zealand Paper Cups Market Revenue Share (%), by Cup Type 2025 & 2033
- Figure 28: Australia and New Zealand Paper Cups Market Revenue (Million), by End User 2025 & 2033
- Figure 29: Australia and New Zealand Paper Cups Market Revenue Share (%), by End User 2025 & 2033
- Figure 30: Australia and New Zealand Paper Cups Market Revenue (Million), by Wall Type 2025 & 2033
- Figure 31: Australia and New Zealand Paper Cups Market Revenue Share (%), by Wall Type 2025 & 2033
- Figure 32: Australia and New Zealand Paper Cups Market Revenue (Million), by Country 2025 & 2033
- Figure 33: Australia and New Zealand Paper Cups Market Revenue Share (%), by Country 2025 & 2033
- Figure 34: Latin America Paper Cups Market Revenue (Million), by Cup Type 2025 & 2033
- Figure 35: Latin America Paper Cups Market Revenue Share (%), by Cup Type 2025 & 2033
- Figure 36: Latin America Paper Cups Market Revenue (Million), by End User 2025 & 2033
- Figure 37: Latin America Paper Cups Market Revenue Share (%), by End User 2025 & 2033
- Figure 38: Latin America Paper Cups Market Revenue (Million), by Wall Type 2025 & 2033
- Figure 39: Latin America Paper Cups Market Revenue Share (%), by Wall Type 2025 & 2033
- Figure 40: Latin America Paper Cups Market Revenue (Million), by Country 2025 & 2033
- Figure 41: Latin America Paper Cups Market Revenue Share (%), by Country 2025 & 2033
- Figure 42: Middle East and Africa Paper Cups Market Revenue (Million), by Cup Type 2025 & 2033
- Figure 43: Middle East and Africa Paper Cups Market Revenue Share (%), by Cup Type 2025 & 2033
- Figure 44: Middle East and Africa Paper Cups Market Revenue (Million), by End User 2025 & 2033
- Figure 45: Middle East and Africa Paper Cups Market Revenue Share (%), by End User 2025 & 2033
- Figure 46: Middle East and Africa Paper Cups Market Revenue (Million), by Wall Type 2025 & 2033
- Figure 47: Middle East and Africa Paper Cups Market Revenue Share (%), by Wall Type 2025 & 2033
- Figure 48: Middle East and Africa Paper Cups Market Revenue (Million), by Country 2025 & 2033
- Figure 49: Middle East and Africa Paper Cups Market Revenue Share (%), by Country 2025 & 2033
List of Tables
- Table 1: Global Paper Cups Market Revenue Million Forecast, by Cup Type 2020 & 2033
- Table 2: Global Paper Cups Market Revenue Million Forecast, by End User 2020 & 2033
- Table 3: Global Paper Cups Market Revenue Million Forecast, by Wall Type 2020 & 2033
- Table 4: Global Paper Cups Market Revenue Million Forecast, by Region 2020 & 2033
- Table 5: Global Paper Cups Market Revenue Million Forecast, by Cup Type 2020 & 2033
- Table 6: Global Paper Cups Market Revenue Million Forecast, by End User 2020 & 2033
- Table 7: Global Paper Cups Market Revenue Million Forecast, by Wall Type 2020 & 2033
- Table 8: Global Paper Cups Market Revenue Million Forecast, by Country 2020 & 2033
- Table 9: United States Paper Cups Market Revenue (Million) Forecast, by Application 2020 & 2033
- Table 10: Canada Paper Cups Market Revenue (Million) Forecast, by Application 2020 & 2033
- Table 11: Global Paper Cups Market Revenue Million Forecast, by Cup Type 2020 & 2033
- Table 12: Global Paper Cups Market Revenue Million Forecast, by End User 2020 & 2033
- Table 13: Global Paper Cups Market Revenue Million Forecast, by Wall Type 2020 & 2033
- Table 14: Global Paper Cups Market Revenue Million Forecast, by Country 2020 & 2033
- Table 15: United Kingdom Paper Cups Market Revenue (Million) Forecast, by Application 2020 & 2033
- Table 16: France Paper Cups Market Revenue (Million) Forecast, by Application 2020 & 2033
- Table 17: Germany Paper Cups Market Revenue (Million) Forecast, by Application 2020 & 2033
- Table 18: Italy Paper Cups Market Revenue (Million) Forecast, by Application 2020 & 2033
- Table 19: Spain Paper Cups Market Revenue (Million) Forecast, by Application 2020 & 2033
- Table 20: Global Paper Cups Market Revenue Million Forecast, by Cup Type 2020 & 2033
- Table 21: Global Paper Cups Market Revenue Million Forecast, by End User 2020 & 2033
- Table 22: Global Paper Cups Market Revenue Million Forecast, by Wall Type 2020 & 2033
- Table 23: Global Paper Cups Market Revenue Million Forecast, by Country 2020 & 2033
- Table 24: China Paper Cups Market Revenue (Million) Forecast, by Application 2020 & 2033
- Table 25: Japan Paper Cups Market Revenue (Million) Forecast, by Application 2020 & 2033
- Table 26: India Paper Cups Market Revenue (Million) Forecast, by Application 2020 & 2033
- Table 27: Global Paper Cups Market Revenue Million Forecast, by Cup Type 2020 & 2033
- Table 28: Global Paper Cups Market Revenue Million Forecast, by End User 2020 & 2033
- Table 29: Global Paper Cups Market Revenue Million Forecast, by Wall Type 2020 & 2033
- Table 30: Global Paper Cups Market Revenue Million Forecast, by Country 2020 & 2033
- Table 31: Global Paper Cups Market Revenue Million Forecast, by Cup Type 2020 & 2033
- Table 32: Global Paper Cups Market Revenue Million Forecast, by End User 2020 & 2033
- Table 33: Global Paper Cups Market Revenue Million Forecast, by Wall Type 2020 & 2033
- Table 34: Global Paper Cups Market Revenue Million Forecast, by Country 2020 & 2033
- Table 35: Brazil Paper Cups Market Revenue (Million) Forecast, by Application 2020 & 2033
- Table 36: Argentina Paper Cups Market Revenue (Million) Forecast, by Application 2020 & 2033
- Table 37: Mexico Paper Cups Market Revenue (Million) Forecast, by Application 2020 & 2033
- Table 38: Global Paper Cups Market Revenue Million Forecast, by Cup Type 2020 & 2033
- Table 39: Global Paper Cups Market Revenue Million Forecast, by End User 2020 & 2033
- Table 40: Global Paper Cups Market Revenue Million Forecast, by Wall Type 2020 & 2033
- Table 41: Global Paper Cups Market Revenue Million Forecast, by Country 2020 & 2033
- Table 42: Saudi Arabia Paper Cups Market Revenue (Million) Forecast, by Application 2020 & 2033
- Table 43: South Africa Paper Cups Market Revenue (Million) Forecast, by Application 2020 & 2033
- Table 44: Egypt Paper Cups Market Revenue (Million) Forecast, by Application 2020 & 2033
Frequently Asked Questions
1. What is the projected Compound Annual Growth Rate (CAGR) of the Paper Cups Market?
The projected CAGR is approximately 3.87%.
2. Which companies are prominent players in the Paper Cups Market?
Key companies in the market include Huhtamaki oyj, Kap Cones Private Limited, CEE Schisler Packaging Solution, Hotpack Global, Converpack Inc, Tekni-Plex Inc, Go-Pak UK Ltd (SCGP Packaging), Graphic Packaging International LLC, Benders Paper Cups, Dart Container Corporation.
3. What are the main segments of the Paper Cups Market?
The market segments include Cup Type, End User, Wall Type.
4. Can you provide details about the market size?
The market size is estimated to be USD 14.03 Million as of 2022.
5. What are some drivers contributing to market growth?
Rising Demand for On-the-go Consumption of Beverages; Recent Innovations Have Aided Shelf Life.
6. What are the notable trends driving market growth?
The Quick Service Restaurants (QSRs) Segment Holds a Significant Market Share.
7. Are there any restraints impacting market growth?
Increasing Price Volatility of Raw Materials.
8. Can you provide examples of recent developments in the market?
February 2024: Linstol, a European company, partnered with Smart Planet Technologies, a United States-based company, to introduce a paper cup innovation designed for cold beverage consumption in flights called the Super Cool Cup. The Super Cool Cup leverages a patent-pending mineralized barrier coating technology to create an eco-friendly, recyclable, and compostable cup.
9. What pricing options are available for accessing the report?
Pricing options include single-user, multi-user, and enterprise licenses priced at USD 4750, USD 5250, and USD 8750 respectively.
10. Is the market size provided in terms of value or volume?
The market size is provided in terms of value, measured in Million.
11. Are there any specific market keywords associated with the report?
Yes, the market keyword associated with the report is "Paper Cups Market," which aids in identifying and referencing the specific market segment covered.
12. How do I determine which pricing option suits my needs best?
The pricing options vary based on user requirements and access needs. Individual users may opt for single-user licenses, while businesses requiring broader access may choose multi-user or enterprise licenses for cost-effective access to the report.
13. Are there any additional resources or data provided in the Paper Cups Market report?
While the report offers comprehensive insights, it's advisable to review the specific contents or supplementary materials provided to ascertain if additional resources or data are available.
14. How can I stay updated on further developments or reports in the Paper Cups Market?
To stay informed about further developments, trends, and reports in the Paper Cups Market, consider subscribing to industry newsletters, following relevant companies and organizations, or regularly checking reputable industry news sources and publications.
Methodology
Step 1 - Identification of Relevant Samples Size from Population Database


Step 2 - Approaches for Defining Global Market Size (Value, Volume* & Price*)

Note*: In applicable scenarios
Step 3 - Data Sources
Primary Research
- Web Analytics
- Survey Reports
- Research Institute
- Latest Research Reports
- Opinion Leaders
Secondary Research
- Annual Reports
- White Paper
- Latest Press Release
- Industry Association
- Paid Database
- Investor Presentations

Step 4 - Data Triangulation
Involves using different sources of information in order to increase the validity of a study
These sources are likely to be stakeholders in a program - participants, other researchers, program staff, other community members, and so on.
Then we put all data in single framework & apply various statistical tools to find out the dynamic on the market.
During the analysis stage, feedback from the stakeholder groups would be compared to determine areas of agreement as well as areas of divergence