

Key Insights
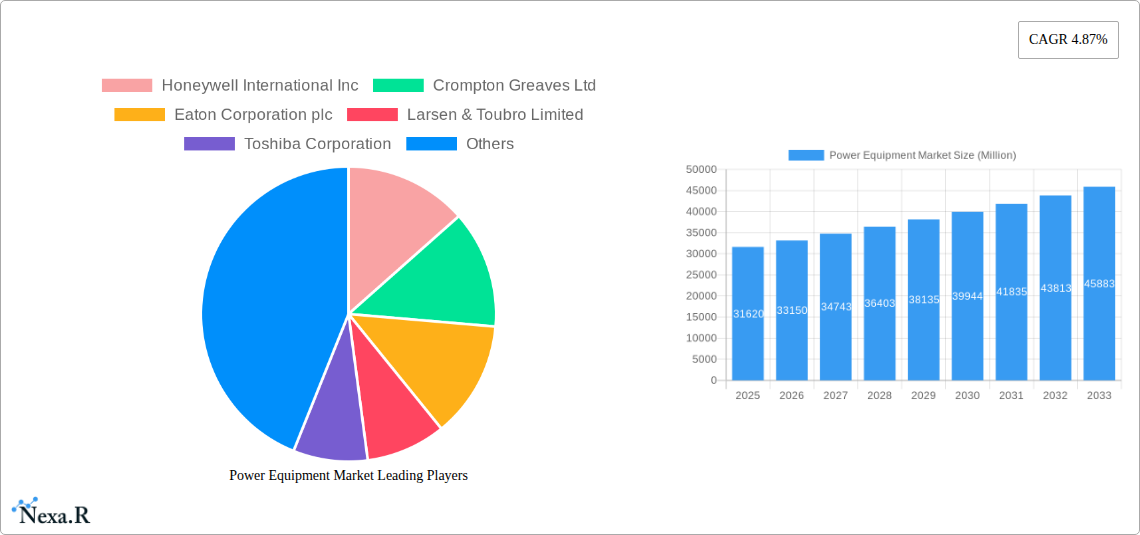
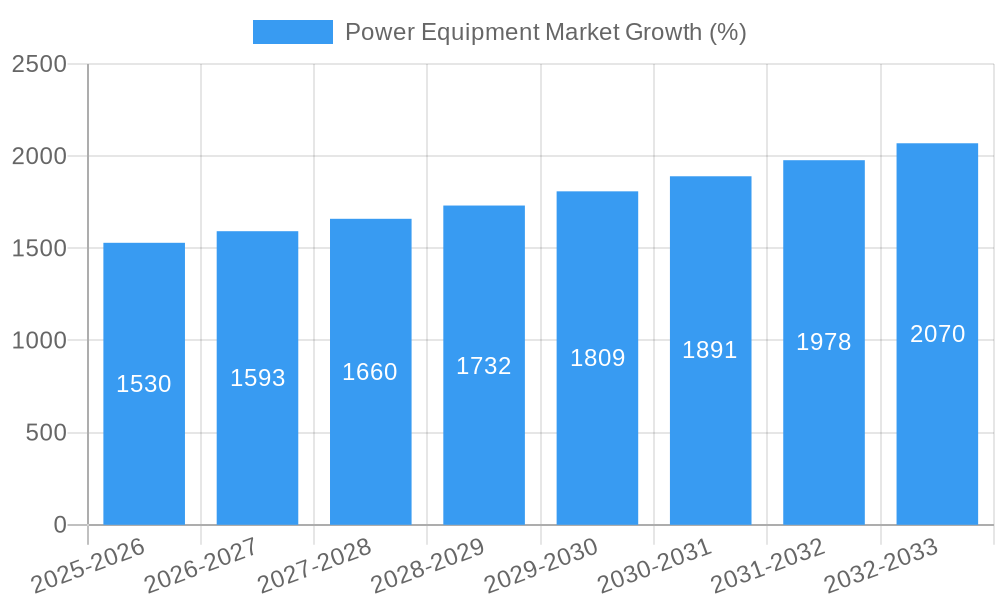
The global power equipment market, valued at $31.62 billion in 2025, is projected to experience robust growth, driven by increasing global energy demand and the ongoing transition towards renewable energy sources. A compound annual growth rate (CAGR) of 4.87% from 2025 to 2033 indicates a significant expansion of the market. Key growth drivers include the rising adoption of renewable energy technologies (solar, wind, hydro), expanding electricity grids to accommodate growing populations and industrialization, particularly in developing economies like those in Asia-Pacific, and the modernization of aging power infrastructure in developed nations. Increased investment in smart grids and energy efficiency initiatives further fuels market expansion. While challenges such as fluctuating raw material prices and stringent environmental regulations represent potential restraints, the long-term outlook remains positive, underpinned by consistent government support for renewable energy projects and smart grid deployments worldwide. The market is segmented by equipment type (generators, transformers, switchgears, circuit breakers, power cables, and other equipment), power generation source (fossil fuel, solar, wind, nuclear, hydro), end-user (residential, industrial & commercial, utility), and application (power generation, transmission, distribution). The diverse range of applications and the continuous technological advancements within the industry ensure that the market will continue to evolve and expand.
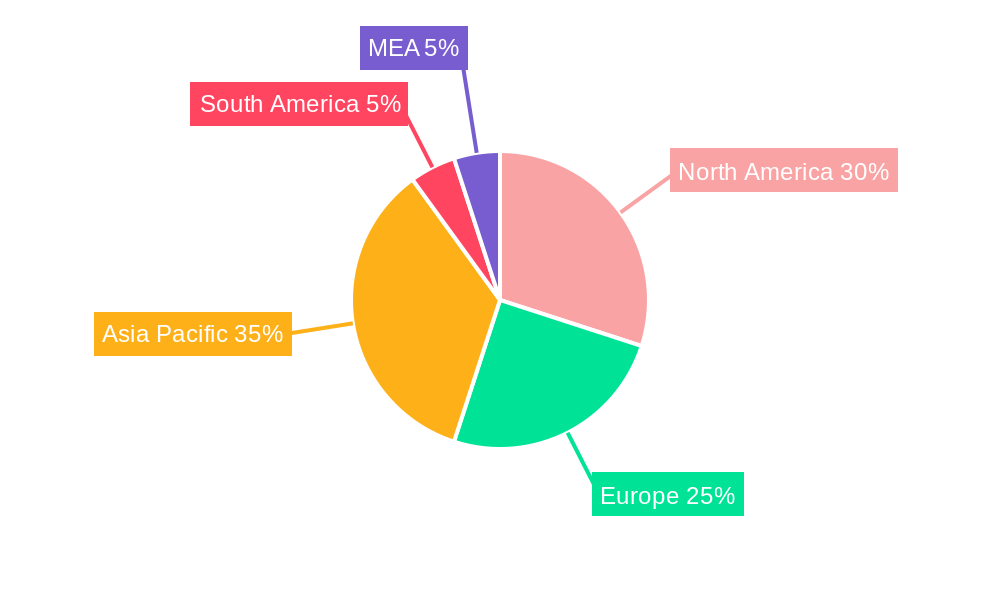
The regional breakdown reveals significant market opportunities across various geographic areas. North America, driven by robust infrastructure development and energy modernization initiatives, holds a considerable market share. Europe's established renewable energy sector and stringent environmental regulations support market growth. However, the Asia-Pacific region is expected to demonstrate the most significant growth potential, fueled by rapid industrialization, urbanization, and substantial investments in renewable energy projects across countries like China and India. This region's expanding energy needs are creating significant demand for various power equipment types. South America and the Middle East and Africa (MEA) regions are also expected to witness considerable growth, although at a potentially slower pace compared to the Asia-Pacific region, due to ongoing infrastructure development and increasing electricity demands. Competition within the market is intense, with major players like Honeywell, Eaton, Siemens, ABB, and others continually innovating to maintain a competitive edge and meet the evolving market demands.
Power Equipment Market: A Comprehensive Market Report (2019-2033)
This comprehensive report provides an in-depth analysis of the global Power Equipment Market, encompassing its parent market (Energy Sector) and child markets (Power Generation, Transmission, and Distribution). The report covers the period from 2019 to 2033, with a focus on the forecast period of 2025-2033, and a base year of 2025. The market size is valued in million units. Key segments analyzed include Equipment Type (Generator, Transformer, Switchgears, Circuit Breakers, Power Cable, Other Equipment Types), Power Generation Source (Fossil Fuel Based, Solar, Wind, Nuclear, Hydro), End-User (Residential, Industrial & Commercial, Utility), and Application (Power Generation, Transmission, Distribution). Leading companies like Honeywell International Inc, Crompton Greaves Ltd, Eaton Corporation plc, Larsen & Toubro Limited, Toshiba Corporation, Fuji Electric Co Ltd, Bharat Heavy Electricals Limited, Mitsubishi Electric Corporation, Siemens AG, Schneider Electric SE, ABB Ltd, Rockwell Automation Inc, and General Electric Company are profiled.
Power Equipment Market Dynamics & Structure
The Power Equipment market is characterized by moderate concentration, with a few major players holding significant market share. Technological innovation, particularly in renewable energy integration and smart grid technologies, is a key driver. Stringent regulatory frameworks concerning environmental sustainability and grid reliability influence market dynamics. Competitive substitutes, such as distributed generation systems, pose challenges. End-user demographics, particularly the shift towards renewable energy adoption by utilities and industrial consumers, significantly impact market growth. M&A activity in the sector has been relatively active, with xx major deals recorded between 2019 and 2024, representing a xx% increase compared to the previous period.
- Market Concentration: Moderately concentrated, with top 5 players holding approximately xx% market share in 2024.
- Technological Innovation: Focus on enhancing efficiency, reliability, and integration of renewable energy sources. Significant barriers to entry exist due to high R&D costs and stringent safety regulations.
- Regulatory Frameworks: Governments worldwide are implementing policies to promote renewable energy adoption and improve grid modernization, creating both opportunities and challenges for market players.
- Competitive Substitutes: Distributed generation and microgrids are emerging as competitive alternatives in certain segments.
- End-User Demographics: The increasing demand for electricity from industrial and commercial sectors and the growing adoption of renewable energy sources by residential consumers are driving market expansion.
- M&A Trends: Consolidation is a notable trend, driven by the pursuit of economies of scale and technological synergy. The average deal value increased to xx million units in 2024.
Power Equipment Market Growth Trends & Insights
The global power equipment market exhibited robust growth during the historical period (2019-2024), registering a CAGR of xx%. This growth was fueled by rising energy demand, infrastructure development, and increasing investments in renewable energy projects. The market is projected to maintain a healthy growth trajectory during the forecast period (2025-2033), with a forecasted CAGR of xx%, driven by factors such as increasing urbanization, industrialization, and government initiatives promoting energy efficiency and renewable energy deployment. Technological disruptions, such as the adoption of smart grid technologies and advanced energy storage solutions, are further accelerating market growth. Consumer behavior is shifting towards environmentally friendly solutions, fostering the demand for renewable energy-based power equipment. Market penetration of renewable energy equipment is expected to reach xx% by 2033.
Dominant Regions, Countries, or Segments in Power Equipment Market
The Asia-Pacific region dominated the power equipment market in 2024, accounting for approximately xx% of the global market share. This dominance is primarily attributed to rapid economic growth, large-scale infrastructure development projects, and increasing investments in renewable energy capacity. Within the region, India and China emerged as key markets, driven by strong government support for energy infrastructure expansion and renewable energy targets. The North American and European markets also hold significant market share, driven by grid modernization initiatives and the increasing adoption of smart grid technologies.
- Key Drivers in Asia-Pacific: Rapid economic growth, rising energy demand, significant investments in infrastructure projects, government support for renewable energy development.
- Dominance Factors: Large population base, growing industrialization, and favorable government policies promoting energy security and renewable energy adoption.
- Growth Potential: Significant growth potential remains in Southeast Asia, driven by the expansion of electricity grids and rising urbanization.
Among equipment types, the transformer segment held the largest market share in 2024 due to its importance in power transmission and distribution. The renewable energy segment witnessed the highest growth rate, driven by the global shift towards cleaner energy sources.
Power Equipment Market Product Landscape
The power equipment market is witnessing a wave of product innovations, focusing on improving efficiency, reliability, and sustainability. New products are incorporating smart grid technologies, advanced materials, and sophisticated control systems. Key features include improved energy efficiency, enhanced safety features, remote monitoring capabilities, and reduced maintenance requirements. Manufacturers are focusing on offering tailored solutions to meet the specific needs of different end-users and applications.
Key Drivers, Barriers & Challenges in Power Equipment Market
Key Drivers:
- Increasing global energy demand fueled by population growth and industrialization.
- Government initiatives promoting renewable energy and grid modernization.
- Technological advancements leading to improved efficiency and reliability of power equipment.
- Expanding smart grid infrastructure requiring advanced power equipment.
Key Challenges:
- High initial investment costs for renewable energy equipment.
- Supply chain disruptions and material price fluctuations.
- Stringent regulatory compliance requirements and safety standards.
- Intense competition among established and emerging players. This leads to pricing pressures and margin erosion, estimated to impact profitability by xx% by 2033.
Emerging Opportunities in Power Equipment Market
- Growing demand for energy storage systems to support intermittent renewable energy sources.
- Expansion of microgrids and distributed generation systems.
- Increasing adoption of smart grid technologies and advanced metering infrastructure (AMI).
- Growth in the electric vehicle (EV) charging infrastructure market driving demand for associated power equipment.
Growth Accelerators in the Power Equipment Market Industry
Technological advancements, particularly in renewable energy technologies and smart grid infrastructure, are key growth catalysts. Strategic partnerships and collaborations between equipment manufacturers, energy providers, and technology companies are fostering innovation and market expansion. Government policies promoting renewable energy adoption and grid modernization are also crucial drivers of long-term market growth.
Key Players Shaping the Power Equipment Market Market
- Honeywell International Inc
- Crompton Greaves Ltd
- Eaton Corporation plc
- Larsen & Toubro Limited
- Toshiba Corporation
- Fuji Electric Co Ltd
- Bharat Heavy Electricals Limited
- Mitsubishi Electric Corporation
- Siemens AG
- Schneider Electric SE
- ABB Ltd
- Rockwell Automation Inc
- General Electric Company
Notable Milestones in Power Equipment Market Sector
- May 2023: CAT launched its new power equipment product, the new CAT 60 Volt range, featuring advanced lithium-ion batteries with intelligent management systems. This launch signifies a step towards higher efficiency and smarter power tools.
- May 2022: The Union Ministry of Power and New and Renewable Energy, India, proposed a scheme to establish three manufacturing zones for power equipment by 2026-27. This initiative is expected to boost domestic manufacturing and reduce reliance on imports.
In-Depth Power Equipment Market Market Outlook
The power equipment market is poised for continued growth driven by factors such as the global transition towards renewable energy, expanding smart grid infrastructure, and increasing energy demand in developing economies. Strategic investments in research and development, coupled with strategic partnerships and mergers and acquisitions, will further accelerate market expansion. Opportunities exist in developing niche markets such as energy storage systems, microgrids, and smart grid technologies. The market is expected to witness significant innovation and consolidation in the coming years, leading to a more efficient and sustainable power sector.
Power Equipment Market Segmentation
-
1. Equipment Type
- 1.1. Generator
- 1.2. Transformer
- 1.3. Switchgears
- 1.4. Circuit Breakers
- 1.5. Power Cable
- 1.6. Other Equipment Types
-
2. Power Generation Source
- 2.1. Fossil Fuel Based
- 2.2. Solar
- 2.3. Wind
- 2.4. Nuclear
- 2.5. Hydro
-
3. End-User
- 3.1. Residential
- 3.2. Industrial and Commercial
- 3.3. Utility
-
4. Application
- 4.1. Power Generation
- 4.2. Transmission
- 4.3. Distribution
Power Equipment Market Segmentation By Geography
-
1. North America
- 1.1. United States
- 1.2. Canada
- 1.3. Rest of North America
-
2. Europe
- 2.1. Germany
- 2.2. France
- 2.3. United Kingdom
- 2.4. Russia
- 2.5. Rest of Europe
-
3. Asia Pacific
- 3.1. China
- 3.2. India
- 3.3. Australia
- 3.4. Japan
- 3.5. Rest of Asia Pacific
-
4. Middle East and Africa
- 4.1. Saudi Arabia
- 4.2. United Arab Emirates
- 4.3. Nigeria
- 4.4. South Africa
- 4.5. Rest of Middle East and Africa
-
5. South America
- 5.1. Brazil
- 5.2. Argentina
- 5.3. Chile
- 5.4. Rest of South America
Power Equipment Market REPORT HIGHLIGHTS
| Aspects | Details |
|---|---|
| Study Period | 2019-2033 |
| Base Year | 2024 |
| Estimated Year | 2025 |
| Forecast Period | 2025-2033 |
| Historical Period | 2019-2024 |
| Growth Rate | CAGR of 4.87% from 2019-2033 |
| Segmentation |
|
Table of Contents
- 1. Introduction
- 1.1. Research Scope
- 1.2. Market Segmentation
- 1.3. Research Methodology
- 1.4. Definitions and Assumptions
- 2. Executive Summary
- 2.1. Introduction
- 3. Market Dynamics
- 3.1. Introduction
- 3.2. Market Drivers
- 3.2.1. 4.; Increasing Population Growth and Infrastructure Development
- 3.3. Market Restrains
- 3.3.1. 4.; High Operational and Maintenance Costs
- 3.4. Market Trends
- 3.4.1. Power Generation Expected to Dominate the Market
- 4. Market Factor Analysis
- 4.1. Porters Five Forces
- 4.2. Supply/Value Chain
- 4.3. PESTEL analysis
- 4.4. Market Entropy
- 4.5. Patent/Trademark Analysis
- 5. Global Power Equipment Market Analysis, Insights and Forecast, 2019-2031
- 5.1. Market Analysis, Insights and Forecast - by Equipment Type
- 5.1.1. Generator
- 5.1.2. Transformer
- 5.1.3. Switchgears
- 5.1.4. Circuit Breakers
- 5.1.5. Power Cable
- 5.1.6. Other Equipment Types
- 5.2. Market Analysis, Insights and Forecast - by Power Generation Source
- 5.2.1. Fossil Fuel Based
- 5.2.2. Solar
- 5.2.3. Wind
- 5.2.4. Nuclear
- 5.2.5. Hydro
- 5.3. Market Analysis, Insights and Forecast - by End-User
- 5.3.1. Residential
- 5.3.2. Industrial and Commercial
- 5.3.3. Utility
- 5.4. Market Analysis, Insights and Forecast - by Application
- 5.4.1. Power Generation
- 5.4.2. Transmission
- 5.4.3. Distribution
- 5.5. Market Analysis, Insights and Forecast - by Region
- 5.5.1. North America
- 5.5.2. Europe
- 5.5.3. Asia Pacific
- 5.5.4. Middle East and Africa
- 5.5.5. South America
- 5.1. Market Analysis, Insights and Forecast - by Equipment Type
- 6. North America Power Equipment Market Analysis, Insights and Forecast, 2019-2031
- 6.1. Market Analysis, Insights and Forecast - by Equipment Type
- 6.1.1. Generator
- 6.1.2. Transformer
- 6.1.3. Switchgears
- 6.1.4. Circuit Breakers
- 6.1.5. Power Cable
- 6.1.6. Other Equipment Types
- 6.2. Market Analysis, Insights and Forecast - by Power Generation Source
- 6.2.1. Fossil Fuel Based
- 6.2.2. Solar
- 6.2.3. Wind
- 6.2.4. Nuclear
- 6.2.5. Hydro
- 6.3. Market Analysis, Insights and Forecast - by End-User
- 6.3.1. Residential
- 6.3.2. Industrial and Commercial
- 6.3.3. Utility
- 6.4. Market Analysis, Insights and Forecast - by Application
- 6.4.1. Power Generation
- 6.4.2. Transmission
- 6.4.3. Distribution
- 6.1. Market Analysis, Insights and Forecast - by Equipment Type
- 7. Europe Power Equipment Market Analysis, Insights and Forecast, 2019-2031
- 7.1. Market Analysis, Insights and Forecast - by Equipment Type
- 7.1.1. Generator
- 7.1.2. Transformer
- 7.1.3. Switchgears
- 7.1.4. Circuit Breakers
- 7.1.5. Power Cable
- 7.1.6. Other Equipment Types
- 7.2. Market Analysis, Insights and Forecast - by Power Generation Source
- 7.2.1. Fossil Fuel Based
- 7.2.2. Solar
- 7.2.3. Wind
- 7.2.4. Nuclear
- 7.2.5. Hydro
- 7.3. Market Analysis, Insights and Forecast - by End-User
- 7.3.1. Residential
- 7.3.2. Industrial and Commercial
- 7.3.3. Utility
- 7.4. Market Analysis, Insights and Forecast - by Application
- 7.4.1. Power Generation
- 7.4.2. Transmission
- 7.4.3. Distribution
- 7.1. Market Analysis, Insights and Forecast - by Equipment Type
- 8. Asia Pacific Power Equipment Market Analysis, Insights and Forecast, 2019-2031
- 8.1. Market Analysis, Insights and Forecast - by Equipment Type
- 8.1.1. Generator
- 8.1.2. Transformer
- 8.1.3. Switchgears
- 8.1.4. Circuit Breakers
- 8.1.5. Power Cable
- 8.1.6. Other Equipment Types
- 8.2. Market Analysis, Insights and Forecast - by Power Generation Source
- 8.2.1. Fossil Fuel Based
- 8.2.2. Solar
- 8.2.3. Wind
- 8.2.4. Nuclear
- 8.2.5. Hydro
- 8.3. Market Analysis, Insights and Forecast - by End-User
- 8.3.1. Residential
- 8.3.2. Industrial and Commercial
- 8.3.3. Utility
- 8.4. Market Analysis, Insights and Forecast - by Application
- 8.4.1. Power Generation
- 8.4.2. Transmission
- 8.4.3. Distribution
- 8.1. Market Analysis, Insights and Forecast - by Equipment Type
- 9. Middle East and Africa Power Equipment Market Analysis, Insights and Forecast, 2019-2031
- 9.1. Market Analysis, Insights and Forecast - by Equipment Type
- 9.1.1. Generator
- 9.1.2. Transformer
- 9.1.3. Switchgears
- 9.1.4. Circuit Breakers
- 9.1.5. Power Cable
- 9.1.6. Other Equipment Types
- 9.2. Market Analysis, Insights and Forecast - by Power Generation Source
- 9.2.1. Fossil Fuel Based
- 9.2.2. Solar
- 9.2.3. Wind
- 9.2.4. Nuclear
- 9.2.5. Hydro
- 9.3. Market Analysis, Insights and Forecast - by End-User
- 9.3.1. Residential
- 9.3.2. Industrial and Commercial
- 9.3.3. Utility
- 9.4. Market Analysis, Insights and Forecast - by Application
- 9.4.1. Power Generation
- 9.4.2. Transmission
- 9.4.3. Distribution
- 9.1. Market Analysis, Insights and Forecast - by Equipment Type
- 10. South America Power Equipment Market Analysis, Insights and Forecast, 2019-2031
- 10.1. Market Analysis, Insights and Forecast - by Equipment Type
- 10.1.1. Generator
- 10.1.2. Transformer
- 10.1.3. Switchgears
- 10.1.4. Circuit Breakers
- 10.1.5. Power Cable
- 10.1.6. Other Equipment Types
- 10.2. Market Analysis, Insights and Forecast - by Power Generation Source
- 10.2.1. Fossil Fuel Based
- 10.2.2. Solar
- 10.2.3. Wind
- 10.2.4. Nuclear
- 10.2.5. Hydro
- 10.3. Market Analysis, Insights and Forecast - by End-User
- 10.3.1. Residential
- 10.3.2. Industrial and Commercial
- 10.3.3. Utility
- 10.4. Market Analysis, Insights and Forecast - by Application
- 10.4.1. Power Generation
- 10.4.2. Transmission
- 10.4.3. Distribution
- 10.1. Market Analysis, Insights and Forecast - by Equipment Type
- 11. North America Power Equipment Market Analysis, Insights and Forecast, 2019-2031
- 11.1. Market Analysis, Insights and Forecast - By Country/Sub-region
- 11.1.1 United States
- 11.1.2 Canada
- 11.1.3 Mexico
- 12. Europe Power Equipment Market Analysis, Insights and Forecast, 2019-2031
- 12.1. Market Analysis, Insights and Forecast - By Country/Sub-region
- 12.1.1 Germany
- 12.1.2 United Kingdom
- 12.1.3 France
- 12.1.4 Spain
- 12.1.5 Italy
- 12.1.6 Spain
- 12.1.7 Belgium
- 12.1.8 Netherland
- 12.1.9 Nordics
- 12.1.10 Rest of Europe
- 13. Asia Pacific Power Equipment Market Analysis, Insights and Forecast, 2019-2031
- 13.1. Market Analysis, Insights and Forecast - By Country/Sub-region
- 13.1.1 China
- 13.1.2 Japan
- 13.1.3 India
- 13.1.4 South Korea
- 13.1.5 Southeast Asia
- 13.1.6 Australia
- 13.1.7 Indonesia
- 13.1.8 Phillipes
- 13.1.9 Singapore
- 13.1.10 Thailandc
- 13.1.11 Rest of Asia Pacific
- 14. South America Power Equipment Market Analysis, Insights and Forecast, 2019-2031
- 14.1. Market Analysis, Insights and Forecast - By Country/Sub-region
- 14.1.1 Brazil
- 14.1.2 Argentina
- 14.1.3 Peru
- 14.1.4 Chile
- 14.1.5 Colombia
- 14.1.6 Ecuador
- 14.1.7 Venezuela
- 14.1.8 Rest of South America
- 15. MEA Power Equipment Market Analysis, Insights and Forecast, 2019-2031
- 15.1. Market Analysis, Insights and Forecast - By Country/Sub-region
- 15.1.1 United Arab Emirates
- 15.1.2 Saudi Arabia
- 15.1.3 South Africa
- 15.1.4 Rest of Middle East and Africa
- 16. Competitive Analysis
- 16.1. Global Market Share Analysis 2024
- 16.2. Company Profiles
- 16.2.1 Honeywell International Inc
- 16.2.1.1. Overview
- 16.2.1.2. Products
- 16.2.1.3. SWOT Analysis
- 16.2.1.4. Recent Developments
- 16.2.1.5. Financials (Based on Availability)
- 16.2.2 Crompton Greaves Ltd
- 16.2.2.1. Overview
- 16.2.2.2. Products
- 16.2.2.3. SWOT Analysis
- 16.2.2.4. Recent Developments
- 16.2.2.5. Financials (Based on Availability)
- 16.2.3 Eaton Corporation plc
- 16.2.3.1. Overview
- 16.2.3.2. Products
- 16.2.3.3. SWOT Analysis
- 16.2.3.4. Recent Developments
- 16.2.3.5. Financials (Based on Availability)
- 16.2.4 Larsen & Toubro Limited
- 16.2.4.1. Overview
- 16.2.4.2. Products
- 16.2.4.3. SWOT Analysis
- 16.2.4.4. Recent Developments
- 16.2.4.5. Financials (Based on Availability)
- 16.2.5 Toshiba Corporation
- 16.2.5.1. Overview
- 16.2.5.2. Products
- 16.2.5.3. SWOT Analysis
- 16.2.5.4. Recent Developments
- 16.2.5.5. Financials (Based on Availability)
- 16.2.6 Fuji Electric Co Ltd
- 16.2.6.1. Overview
- 16.2.6.2. Products
- 16.2.6.3. SWOT Analysis
- 16.2.6.4. Recent Developments
- 16.2.6.5. Financials (Based on Availability)
- 16.2.7 Bharat Heavy Electricals Limited
- 16.2.7.1. Overview
- 16.2.7.2. Products
- 16.2.7.3. SWOT Analysis
- 16.2.7.4. Recent Developments
- 16.2.7.5. Financials (Based on Availability)
- 16.2.8 Mitsubishi Electric Corporation
- 16.2.8.1. Overview
- 16.2.8.2. Products
- 16.2.8.3. SWOT Analysis
- 16.2.8.4. Recent Developments
- 16.2.8.5. Financials (Based on Availability)
- 16.2.9 Siemens AG
- 16.2.9.1. Overview
- 16.2.9.2. Products
- 16.2.9.3. SWOT Analysis
- 16.2.9.4. Recent Developments
- 16.2.9.5. Financials (Based on Availability)
- 16.2.10 Schneider Electric SE
- 16.2.10.1. Overview
- 16.2.10.2. Products
- 16.2.10.3. SWOT Analysis
- 16.2.10.4. Recent Developments
- 16.2.10.5. Financials (Based on Availability)
- 16.2.11 ABB Ltd
- 16.2.11.1. Overview
- 16.2.11.2. Products
- 16.2.11.3. SWOT Analysis
- 16.2.11.4. Recent Developments
- 16.2.11.5. Financials (Based on Availability)
- 16.2.12 Rockwell Automation Inc
- 16.2.12.1. Overview
- 16.2.12.2. Products
- 16.2.12.3. SWOT Analysis
- 16.2.12.4. Recent Developments
- 16.2.12.5. Financials (Based on Availability)
- 16.2.13 General Electric Company
- 16.2.13.1. Overview
- 16.2.13.2. Products
- 16.2.13.3. SWOT Analysis
- 16.2.13.4. Recent Developments
- 16.2.13.5. Financials (Based on Availability)
- 16.2.1 Honeywell International Inc
List of Figures
- Figure 1: Global Power Equipment Market Revenue Breakdown (Million, %) by Region 2024 & 2032
- Figure 2: Global Power Equipment Market Volume Breakdown (K Unit, %) by Region 2024 & 2032
- Figure 3: North America Power Equipment Market Revenue (Million), by Country 2024 & 2032
- Figure 4: North America Power Equipment Market Volume (K Unit), by Country 2024 & 2032
- Figure 5: North America Power Equipment Market Revenue Share (%), by Country 2024 & 2032
- Figure 6: North America Power Equipment Market Volume Share (%), by Country 2024 & 2032
- Figure 7: Europe Power Equipment Market Revenue (Million), by Country 2024 & 2032
- Figure 8: Europe Power Equipment Market Volume (K Unit), by Country 2024 & 2032
- Figure 9: Europe Power Equipment Market Revenue Share (%), by Country 2024 & 2032
- Figure 10: Europe Power Equipment Market Volume Share (%), by Country 2024 & 2032
- Figure 11: Asia Pacific Power Equipment Market Revenue (Million), by Country 2024 & 2032
- Figure 12: Asia Pacific Power Equipment Market Volume (K Unit), by Country 2024 & 2032
- Figure 13: Asia Pacific Power Equipment Market Revenue Share (%), by Country 2024 & 2032
- Figure 14: Asia Pacific Power Equipment Market Volume Share (%), by Country 2024 & 2032
- Figure 15: South America Power Equipment Market Revenue (Million), by Country 2024 & 2032
- Figure 16: South America Power Equipment Market Volume (K Unit), by Country 2024 & 2032
- Figure 17: South America Power Equipment Market Revenue Share (%), by Country 2024 & 2032
- Figure 18: South America Power Equipment Market Volume Share (%), by Country 2024 & 2032
- Figure 19: MEA Power Equipment Market Revenue (Million), by Country 2024 & 2032
- Figure 20: MEA Power Equipment Market Volume (K Unit), by Country 2024 & 2032
- Figure 21: MEA Power Equipment Market Revenue Share (%), by Country 2024 & 2032
- Figure 22: MEA Power Equipment Market Volume Share (%), by Country 2024 & 2032
- Figure 23: North America Power Equipment Market Revenue (Million), by Equipment Type 2024 & 2032
- Figure 24: North America Power Equipment Market Volume (K Unit), by Equipment Type 2024 & 2032
- Figure 25: North America Power Equipment Market Revenue Share (%), by Equipment Type 2024 & 2032
- Figure 26: North America Power Equipment Market Volume Share (%), by Equipment Type 2024 & 2032
- Figure 27: North America Power Equipment Market Revenue (Million), by Power Generation Source 2024 & 2032
- Figure 28: North America Power Equipment Market Volume (K Unit), by Power Generation Source 2024 & 2032
- Figure 29: North America Power Equipment Market Revenue Share (%), by Power Generation Source 2024 & 2032
- Figure 30: North America Power Equipment Market Volume Share (%), by Power Generation Source 2024 & 2032
- Figure 31: North America Power Equipment Market Revenue (Million), by End-User 2024 & 2032
- Figure 32: North America Power Equipment Market Volume (K Unit), by End-User 2024 & 2032
- Figure 33: North America Power Equipment Market Revenue Share (%), by End-User 2024 & 2032
- Figure 34: North America Power Equipment Market Volume Share (%), by End-User 2024 & 2032
- Figure 35: North America Power Equipment Market Revenue (Million), by Application 2024 & 2032
- Figure 36: North America Power Equipment Market Volume (K Unit), by Application 2024 & 2032
- Figure 37: North America Power Equipment Market Revenue Share (%), by Application 2024 & 2032
- Figure 38: North America Power Equipment Market Volume Share (%), by Application 2024 & 2032
- Figure 39: North America Power Equipment Market Revenue (Million), by Country 2024 & 2032
- Figure 40: North America Power Equipment Market Volume (K Unit), by Country 2024 & 2032
- Figure 41: North America Power Equipment Market Revenue Share (%), by Country 2024 & 2032
- Figure 42: North America Power Equipment Market Volume Share (%), by Country 2024 & 2032
- Figure 43: Europe Power Equipment Market Revenue (Million), by Equipment Type 2024 & 2032
- Figure 44: Europe Power Equipment Market Volume (K Unit), by Equipment Type 2024 & 2032
- Figure 45: Europe Power Equipment Market Revenue Share (%), by Equipment Type 2024 & 2032
- Figure 46: Europe Power Equipment Market Volume Share (%), by Equipment Type 2024 & 2032
- Figure 47: Europe Power Equipment Market Revenue (Million), by Power Generation Source 2024 & 2032
- Figure 48: Europe Power Equipment Market Volume (K Unit), by Power Generation Source 2024 & 2032
- Figure 49: Europe Power Equipment Market Revenue Share (%), by Power Generation Source 2024 & 2032
- Figure 50: Europe Power Equipment Market Volume Share (%), by Power Generation Source 2024 & 2032
- Figure 51: Europe Power Equipment Market Revenue (Million), by End-User 2024 & 2032
- Figure 52: Europe Power Equipment Market Volume (K Unit), by End-User 2024 & 2032
- Figure 53: Europe Power Equipment Market Revenue Share (%), by End-User 2024 & 2032
- Figure 54: Europe Power Equipment Market Volume Share (%), by End-User 2024 & 2032
- Figure 55: Europe Power Equipment Market Revenue (Million), by Application 2024 & 2032
- Figure 56: Europe Power Equipment Market Volume (K Unit), by Application 2024 & 2032
- Figure 57: Europe Power Equipment Market Revenue Share (%), by Application 2024 & 2032
- Figure 58: Europe Power Equipment Market Volume Share (%), by Application 2024 & 2032
- Figure 59: Europe Power Equipment Market Revenue (Million), by Country 2024 & 2032
- Figure 60: Europe Power Equipment Market Volume (K Unit), by Country 2024 & 2032
- Figure 61: Europe Power Equipment Market Revenue Share (%), by Country 2024 & 2032
- Figure 62: Europe Power Equipment Market Volume Share (%), by Country 2024 & 2032
- Figure 63: Asia Pacific Power Equipment Market Revenue (Million), by Equipment Type 2024 & 2032
- Figure 64: Asia Pacific Power Equipment Market Volume (K Unit), by Equipment Type 2024 & 2032
- Figure 65: Asia Pacific Power Equipment Market Revenue Share (%), by Equipment Type 2024 & 2032
- Figure 66: Asia Pacific Power Equipment Market Volume Share (%), by Equipment Type 2024 & 2032
- Figure 67: Asia Pacific Power Equipment Market Revenue (Million), by Power Generation Source 2024 & 2032
- Figure 68: Asia Pacific Power Equipment Market Volume (K Unit), by Power Generation Source 2024 & 2032
- Figure 69: Asia Pacific Power Equipment Market Revenue Share (%), by Power Generation Source 2024 & 2032
- Figure 70: Asia Pacific Power Equipment Market Volume Share (%), by Power Generation Source 2024 & 2032
- Figure 71: Asia Pacific Power Equipment Market Revenue (Million), by End-User 2024 & 2032
- Figure 72: Asia Pacific Power Equipment Market Volume (K Unit), by End-User 2024 & 2032
- Figure 73: Asia Pacific Power Equipment Market Revenue Share (%), by End-User 2024 & 2032
- Figure 74: Asia Pacific Power Equipment Market Volume Share (%), by End-User 2024 & 2032
- Figure 75: Asia Pacific Power Equipment Market Revenue (Million), by Application 2024 & 2032
- Figure 76: Asia Pacific Power Equipment Market Volume (K Unit), by Application 2024 & 2032
- Figure 77: Asia Pacific Power Equipment Market Revenue Share (%), by Application 2024 & 2032
- Figure 78: Asia Pacific Power Equipment Market Volume Share (%), by Application 2024 & 2032
- Figure 79: Asia Pacific Power Equipment Market Revenue (Million), by Country 2024 & 2032
- Figure 80: Asia Pacific Power Equipment Market Volume (K Unit), by Country 2024 & 2032
- Figure 81: Asia Pacific Power Equipment Market Revenue Share (%), by Country 2024 & 2032
- Figure 82: Asia Pacific Power Equipment Market Volume Share (%), by Country 2024 & 2032
- Figure 83: Middle East and Africa Power Equipment Market Revenue (Million), by Equipment Type 2024 & 2032
- Figure 84: Middle East and Africa Power Equipment Market Volume (K Unit), by Equipment Type 2024 & 2032
- Figure 85: Middle East and Africa Power Equipment Market Revenue Share (%), by Equipment Type 2024 & 2032
- Figure 86: Middle East and Africa Power Equipment Market Volume Share (%), by Equipment Type 2024 & 2032
- Figure 87: Middle East and Africa Power Equipment Market Revenue (Million), by Power Generation Source 2024 & 2032
- Figure 88: Middle East and Africa Power Equipment Market Volume (K Unit), by Power Generation Source 2024 & 2032
- Figure 89: Middle East and Africa Power Equipment Market Revenue Share (%), by Power Generation Source 2024 & 2032
- Figure 90: Middle East and Africa Power Equipment Market Volume Share (%), by Power Generation Source 2024 & 2032
- Figure 91: Middle East and Africa Power Equipment Market Revenue (Million), by End-User 2024 & 2032
- Figure 92: Middle East and Africa Power Equipment Market Volume (K Unit), by End-User 2024 & 2032
- Figure 93: Middle East and Africa Power Equipment Market Revenue Share (%), by End-User 2024 & 2032
- Figure 94: Middle East and Africa Power Equipment Market Volume Share (%), by End-User 2024 & 2032
- Figure 95: Middle East and Africa Power Equipment Market Revenue (Million), by Application 2024 & 2032
- Figure 96: Middle East and Africa Power Equipment Market Volume (K Unit), by Application 2024 & 2032
- Figure 97: Middle East and Africa Power Equipment Market Revenue Share (%), by Application 2024 & 2032
- Figure 98: Middle East and Africa Power Equipment Market Volume Share (%), by Application 2024 & 2032
- Figure 99: Middle East and Africa Power Equipment Market Revenue (Million), by Country 2024 & 2032
- Figure 100: Middle East and Africa Power Equipment Market Volume (K Unit), by Country 2024 & 2032
- Figure 101: Middle East and Africa Power Equipment Market Revenue Share (%), by Country 2024 & 2032
- Figure 102: Middle East and Africa Power Equipment Market Volume Share (%), by Country 2024 & 2032
- Figure 103: South America Power Equipment Market Revenue (Million), by Equipment Type 2024 & 2032
- Figure 104: South America Power Equipment Market Volume (K Unit), by Equipment Type 2024 & 2032
- Figure 105: South America Power Equipment Market Revenue Share (%), by Equipment Type 2024 & 2032
- Figure 106: South America Power Equipment Market Volume Share (%), by Equipment Type 2024 & 2032
- Figure 107: South America Power Equipment Market Revenue (Million), by Power Generation Source 2024 & 2032
- Figure 108: South America Power Equipment Market Volume (K Unit), by Power Generation Source 2024 & 2032
- Figure 109: South America Power Equipment Market Revenue Share (%), by Power Generation Source 2024 & 2032
- Figure 110: South America Power Equipment Market Volume Share (%), by Power Generation Source 2024 & 2032
- Figure 111: South America Power Equipment Market Revenue (Million), by End-User 2024 & 2032
- Figure 112: South America Power Equipment Market Volume (K Unit), by End-User 2024 & 2032
- Figure 113: South America Power Equipment Market Revenue Share (%), by End-User 2024 & 2032
- Figure 114: South America Power Equipment Market Volume Share (%), by End-User 2024 & 2032
- Figure 115: South America Power Equipment Market Revenue (Million), by Application 2024 & 2032
- Figure 116: South America Power Equipment Market Volume (K Unit), by Application 2024 & 2032
- Figure 117: South America Power Equipment Market Revenue Share (%), by Application 2024 & 2032
- Figure 118: South America Power Equipment Market Volume Share (%), by Application 2024 & 2032
- Figure 119: South America Power Equipment Market Revenue (Million), by Country 2024 & 2032
- Figure 120: South America Power Equipment Market Volume (K Unit), by Country 2024 & 2032
- Figure 121: South America Power Equipment Market Revenue Share (%), by Country 2024 & 2032
- Figure 122: South America Power Equipment Market Volume Share (%), by Country 2024 & 2032
List of Tables
- Table 1: Global Power Equipment Market Revenue Million Forecast, by Region 2019 & 2032
- Table 2: Global Power Equipment Market Volume K Unit Forecast, by Region 2019 & 2032
- Table 3: Global Power Equipment Market Revenue Million Forecast, by Equipment Type 2019 & 2032
- Table 4: Global Power Equipment Market Volume K Unit Forecast, by Equipment Type 2019 & 2032
- Table 5: Global Power Equipment Market Revenue Million Forecast, by Power Generation Source 2019 & 2032
- Table 6: Global Power Equipment Market Volume K Unit Forecast, by Power Generation Source 2019 & 2032
- Table 7: Global Power Equipment Market Revenue Million Forecast, by End-User 2019 & 2032
- Table 8: Global Power Equipment Market Volume K Unit Forecast, by End-User 2019 & 2032
- Table 9: Global Power Equipment Market Revenue Million Forecast, by Application 2019 & 2032
- Table 10: Global Power Equipment Market Volume K Unit Forecast, by Application 2019 & 2032
- Table 11: Global Power Equipment Market Revenue Million Forecast, by Region 2019 & 2032
- Table 12: Global Power Equipment Market Volume K Unit Forecast, by Region 2019 & 2032
- Table 13: Global Power Equipment Market Revenue Million Forecast, by Country 2019 & 2032
- Table 14: Global Power Equipment Market Volume K Unit Forecast, by Country 2019 & 2032
- Table 15: United States Power Equipment Market Revenue (Million) Forecast, by Application 2019 & 2032
- Table 16: United States Power Equipment Market Volume (K Unit) Forecast, by Application 2019 & 2032
- Table 17: Canada Power Equipment Market Revenue (Million) Forecast, by Application 2019 & 2032
- Table 18: Canada Power Equipment Market Volume (K Unit) Forecast, by Application 2019 & 2032
- Table 19: Mexico Power Equipment Market Revenue (Million) Forecast, by Application 2019 & 2032
- Table 20: Mexico Power Equipment Market Volume (K Unit) Forecast, by Application 2019 & 2032
- Table 21: Global Power Equipment Market Revenue Million Forecast, by Country 2019 & 2032
- Table 22: Global Power Equipment Market Volume K Unit Forecast, by Country 2019 & 2032
- Table 23: Germany Power Equipment Market Revenue (Million) Forecast, by Application 2019 & 2032
- Table 24: Germany Power Equipment Market Volume (K Unit) Forecast, by Application 2019 & 2032
- Table 25: United Kingdom Power Equipment Market Revenue (Million) Forecast, by Application 2019 & 2032
- Table 26: United Kingdom Power Equipment Market Volume (K Unit) Forecast, by Application 2019 & 2032
- Table 27: France Power Equipment Market Revenue (Million) Forecast, by Application 2019 & 2032
- Table 28: France Power Equipment Market Volume (K Unit) Forecast, by Application 2019 & 2032
- Table 29: Spain Power Equipment Market Revenue (Million) Forecast, by Application 2019 & 2032
- Table 30: Spain Power Equipment Market Volume (K Unit) Forecast, by Application 2019 & 2032
- Table 31: Italy Power Equipment Market Revenue (Million) Forecast, by Application 2019 & 2032
- Table 32: Italy Power Equipment Market Volume (K Unit) Forecast, by Application 2019 & 2032
- Table 33: Spain Power Equipment Market Revenue (Million) Forecast, by Application 2019 & 2032
- Table 34: Spain Power Equipment Market Volume (K Unit) Forecast, by Application 2019 & 2032
- Table 35: Belgium Power Equipment Market Revenue (Million) Forecast, by Application 2019 & 2032
- Table 36: Belgium Power Equipment Market Volume (K Unit) Forecast, by Application 2019 & 2032
- Table 37: Netherland Power Equipment Market Revenue (Million) Forecast, by Application 2019 & 2032
- Table 38: Netherland Power Equipment Market Volume (K Unit) Forecast, by Application 2019 & 2032
- Table 39: Nordics Power Equipment Market Revenue (Million) Forecast, by Application 2019 & 2032
- Table 40: Nordics Power Equipment Market Volume (K Unit) Forecast, by Application 2019 & 2032
- Table 41: Rest of Europe Power Equipment Market Revenue (Million) Forecast, by Application 2019 & 2032
- Table 42: Rest of Europe Power Equipment Market Volume (K Unit) Forecast, by Application 2019 & 2032
- Table 43: Global Power Equipment Market Revenue Million Forecast, by Country 2019 & 2032
- Table 44: Global Power Equipment Market Volume K Unit Forecast, by Country 2019 & 2032
- Table 45: China Power Equipment Market Revenue (Million) Forecast, by Application 2019 & 2032
- Table 46: China Power Equipment Market Volume (K Unit) Forecast, by Application 2019 & 2032
- Table 47: Japan Power Equipment Market Revenue (Million) Forecast, by Application 2019 & 2032
- Table 48: Japan Power Equipment Market Volume (K Unit) Forecast, by Application 2019 & 2032
- Table 49: India Power Equipment Market Revenue (Million) Forecast, by Application 2019 & 2032
- Table 50: India Power Equipment Market Volume (K Unit) Forecast, by Application 2019 & 2032
- Table 51: South Korea Power Equipment Market Revenue (Million) Forecast, by Application 2019 & 2032
- Table 52: South Korea Power Equipment Market Volume (K Unit) Forecast, by Application 2019 & 2032
- Table 53: Southeast Asia Power Equipment Market Revenue (Million) Forecast, by Application 2019 & 2032
- Table 54: Southeast Asia Power Equipment Market Volume (K Unit) Forecast, by Application 2019 & 2032
- Table 55: Australia Power Equipment Market Revenue (Million) Forecast, by Application 2019 & 2032
- Table 56: Australia Power Equipment Market Volume (K Unit) Forecast, by Application 2019 & 2032
- Table 57: Indonesia Power Equipment Market Revenue (Million) Forecast, by Application 2019 & 2032
- Table 58: Indonesia Power Equipment Market Volume (K Unit) Forecast, by Application 2019 & 2032
- Table 59: Phillipes Power Equipment Market Revenue (Million) Forecast, by Application 2019 & 2032
- Table 60: Phillipes Power Equipment Market Volume (K Unit) Forecast, by Application 2019 & 2032
- Table 61: Singapore Power Equipment Market Revenue (Million) Forecast, by Application 2019 & 2032
- Table 62: Singapore Power Equipment Market Volume (K Unit) Forecast, by Application 2019 & 2032
- Table 63: Thailandc Power Equipment Market Revenue (Million) Forecast, by Application 2019 & 2032
- Table 64: Thailandc Power Equipment Market Volume (K Unit) Forecast, by Application 2019 & 2032
- Table 65: Rest of Asia Pacific Power Equipment Market Revenue (Million) Forecast, by Application 2019 & 2032
- Table 66: Rest of Asia Pacific Power Equipment Market Volume (K Unit) Forecast, by Application 2019 & 2032
- Table 67: Global Power Equipment Market Revenue Million Forecast, by Country 2019 & 2032
- Table 68: Global Power Equipment Market Volume K Unit Forecast, by Country 2019 & 2032
- Table 69: Brazil Power Equipment Market Revenue (Million) Forecast, by Application 2019 & 2032
- Table 70: Brazil Power Equipment Market Volume (K Unit) Forecast, by Application 2019 & 2032
- Table 71: Argentina Power Equipment Market Revenue (Million) Forecast, by Application 2019 & 2032
- Table 72: Argentina Power Equipment Market Volume (K Unit) Forecast, by Application 2019 & 2032
- Table 73: Peru Power Equipment Market Revenue (Million) Forecast, by Application 2019 & 2032
- Table 74: Peru Power Equipment Market Volume (K Unit) Forecast, by Application 2019 & 2032
- Table 75: Chile Power Equipment Market Revenue (Million) Forecast, by Application 2019 & 2032
- Table 76: Chile Power Equipment Market Volume (K Unit) Forecast, by Application 2019 & 2032
- Table 77: Colombia Power Equipment Market Revenue (Million) Forecast, by Application 2019 & 2032
- Table 78: Colombia Power Equipment Market Volume (K Unit) Forecast, by Application 2019 & 2032
- Table 79: Ecuador Power Equipment Market Revenue (Million) Forecast, by Application 2019 & 2032
- Table 80: Ecuador Power Equipment Market Volume (K Unit) Forecast, by Application 2019 & 2032
- Table 81: Venezuela Power Equipment Market Revenue (Million) Forecast, by Application 2019 & 2032
- Table 82: Venezuela Power Equipment Market Volume (K Unit) Forecast, by Application 2019 & 2032
- Table 83: Rest of South America Power Equipment Market Revenue (Million) Forecast, by Application 2019 & 2032
- Table 84: Rest of South America Power Equipment Market Volume (K Unit) Forecast, by Application 2019 & 2032
- Table 85: Global Power Equipment Market Revenue Million Forecast, by Country 2019 & 2032
- Table 86: Global Power Equipment Market Volume K Unit Forecast, by Country 2019 & 2032
- Table 87: United Arab Emirates Power Equipment Market Revenue (Million) Forecast, by Application 2019 & 2032
- Table 88: United Arab Emirates Power Equipment Market Volume (K Unit) Forecast, by Application 2019 & 2032
- Table 89: Saudi Arabia Power Equipment Market Revenue (Million) Forecast, by Application 2019 & 2032
- Table 90: Saudi Arabia Power Equipment Market Volume (K Unit) Forecast, by Application 2019 & 2032
- Table 91: South Africa Power Equipment Market Revenue (Million) Forecast, by Application 2019 & 2032
- Table 92: South Africa Power Equipment Market Volume (K Unit) Forecast, by Application 2019 & 2032
- Table 93: Rest of Middle East and Africa Power Equipment Market Revenue (Million) Forecast, by Application 2019 & 2032
- Table 94: Rest of Middle East and Africa Power Equipment Market Volume (K Unit) Forecast, by Application 2019 & 2032
- Table 95: Global Power Equipment Market Revenue Million Forecast, by Equipment Type 2019 & 2032
- Table 96: Global Power Equipment Market Volume K Unit Forecast, by Equipment Type 2019 & 2032
- Table 97: Global Power Equipment Market Revenue Million Forecast, by Power Generation Source 2019 & 2032
- Table 98: Global Power Equipment Market Volume K Unit Forecast, by Power Generation Source 2019 & 2032
- Table 99: Global Power Equipment Market Revenue Million Forecast, by End-User 2019 & 2032
- Table 100: Global Power Equipment Market Volume K Unit Forecast, by End-User 2019 & 2032
- Table 101: Global Power Equipment Market Revenue Million Forecast, by Application 2019 & 2032
- Table 102: Global Power Equipment Market Volume K Unit Forecast, by Application 2019 & 2032
- Table 103: Global Power Equipment Market Revenue Million Forecast, by Country 2019 & 2032
- Table 104: Global Power Equipment Market Volume K Unit Forecast, by Country 2019 & 2032
- Table 105: United States Power Equipment Market Revenue (Million) Forecast, by Application 2019 & 2032
- Table 106: United States Power Equipment Market Volume (K Unit) Forecast, by Application 2019 & 2032
- Table 107: Canada Power Equipment Market Revenue (Million) Forecast, by Application 2019 & 2032
- Table 108: Canada Power Equipment Market Volume (K Unit) Forecast, by Application 2019 & 2032
- Table 109: Rest of North America Power Equipment Market Revenue (Million) Forecast, by Application 2019 & 2032
- Table 110: Rest of North America Power Equipment Market Volume (K Unit) Forecast, by Application 2019 & 2032
- Table 111: Global Power Equipment Market Revenue Million Forecast, by Equipment Type 2019 & 2032
- Table 112: Global Power Equipment Market Volume K Unit Forecast, by Equipment Type 2019 & 2032
- Table 113: Global Power Equipment Market Revenue Million Forecast, by Power Generation Source 2019 & 2032
- Table 114: Global Power Equipment Market Volume K Unit Forecast, by Power Generation Source 2019 & 2032
- Table 115: Global Power Equipment Market Revenue Million Forecast, by End-User 2019 & 2032
- Table 116: Global Power Equipment Market Volume K Unit Forecast, by End-User 2019 & 2032
- Table 117: Global Power Equipment Market Revenue Million Forecast, by Application 2019 & 2032
- Table 118: Global Power Equipment Market Volume K Unit Forecast, by Application 2019 & 2032
- Table 119: Global Power Equipment Market Revenue Million Forecast, by Country 2019 & 2032
- Table 120: Global Power Equipment Market Volume K Unit Forecast, by Country 2019 & 2032
- Table 121: Germany Power Equipment Market Revenue (Million) Forecast, by Application 2019 & 2032
- Table 122: Germany Power Equipment Market Volume (K Unit) Forecast, by Application 2019 & 2032
- Table 123: France Power Equipment Market Revenue (Million) Forecast, by Application 2019 & 2032
- Table 124: France Power Equipment Market Volume (K Unit) Forecast, by Application 2019 & 2032
- Table 125: United Kingdom Power Equipment Market Revenue (Million) Forecast, by Application 2019 & 2032
- Table 126: United Kingdom Power Equipment Market Volume (K Unit) Forecast, by Application 2019 & 2032
- Table 127: Russia Power Equipment Market Revenue (Million) Forecast, by Application 2019 & 2032
- Table 128: Russia Power Equipment Market Volume (K Unit) Forecast, by Application 2019 & 2032
- Table 129: Rest of Europe Power Equipment Market Revenue (Million) Forecast, by Application 2019 & 2032
- Table 130: Rest of Europe Power Equipment Market Volume (K Unit) Forecast, by Application 2019 & 2032
- Table 131: Global Power Equipment Market Revenue Million Forecast, by Equipment Type 2019 & 2032
- Table 132: Global Power Equipment Market Volume K Unit Forecast, by Equipment Type 2019 & 2032
- Table 133: Global Power Equipment Market Revenue Million Forecast, by Power Generation Source 2019 & 2032
- Table 134: Global Power Equipment Market Volume K Unit Forecast, by Power Generation Source 2019 & 2032
- Table 135: Global Power Equipment Market Revenue Million Forecast, by End-User 2019 & 2032
- Table 136: Global Power Equipment Market Volume K Unit Forecast, by End-User 2019 & 2032
- Table 137: Global Power Equipment Market Revenue Million Forecast, by Application 2019 & 2032
- Table 138: Global Power Equipment Market Volume K Unit Forecast, by Application 2019 & 2032
- Table 139: Global Power Equipment Market Revenue Million Forecast, by Country 2019 & 2032
- Table 140: Global Power Equipment Market Volume K Unit Forecast, by Country 2019 & 2032
- Table 141: China Power Equipment Market Revenue (Million) Forecast, by Application 2019 & 2032
- Table 142: China Power Equipment Market Volume (K Unit) Forecast, by Application 2019 & 2032
- Table 143: India Power Equipment Market Revenue (Million) Forecast, by Application 2019 & 2032
- Table 144: India Power Equipment Market Volume (K Unit) Forecast, by Application 2019 & 2032
- Table 145: Australia Power Equipment Market Revenue (Million) Forecast, by Application 2019 & 2032
- Table 146: Australia Power Equipment Market Volume (K Unit) Forecast, by Application 2019 & 2032
- Table 147: Japan Power Equipment Market Revenue (Million) Forecast, by Application 2019 & 2032
- Table 148: Japan Power Equipment Market Volume (K Unit) Forecast, by Application 2019 & 2032
- Table 149: Rest of Asia Pacific Power Equipment Market Revenue (Million) Forecast, by Application 2019 & 2032
- Table 150: Rest of Asia Pacific Power Equipment Market Volume (K Unit) Forecast, by Application 2019 & 2032
- Table 151: Global Power Equipment Market Revenue Million Forecast, by Equipment Type 2019 & 2032
- Table 152: Global Power Equipment Market Volume K Unit Forecast, by Equipment Type 2019 & 2032
- Table 153: Global Power Equipment Market Revenue Million Forecast, by Power Generation Source 2019 & 2032
- Table 154: Global Power Equipment Market Volume K Unit Forecast, by Power Generation Source 2019 & 2032
- Table 155: Global Power Equipment Market Revenue Million Forecast, by End-User 2019 & 2032
- Table 156: Global Power Equipment Market Volume K Unit Forecast, by End-User 2019 & 2032
- Table 157: Global Power Equipment Market Revenue Million Forecast, by Application 2019 & 2032
- Table 158: Global Power Equipment Market Volume K Unit Forecast, by Application 2019 & 2032
- Table 159: Global Power Equipment Market Revenue Million Forecast, by Country 2019 & 2032
- Table 160: Global Power Equipment Market Volume K Unit Forecast, by Country 2019 & 2032
- Table 161: Saudi Arabia Power Equipment Market Revenue (Million) Forecast, by Application 2019 & 2032
- Table 162: Saudi Arabia Power Equipment Market Volume (K Unit) Forecast, by Application 2019 & 2032
- Table 163: United Arab Emirates Power Equipment Market Revenue (Million) Forecast, by Application 2019 & 2032
- Table 164: United Arab Emirates Power Equipment Market Volume (K Unit) Forecast, by Application 2019 & 2032
- Table 165: Nigeria Power Equipment Market Revenue (Million) Forecast, by Application 2019 & 2032
- Table 166: Nigeria Power Equipment Market Volume (K Unit) Forecast, by Application 2019 & 2032
- Table 167: South Africa Power Equipment Market Revenue (Million) Forecast, by Application 2019 & 2032
- Table 168: South Africa Power Equipment Market Volume (K Unit) Forecast, by Application 2019 & 2032
- Table 169: Rest of Middle East and Africa Power Equipment Market Revenue (Million) Forecast, by Application 2019 & 2032
- Table 170: Rest of Middle East and Africa Power Equipment Market Volume (K Unit) Forecast, by Application 2019 & 2032
- Table 171: Global Power Equipment Market Revenue Million Forecast, by Equipment Type 2019 & 2032
- Table 172: Global Power Equipment Market Volume K Unit Forecast, by Equipment Type 2019 & 2032
- Table 173: Global Power Equipment Market Revenue Million Forecast, by Power Generation Source 2019 & 2032
- Table 174: Global Power Equipment Market Volume K Unit Forecast, by Power Generation Source 2019 & 2032
- Table 175: Global Power Equipment Market Revenue Million Forecast, by End-User 2019 & 2032
- Table 176: Global Power Equipment Market Volume K Unit Forecast, by End-User 2019 & 2032
- Table 177: Global Power Equipment Market Revenue Million Forecast, by Application 2019 & 2032
- Table 178: Global Power Equipment Market Volume K Unit Forecast, by Application 2019 & 2032
- Table 179: Global Power Equipment Market Revenue Million Forecast, by Country 2019 & 2032
- Table 180: Global Power Equipment Market Volume K Unit Forecast, by Country 2019 & 2032
- Table 181: Brazil Power Equipment Market Revenue (Million) Forecast, by Application 2019 & 2032
- Table 182: Brazil Power Equipment Market Volume (K Unit) Forecast, by Application 2019 & 2032
- Table 183: Argentina Power Equipment Market Revenue (Million) Forecast, by Application 2019 & 2032
- Table 184: Argentina Power Equipment Market Volume (K Unit) Forecast, by Application 2019 & 2032
- Table 185: Chile Power Equipment Market Revenue (Million) Forecast, by Application 2019 & 2032
- Table 186: Chile Power Equipment Market Volume (K Unit) Forecast, by Application 2019 & 2032
- Table 187: Rest of South America Power Equipment Market Revenue (Million) Forecast, by Application 2019 & 2032
- Table 188: Rest of South America Power Equipment Market Volume (K Unit) Forecast, by Application 2019 & 2032
Frequently Asked Questions
1. What is the projected Compound Annual Growth Rate (CAGR) of the Power Equipment Market?
The projected CAGR is approximately 4.87%.
2. Which companies are prominent players in the Power Equipment Market?
Key companies in the market include Honeywell International Inc, Crompton Greaves Ltd, Eaton Corporation plc, Larsen & Toubro Limited, Toshiba Corporation, Fuji Electric Co Ltd, Bharat Heavy Electricals Limited, Mitsubishi Electric Corporation, Siemens AG, Schneider Electric SE, ABB Ltd, Rockwell Automation Inc, General Electric Company.
3. What are the main segments of the Power Equipment Market?
The market segments include Equipment Type, Power Generation Source, End-User, Application.
4. Can you provide details about the market size?
The market size is estimated to be USD 31.62 Million as of 2022.
5. What are some drivers contributing to market growth?
4.; Increasing Population Growth and Infrastructure Development.
6. What are the notable trends driving market growth?
Power Generation Expected to Dominate the Market.
7. Are there any restraints impacting market growth?
4.; High Operational and Maintenance Costs.
8. Can you provide examples of recent developments in the market?
May 2023: CAT launched its new power equipment product, the new CAT 60 Volt range. These power tools have advanced CAT 60V lithium-ion batteries with intelligent management systems. This system oversees various aspects, including charging and discharging, voltage control, temperature reporting, and monitoring the current state of health.
9. What pricing options are available for accessing the report?
Pricing options include single-user, multi-user, and enterprise licenses priced at USD 4750, USD 5250, and USD 8750 respectively.
10. Is the market size provided in terms of value or volume?
The market size is provided in terms of value, measured in Million and volume, measured in K Unit.
11. Are there any specific market keywords associated with the report?
Yes, the market keyword associated with the report is "Power Equipment Market," which aids in identifying and referencing the specific market segment covered.
12. How do I determine which pricing option suits my needs best?
The pricing options vary based on user requirements and access needs. Individual users may opt for single-user licenses, while businesses requiring broader access may choose multi-user or enterprise licenses for cost-effective access to the report.
13. Are there any additional resources or data provided in the Power Equipment Market report?
While the report offers comprehensive insights, it's advisable to review the specific contents or supplementary materials provided to ascertain if additional resources or data are available.
14. How can I stay updated on further developments or reports in the Power Equipment Market?
To stay informed about further developments, trends, and reports in the Power Equipment Market, consider subscribing to industry newsletters, following relevant companies and organizations, or regularly checking reputable industry news sources and publications.
Methodology
Step 1 - Identification of Relevant Samples Size from Population Database


Step 2 - Approaches for Defining Global Market Size (Value, Volume* & Price*)

Note*: In applicable scenarios
Step 3 - Data Sources
Primary Research
- Web Analytics
- Survey Reports
- Research Institute
- Latest Research Reports
- Opinion Leaders
Secondary Research
- Annual Reports
- White Paper
- Latest Press Release
- Industry Association
- Paid Database
- Investor Presentations

Step 4 - Data Triangulation
Involves using different sources of information in order to increase the validity of a study
These sources are likely to be stakeholders in a program - participants, other researchers, program staff, other community members, and so on.
Then we put all data in single framework & apply various statistical tools to find out the dynamic on the market.
During the analysis stage, feedback from the stakeholder groups would be compared to determine areas of agreement as well as areas of divergence
