

Key Insights
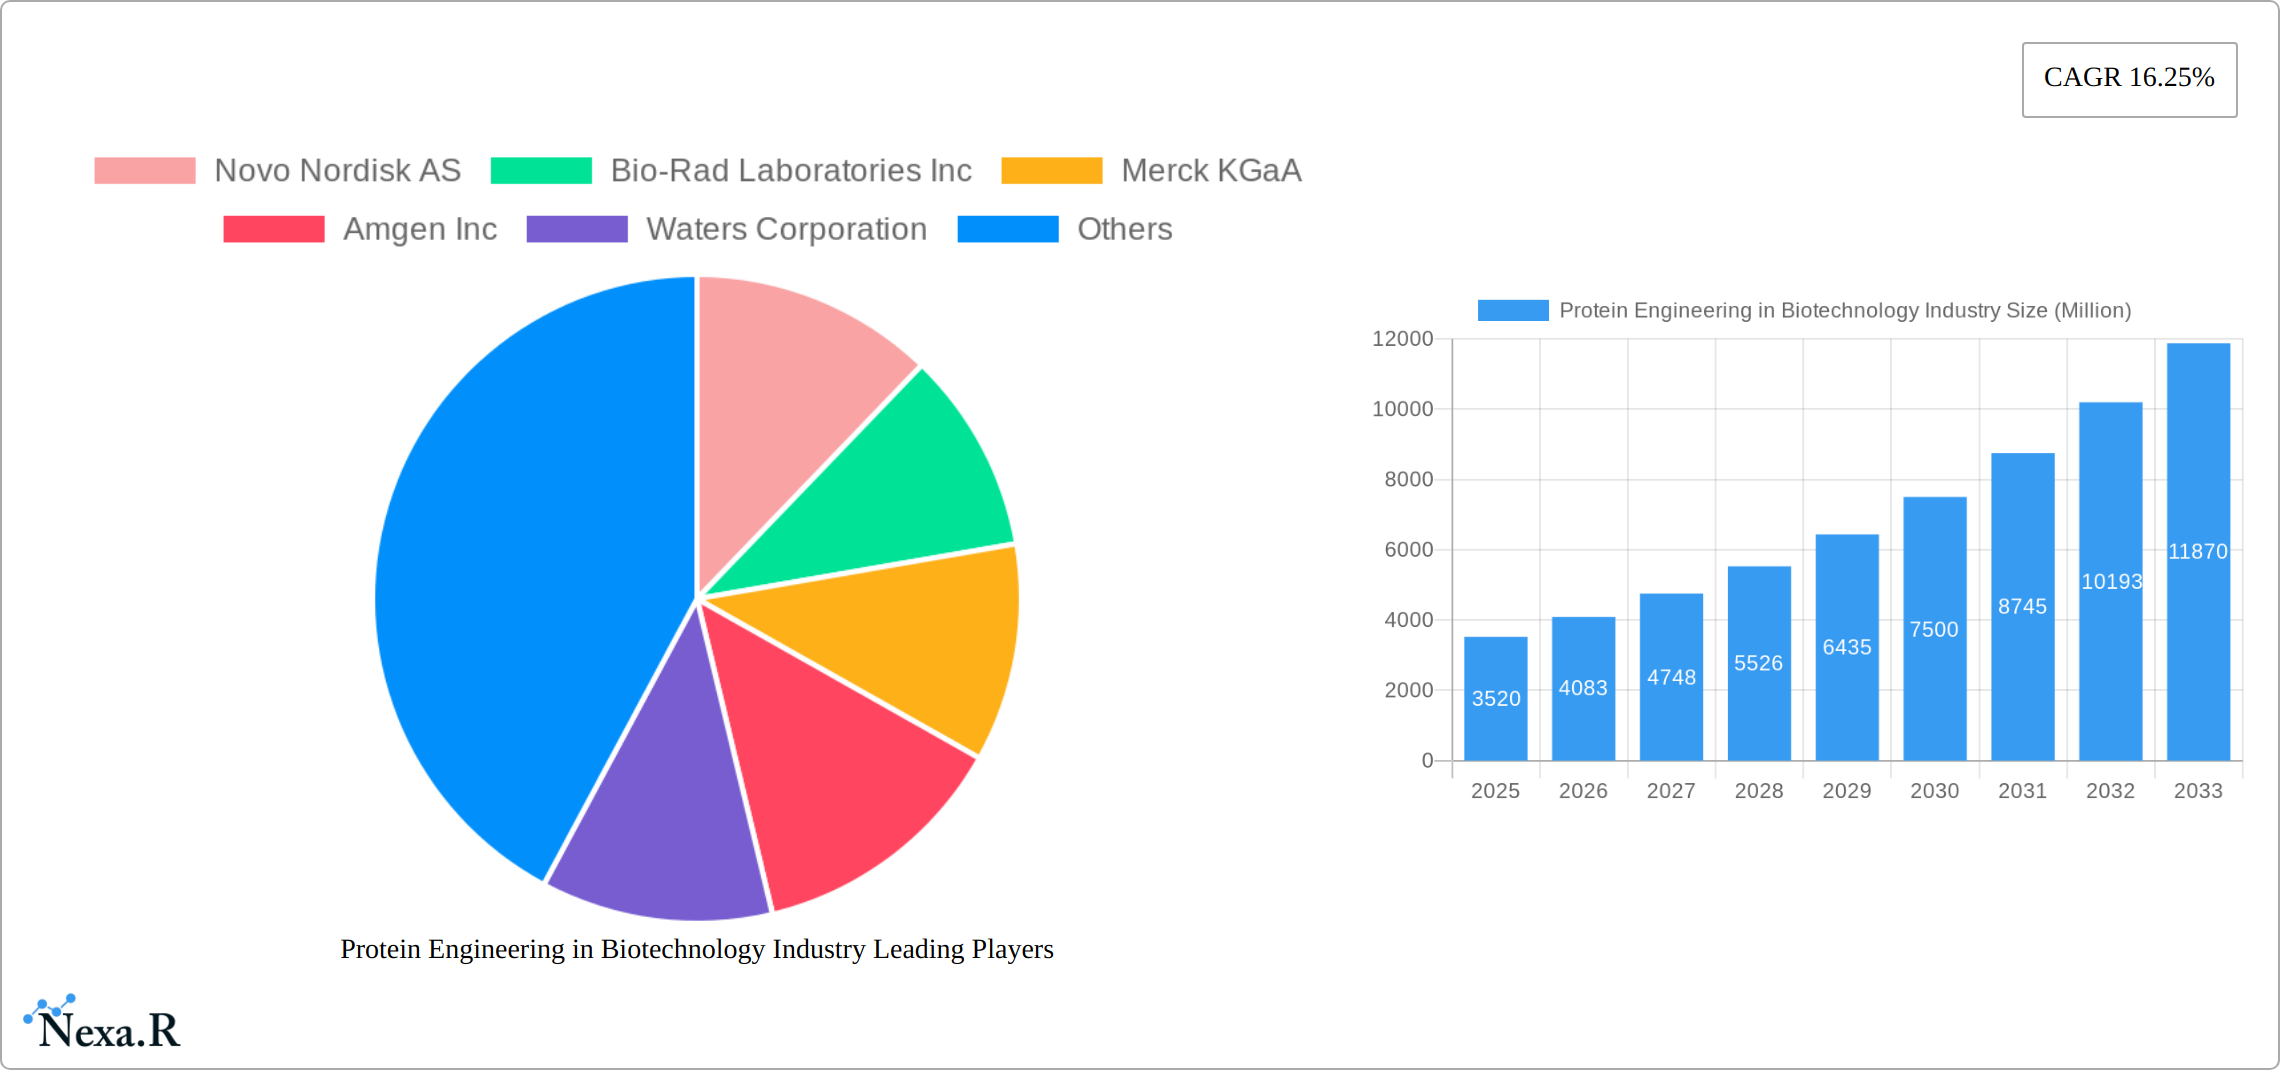
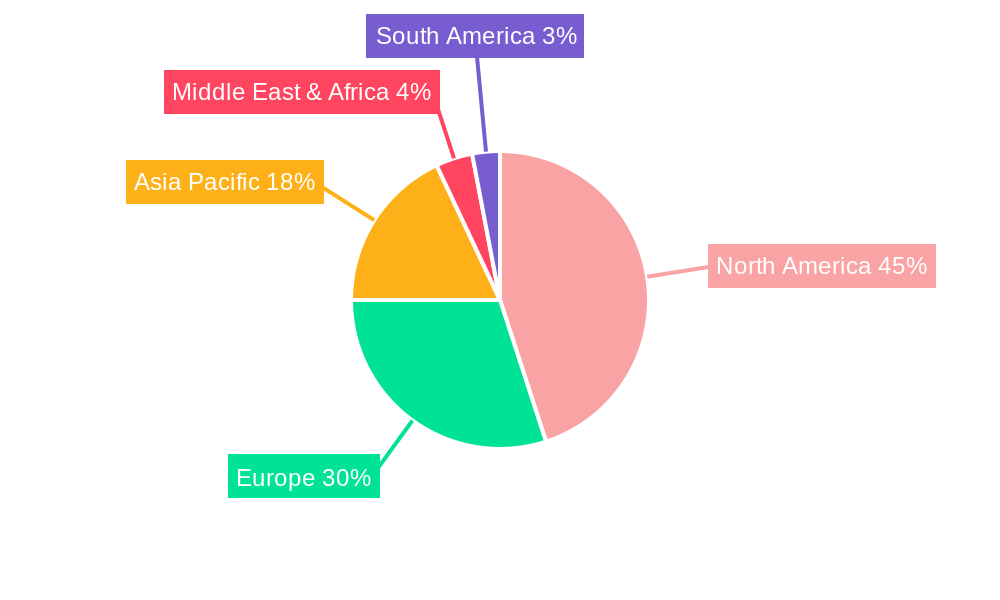
The global protein engineering in biotechnology market, valued at $3.52 billion in 2025, is poised for substantial growth, projected to expand at a compound annual growth rate (CAGR) of 16.25% from 2025 to 2033. This robust expansion is driven by several key factors. The increasing prevalence of chronic diseases like diabetes and cancer fuels demand for novel therapeutic proteins, such as insulin and monoclonal antibodies. Furthermore, advancements in protein engineering technologies, particularly rational and irrational protein design, enable the creation of more effective and targeted therapies with improved stability and efficacy. The burgeoning biopharmaceutical industry, coupled with rising investments in research and development, further stimulates market growth. Significant contributions come from pharmaceutical and biotechnology companies, academic institutions, and contract research organizations actively engaged in protein engineering research and development. North America and Europe currently dominate the market, owing to robust healthcare infrastructure and a higher concentration of biotech firms. However, the Asia-Pacific region is expected to witness significant growth in the coming years driven by increasing healthcare spending and a growing population.
The market segmentation highlights the diverse applications of protein engineering. Insulin, monoclonal antibodies, and coagulation factors represent major product types, indicating the strong therapeutic focus. Technological advancements in both rational and irrational protein design strategies are pivotal for innovation, influencing the development of novel protein-based therapies. While the market faces challenges such as high research and development costs and stringent regulatory approvals, the overall outlook remains positive, fueled by the continuous need for improved therapeutics and the ongoing development of cutting-edge protein engineering technologies. The market's future growth will depend on continued technological innovation, successful clinical trials, and regulatory approvals of novel protein-based therapies. The expanding use of protein engineering in other applications like industrial enzymes and biomaterials will also contribute to market expansion.
Protein Engineering in Biotechnology Industry: A Comprehensive Market Report (2019-2033)
This comprehensive report provides an in-depth analysis of the Protein Engineering in Biotechnology Industry market, encompassing market dynamics, growth trends, regional dominance, product landscape, key challenges, emerging opportunities, and key players. The study period covers 2019-2033, with 2025 as the base and estimated year, and a forecast period of 2025-2033. The market size in 2025 is estimated to be xx Million.
Protein Engineering in Biotechnology Industry Market Dynamics & Structure
The Protein Engineering in Biotechnology market, while exhibiting moderate concentration in 2025 with key players like Novo Nordisk AS, Amgen Inc, and Merck KGaA holding significant shares (estimated at xx%), is experiencing dynamic shifts. Technological advancements, particularly in rational and directed evolution protein design, fueled by advancements in AI and machine learning, are primary growth catalysts. These innovations are revolutionizing the development of therapeutic proteins such as monoclonal antibodies, insulin analogs, and novel enzyme therapies. However, stringent regulatory frameworks and the necessity for extensive and costly clinical trials remain significant hurdles. The market landscape is further shaped by increased mergers and acquisitions (M&A) activity, with approximately xx deals recorded between 2019 and 2024, indicating a trend towards industry consolidation. Intense competitive pressure from the rise of biosimilars and the emergence of innovative protein-based therapeutics adds another layer of complexity. The primary end-users remain pharmaceutical and biotechnology companies, followed by a growing segment of academic institutions and contract research organizations (CROs). A more granular breakdown of market share by end-user segment reveals that Pharmaceutical & Biotechnology Companies account for xx%, Academic Institutions for xx%, and CROs for xx% of the market in 2025.
- Market Concentration: Moderately concentrated, with top 5 players holding an estimated xx% market share in 2025. This concentration is expected to evolve with ongoing M&A activity.
- Technological Innovation: Rapid advancements in rational design (including computational protein design) and directed evolution, coupled with AI and high-throughput screening, are driving innovation and accelerating the development of novel protein-based therapeutics.
- Regulatory Framework: Stringent regulations, while essential for patient safety, significantly impact product development timelines and increase costs, posing a challenge for smaller companies entering the market.
- Competitive Substitutes: The increasing availability and affordability of biosimilars exert considerable competitive pressure, forcing original manufacturers to focus on innovation and differentiation.
- M&A Activity: The xx deals recorded between 2019 and 2024 reflect a strategic trend of consolidation within the industry, leading to the emergence of larger, more integrated players.
- End-User Demographics: Pharmaceutical & Biotechnology Companies (xx%), Academic Institutions (xx%), CROs (xx%). This highlights the collaborative nature of the industry.
Protein Engineering in Biotechnology Industry Growth Trends & Insights
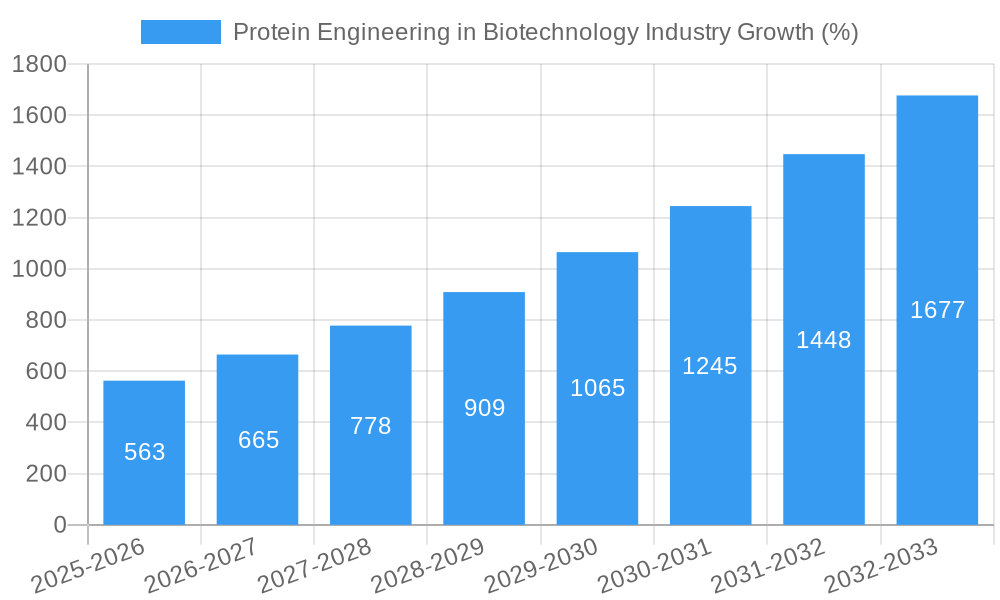
The Protein Engineering in Biotechnology market exhibits a robust CAGR of xx% during the forecast period (2025-2033), driven by increasing demand for biologics, advancements in protein engineering technologies, and rising investments in R&D. Market penetration of novel protein-based therapeutics is increasing, particularly in oncology and immunology. Technological disruptions, such as AI-powered protein design, are accelerating drug discovery and development. Consumer behavior shifts towards personalized medicine are also fueling market growth. The historical period (2019-2024) saw a CAGR of xx%, indicating a steady growth trajectory.
- Market size in 2019: xx Million
- Market size in 2024: xx Million
- Projected market size in 2033: xx Million
- CAGR (2019-2024): xx%
- CAGR (2025-2033): xx%
Dominant Regions, Countries, or Segments in Protein Engineering in Biotechnology Industry
North America currently dominates the Protein Engineering market, driven by robust R&D investments and the presence of major pharmaceutical companies. Europe holds a significant share, while the Asia-Pacific region is experiencing rapid growth. Among product types, monoclonal antibodies hold the largest market share (xx%), followed by insulin (xx%). Rational protein design technology dominates (xx%), while the pharmaceutical and biotechnology sector is the largest end-user segment (xx%).
- Leading Region: North America (xx% market share in 2025)
- Key Drivers (North America): High R&D spending, established pharmaceutical industry, supportive regulatory environment.
- High Growth Region: Asia-Pacific (xx% CAGR)
- Dominant Product Type: Monoclonal Antibodies
- Dominant Technology: Rational Protein Design
- Largest End-User Segment: Pharmaceutical and Biotechnology Companies
Protein Engineering in Biotechnology Industry Product Landscape
The market showcases a diverse range of products including insulin, monoclonal antibodies, coagulation factors, vaccines, and growth factors, each with unique applications and performance metrics. Recent innovations focus on enhanced efficacy, improved stability, and reduced immunogenicity. Technological advancements, like site-directed mutagenesis and phage display, are continuously improving protein engineering capabilities. Unique selling propositions often center on superior therapeutic effects, reduced side effects, and targeted drug delivery.
Key Drivers, Barriers & Challenges in Protein Engineering in Biotechnology Industry
Key Drivers: The market's expansion is propelled by several key factors: the increasing prevalence of chronic diseases demanding novel therapeutic solutions, a rising global demand for biologics, significant technological advancements such as AI-driven protein design and high-throughput screening technologies, substantial R&D investments from pharmaceutical companies, and supportive government policies promoting innovation in biotechnology.
Challenges & Restraints: Despite its immense potential, the industry faces considerable challenges. These include the inherently high R&D costs associated with protein engineering, stringent regulatory approval processes adding to time-to-market, complex and costly manufacturing processes requiring specialized facilities and expertise, the potential for immunogenicity in some protein therapeutics, and the competitive pressure from biosimilars. Furthermore, supply chain disruptions, fluctuations in raw material prices, and geopolitical uncertainties can negatively impact market growth. The estimated impact of regulatory hurdles on market growth is conservatively projected at xx%.
Emerging Opportunities in Protein Engineering in Biotechnology Industry
Emerging opportunities include the development of protein therapeutics for orphan diseases, personalized medicine approaches, biosimilar development, and applications in diagnostics. Expansion into untapped markets (e.g., emerging economies) and the increasing adoption of advanced technologies like CRISPR-Cas9 for gene editing present significant growth potential. Further development of AI-powered protein design tools offers substantial opportunities.
Growth Accelerators in the Protein Engineering in Biotechnology Industry Industry
Technological breakthroughs in protein engineering techniques, strategic partnerships and collaborations between pharmaceutical companies and biotechnology firms, and market expansion into developing countries are key growth accelerators. Increased investment in R&D, coupled with the development of innovative delivery systems, will further propel market growth.
Key Players Shaping the Protein Engineering in Biotechnology Industry Market
- Novo Nordisk AS
- Bio-Rad Laboratories Inc
- Merck KGaA
- Amgen Inc
- Waters Corporation
- Thermo Fisher Scientific Inc
- Eli Lilly and Company
- GenScript Biotech Corporation
- Agilent Technologies Inc
- PerkinElmer Inc
- Bruker Corporation
- GE HealthCare
Notable Milestones in Protein Engineering in Biotechnology Industry Sector
- April 2024: Northpond-funded Laboratory for Bioengineering Research and Innovation invests in the Wyss Institute's AmnioX project, significantly boosting the development of novel protein-based drugs for various therapeutic applications.
- March 2023: Arzeda's collaboration with Takeda showcases the increasing adoption of AI in protein design, highlighting its potential to enhance the efficiency and effectiveness of therapeutic protein optimization.
- [Add more recent milestones here - Include dates and brief descriptions]
In-Depth Protein Engineering in Biotechnology Industry Market Outlook
The Protein Engineering in Biotechnology market exhibits robust growth potential, driven by a confluence of factors: rapid technological advancements, continuously increasing demand for effective biologics, and strategic collaborations fostering innovation. Significant opportunities exist within personalized medicine, the development of next-generation biosimilars, and expansion into emerging markets with unmet medical needs. Companies strategically focusing on innovative technologies, forging strong partnerships, and efficiently navigating regulatory landscapes are optimally positioned to achieve substantial market share growth. The long-term outlook for this dynamic sector remains highly positive, with sustained growth anticipated throughout the forecast period. Further research into areas such as protein degradation, targeted protein delivery, and the development of novel protein scaffolds promises to further accelerate market expansion.
Protein Engineering in Biotechnology Industry Segmentation
-
1. Product Type
- 1.1. Insulin
- 1.2. Monoclonal Antibodies
- 1.3. Coagulation Factors
- 1.4. Vaccines
- 1.5. Growth Factors
- 1.6. Other Product Types
-
2. Technology
- 2.1. Irrational Protein Design
- 2.2. Rational Protein Design
-
3. End User
- 3.1. Pharmaceutical and Biotechnology Companies
- 3.2. Academic Institutions
- 3.3. Contract Research Organizations
Protein Engineering in Biotechnology Industry Segmentation By Geography
-
1. North America
- 1.1. United States
- 1.2. Canada
- 1.3. Mexico
-
2. Europe
- 2.1. Germany
- 2.2. United Kingdom
- 2.3. France
- 2.4. Italy
- 2.5. Spain
- 2.6. Rest of Europe
-
3. Asia Pacific
- 3.1. China
- 3.2. Japan
- 3.3. India
- 3.4. Australia
- 3.5. South Korea
- 3.6. Rest of Asia Pacific
-
4. Middle East and Africa
- 4.1. GCC
- 4.2. South Africa
- 4.3. Rest of Middle East and Africa
-
5. South America
- 5.1. Brazil
- 5.2. Argentina
- 5.3. Rest of South America
Protein Engineering in Biotechnology Industry REPORT HIGHLIGHTS
| Aspects | Details |
|---|---|
| Study Period | 2019-2033 |
| Base Year | 2024 |
| Estimated Year | 2025 |
| Forecast Period | 2025-2033 |
| Historical Period | 2019-2024 |
| Growth Rate | CAGR of 16.25% from 2019-2033 |
| Segmentation |
|
Table of Contents
- 1. Introduction
- 1.1. Research Scope
- 1.2. Market Segmentation
- 1.3. Research Methodology
- 1.4. Definitions and Assumptions
- 2. Executive Summary
- 2.1. Introduction
- 3. Market Dynamics
- 3.1. Introduction
- 3.2. Market Drivers
- 3.2.1. Increasing Prevalence of Chronic Diseases and Rise in Demand for Targeted Therapies; Rising Government Funding for Protein Engineering Studies
- 3.3. Market Restrains
- 3.3.1. High Costs of Protein Engineering Techniques
- 3.4. Market Trends
- 3.4.1. The Monoclonal Antibodies Segment is Anticipated to Witness Notable Growth Over the Forecast Period
- 4. Market Factor Analysis
- 4.1. Porters Five Forces
- 4.2. Supply/Value Chain
- 4.3. PESTEL analysis
- 4.4. Market Entropy
- 4.5. Patent/Trademark Analysis
- 5. Global Protein Engineering in Biotechnology Industry Analysis, Insights and Forecast, 2019-2031
- 5.1. Market Analysis, Insights and Forecast - by Product Type
- 5.1.1. Insulin
- 5.1.2. Monoclonal Antibodies
- 5.1.3. Coagulation Factors
- 5.1.4. Vaccines
- 5.1.5. Growth Factors
- 5.1.6. Other Product Types
- 5.2. Market Analysis, Insights and Forecast - by Technology
- 5.2.1. Irrational Protein Design
- 5.2.2. Rational Protein Design
- 5.3. Market Analysis, Insights and Forecast - by End User
- 5.3.1. Pharmaceutical and Biotechnology Companies
- 5.3.2. Academic Institutions
- 5.3.3. Contract Research Organizations
- 5.4. Market Analysis, Insights and Forecast - by Region
- 5.4.1. North America
- 5.4.2. Europe
- 5.4.3. Asia Pacific
- 5.4.4. Middle East and Africa
- 5.4.5. South America
- 5.1. Market Analysis, Insights and Forecast - by Product Type
- 6. North America Protein Engineering in Biotechnology Industry Analysis, Insights and Forecast, 2019-2031
- 6.1. Market Analysis, Insights and Forecast - by Product Type
- 6.1.1. Insulin
- 6.1.2. Monoclonal Antibodies
- 6.1.3. Coagulation Factors
- 6.1.4. Vaccines
- 6.1.5. Growth Factors
- 6.1.6. Other Product Types
- 6.2. Market Analysis, Insights and Forecast - by Technology
- 6.2.1. Irrational Protein Design
- 6.2.2. Rational Protein Design
- 6.3. Market Analysis, Insights and Forecast - by End User
- 6.3.1. Pharmaceutical and Biotechnology Companies
- 6.3.2. Academic Institutions
- 6.3.3. Contract Research Organizations
- 6.1. Market Analysis, Insights and Forecast - by Product Type
- 7. Europe Protein Engineering in Biotechnology Industry Analysis, Insights and Forecast, 2019-2031
- 7.1. Market Analysis, Insights and Forecast - by Product Type
- 7.1.1. Insulin
- 7.1.2. Monoclonal Antibodies
- 7.1.3. Coagulation Factors
- 7.1.4. Vaccines
- 7.1.5. Growth Factors
- 7.1.6. Other Product Types
- 7.2. Market Analysis, Insights and Forecast - by Technology
- 7.2.1. Irrational Protein Design
- 7.2.2. Rational Protein Design
- 7.3. Market Analysis, Insights and Forecast - by End User
- 7.3.1. Pharmaceutical and Biotechnology Companies
- 7.3.2. Academic Institutions
- 7.3.3. Contract Research Organizations
- 7.1. Market Analysis, Insights and Forecast - by Product Type
- 8. Asia Pacific Protein Engineering in Biotechnology Industry Analysis, Insights and Forecast, 2019-2031
- 8.1. Market Analysis, Insights and Forecast - by Product Type
- 8.1.1. Insulin
- 8.1.2. Monoclonal Antibodies
- 8.1.3. Coagulation Factors
- 8.1.4. Vaccines
- 8.1.5. Growth Factors
- 8.1.6. Other Product Types
- 8.2. Market Analysis, Insights and Forecast - by Technology
- 8.2.1. Irrational Protein Design
- 8.2.2. Rational Protein Design
- 8.3. Market Analysis, Insights and Forecast - by End User
- 8.3.1. Pharmaceutical and Biotechnology Companies
- 8.3.2. Academic Institutions
- 8.3.3. Contract Research Organizations
- 8.1. Market Analysis, Insights and Forecast - by Product Type
- 9. Middle East and Africa Protein Engineering in Biotechnology Industry Analysis, Insights and Forecast, 2019-2031
- 9.1. Market Analysis, Insights and Forecast - by Product Type
- 9.1.1. Insulin
- 9.1.2. Monoclonal Antibodies
- 9.1.3. Coagulation Factors
- 9.1.4. Vaccines
- 9.1.5. Growth Factors
- 9.1.6. Other Product Types
- 9.2. Market Analysis, Insights and Forecast - by Technology
- 9.2.1. Irrational Protein Design
- 9.2.2. Rational Protein Design
- 9.3. Market Analysis, Insights and Forecast - by End User
- 9.3.1. Pharmaceutical and Biotechnology Companies
- 9.3.2. Academic Institutions
- 9.3.3. Contract Research Organizations
- 9.1. Market Analysis, Insights and Forecast - by Product Type
- 10. South America Protein Engineering in Biotechnology Industry Analysis, Insights and Forecast, 2019-2031
- 10.1. Market Analysis, Insights and Forecast - by Product Type
- 10.1.1. Insulin
- 10.1.2. Monoclonal Antibodies
- 10.1.3. Coagulation Factors
- 10.1.4. Vaccines
- 10.1.5. Growth Factors
- 10.1.6. Other Product Types
- 10.2. Market Analysis, Insights and Forecast - by Technology
- 10.2.1. Irrational Protein Design
- 10.2.2. Rational Protein Design
- 10.3. Market Analysis, Insights and Forecast - by End User
- 10.3.1. Pharmaceutical and Biotechnology Companies
- 10.3.2. Academic Institutions
- 10.3.3. Contract Research Organizations
- 10.1. Market Analysis, Insights and Forecast - by Product Type
- 11. North America Protein Engineering in Biotechnology Industry Analysis, Insights and Forecast, 2019-2031
- 11.1. Market Analysis, Insights and Forecast - By Country/Sub-region
- 11.1.1 United States
- 11.1.2 Canada
- 11.1.3 Mexico
- 12. Europe Protein Engineering in Biotechnology Industry Analysis, Insights and Forecast, 2019-2031
- 12.1. Market Analysis, Insights and Forecast - By Country/Sub-region
- 12.1.1 Germany
- 12.1.2 United Kingdom
- 12.1.3 France
- 12.1.4 Italy
- 12.1.5 Spain
- 12.1.6 Rest of Europe
- 13. Asia Pacific Protein Engineering in Biotechnology Industry Analysis, Insights and Forecast, 2019-2031
- 13.1. Market Analysis, Insights and Forecast - By Country/Sub-region
- 13.1.1 China
- 13.1.2 Japan
- 13.1.3 India
- 13.1.4 Australia
- 13.1.5 South Korea
- 13.1.6 Rest of Asia Pacific
- 14. Middle East and Africa Protein Engineering in Biotechnology Industry Analysis, Insights and Forecast, 2019-2031
- 14.1. Market Analysis, Insights and Forecast - By Country/Sub-region
- 14.1.1 GCC
- 14.1.2 South Africa
- 14.1.3 Rest of Middle East and Africa
- 15. South America Protein Engineering in Biotechnology Industry Analysis, Insights and Forecast, 2019-2031
- 15.1. Market Analysis, Insights and Forecast - By Country/Sub-region
- 15.1.1 Brazil
- 15.1.2 Argentina
- 15.1.3 Rest of South America
- 16. Competitive Analysis
- 16.1. Global Market Share Analysis 2024
- 16.2. Company Profiles
- 16.2.1 Novo Nordisk AS
- 16.2.1.1. Overview
- 16.2.1.2. Products
- 16.2.1.3. SWOT Analysis
- 16.2.1.4. Recent Developments
- 16.2.1.5. Financials (Based on Availability)
- 16.2.2 Bio-Rad Laboratories Inc
- 16.2.2.1. Overview
- 16.2.2.2. Products
- 16.2.2.3. SWOT Analysis
- 16.2.2.4. Recent Developments
- 16.2.2.5. Financials (Based on Availability)
- 16.2.3 Merck KGaA
- 16.2.3.1. Overview
- 16.2.3.2. Products
- 16.2.3.3. SWOT Analysis
- 16.2.3.4. Recent Developments
- 16.2.3.5. Financials (Based on Availability)
- 16.2.4 Amgen Inc
- 16.2.4.1. Overview
- 16.2.4.2. Products
- 16.2.4.3. SWOT Analysis
- 16.2.4.4. Recent Developments
- 16.2.4.5. Financials (Based on Availability)
- 16.2.5 Waters Corporation
- 16.2.5.1. Overview
- 16.2.5.2. Products
- 16.2.5.3. SWOT Analysis
- 16.2.5.4. Recent Developments
- 16.2.5.5. Financials (Based on Availability)
- 16.2.6 Thermo Fisher Scientific Inc
- 16.2.6.1. Overview
- 16.2.6.2. Products
- 16.2.6.3. SWOT Analysis
- 16.2.6.4. Recent Developments
- 16.2.6.5. Financials (Based on Availability)
- 16.2.7 Eli Lilly and Company
- 16.2.7.1. Overview
- 16.2.7.2. Products
- 16.2.7.3. SWOT Analysis
- 16.2.7.4. Recent Developments
- 16.2.7.5. Financials (Based on Availability)
- 16.2.8 GenScript Biotech Corporation
- 16.2.8.1. Overview
- 16.2.8.2. Products
- 16.2.8.3. SWOT Analysis
- 16.2.8.4. Recent Developments
- 16.2.8.5. Financials (Based on Availability)
- 16.2.9 Agilent Technologies Inc
- 16.2.9.1. Overview
- 16.2.9.2. Products
- 16.2.9.3. SWOT Analysis
- 16.2.9.4. Recent Developments
- 16.2.9.5. Financials (Based on Availability)
- 16.2.10 PerkinElmer Inc
- 16.2.10.1. Overview
- 16.2.10.2. Products
- 16.2.10.3. SWOT Analysis
- 16.2.10.4. Recent Developments
- 16.2.10.5. Financials (Based on Availability)
- 16.2.11 Bruker Corporation
- 16.2.11.1. Overview
- 16.2.11.2. Products
- 16.2.11.3. SWOT Analysis
- 16.2.11.4. Recent Developments
- 16.2.11.5. Financials (Based on Availability)
- 16.2.12 GE HealthCare
- 16.2.12.1. Overview
- 16.2.12.2. Products
- 16.2.12.3. SWOT Analysis
- 16.2.12.4. Recent Developments
- 16.2.12.5. Financials (Based on Availability)
- 16.2.1 Novo Nordisk AS
List of Figures
- Figure 1: Global Protein Engineering in Biotechnology Industry Revenue Breakdown (Million, %) by Region 2024 & 2032
- Figure 2: Global Protein Engineering in Biotechnology Industry Volume Breakdown (K Unit, %) by Region 2024 & 2032
- Figure 3: North America Protein Engineering in Biotechnology Industry Revenue (Million), by Country 2024 & 2032
- Figure 4: North America Protein Engineering in Biotechnology Industry Volume (K Unit), by Country 2024 & 2032
- Figure 5: North America Protein Engineering in Biotechnology Industry Revenue Share (%), by Country 2024 & 2032
- Figure 6: North America Protein Engineering in Biotechnology Industry Volume Share (%), by Country 2024 & 2032
- Figure 7: Europe Protein Engineering in Biotechnology Industry Revenue (Million), by Country 2024 & 2032
- Figure 8: Europe Protein Engineering in Biotechnology Industry Volume (K Unit), by Country 2024 & 2032
- Figure 9: Europe Protein Engineering in Biotechnology Industry Revenue Share (%), by Country 2024 & 2032
- Figure 10: Europe Protein Engineering in Biotechnology Industry Volume Share (%), by Country 2024 & 2032
- Figure 11: Asia Pacific Protein Engineering in Biotechnology Industry Revenue (Million), by Country 2024 & 2032
- Figure 12: Asia Pacific Protein Engineering in Biotechnology Industry Volume (K Unit), by Country 2024 & 2032
- Figure 13: Asia Pacific Protein Engineering in Biotechnology Industry Revenue Share (%), by Country 2024 & 2032
- Figure 14: Asia Pacific Protein Engineering in Biotechnology Industry Volume Share (%), by Country 2024 & 2032
- Figure 15: Middle East and Africa Protein Engineering in Biotechnology Industry Revenue (Million), by Country 2024 & 2032
- Figure 16: Middle East and Africa Protein Engineering in Biotechnology Industry Volume (K Unit), by Country 2024 & 2032
- Figure 17: Middle East and Africa Protein Engineering in Biotechnology Industry Revenue Share (%), by Country 2024 & 2032
- Figure 18: Middle East and Africa Protein Engineering in Biotechnology Industry Volume Share (%), by Country 2024 & 2032
- Figure 19: South America Protein Engineering in Biotechnology Industry Revenue (Million), by Country 2024 & 2032
- Figure 20: South America Protein Engineering in Biotechnology Industry Volume (K Unit), by Country 2024 & 2032
- Figure 21: South America Protein Engineering in Biotechnology Industry Revenue Share (%), by Country 2024 & 2032
- Figure 22: South America Protein Engineering in Biotechnology Industry Volume Share (%), by Country 2024 & 2032
- Figure 23: North America Protein Engineering in Biotechnology Industry Revenue (Million), by Product Type 2024 & 2032
- Figure 24: North America Protein Engineering in Biotechnology Industry Volume (K Unit), by Product Type 2024 & 2032
- Figure 25: North America Protein Engineering in Biotechnology Industry Revenue Share (%), by Product Type 2024 & 2032
- Figure 26: North America Protein Engineering in Biotechnology Industry Volume Share (%), by Product Type 2024 & 2032
- Figure 27: North America Protein Engineering in Biotechnology Industry Revenue (Million), by Technology 2024 & 2032
- Figure 28: North America Protein Engineering in Biotechnology Industry Volume (K Unit), by Technology 2024 & 2032
- Figure 29: North America Protein Engineering in Biotechnology Industry Revenue Share (%), by Technology 2024 & 2032
- Figure 30: North America Protein Engineering in Biotechnology Industry Volume Share (%), by Technology 2024 & 2032
- Figure 31: North America Protein Engineering in Biotechnology Industry Revenue (Million), by End User 2024 & 2032
- Figure 32: North America Protein Engineering in Biotechnology Industry Volume (K Unit), by End User 2024 & 2032
- Figure 33: North America Protein Engineering in Biotechnology Industry Revenue Share (%), by End User 2024 & 2032
- Figure 34: North America Protein Engineering in Biotechnology Industry Volume Share (%), by End User 2024 & 2032
- Figure 35: North America Protein Engineering in Biotechnology Industry Revenue (Million), by Country 2024 & 2032
- Figure 36: North America Protein Engineering in Biotechnology Industry Volume (K Unit), by Country 2024 & 2032
- Figure 37: North America Protein Engineering in Biotechnology Industry Revenue Share (%), by Country 2024 & 2032
- Figure 38: North America Protein Engineering in Biotechnology Industry Volume Share (%), by Country 2024 & 2032
- Figure 39: Europe Protein Engineering in Biotechnology Industry Revenue (Million), by Product Type 2024 & 2032
- Figure 40: Europe Protein Engineering in Biotechnology Industry Volume (K Unit), by Product Type 2024 & 2032
- Figure 41: Europe Protein Engineering in Biotechnology Industry Revenue Share (%), by Product Type 2024 & 2032
- Figure 42: Europe Protein Engineering in Biotechnology Industry Volume Share (%), by Product Type 2024 & 2032
- Figure 43: Europe Protein Engineering in Biotechnology Industry Revenue (Million), by Technology 2024 & 2032
- Figure 44: Europe Protein Engineering in Biotechnology Industry Volume (K Unit), by Technology 2024 & 2032
- Figure 45: Europe Protein Engineering in Biotechnology Industry Revenue Share (%), by Technology 2024 & 2032
- Figure 46: Europe Protein Engineering in Biotechnology Industry Volume Share (%), by Technology 2024 & 2032
- Figure 47: Europe Protein Engineering in Biotechnology Industry Revenue (Million), by End User 2024 & 2032
- Figure 48: Europe Protein Engineering in Biotechnology Industry Volume (K Unit), by End User 2024 & 2032
- Figure 49: Europe Protein Engineering in Biotechnology Industry Revenue Share (%), by End User 2024 & 2032
- Figure 50: Europe Protein Engineering in Biotechnology Industry Volume Share (%), by End User 2024 & 2032
- Figure 51: Europe Protein Engineering in Biotechnology Industry Revenue (Million), by Country 2024 & 2032
- Figure 52: Europe Protein Engineering in Biotechnology Industry Volume (K Unit), by Country 2024 & 2032
- Figure 53: Europe Protein Engineering in Biotechnology Industry Revenue Share (%), by Country 2024 & 2032
- Figure 54: Europe Protein Engineering in Biotechnology Industry Volume Share (%), by Country 2024 & 2032
- Figure 55: Asia Pacific Protein Engineering in Biotechnology Industry Revenue (Million), by Product Type 2024 & 2032
- Figure 56: Asia Pacific Protein Engineering in Biotechnology Industry Volume (K Unit), by Product Type 2024 & 2032
- Figure 57: Asia Pacific Protein Engineering in Biotechnology Industry Revenue Share (%), by Product Type 2024 & 2032
- Figure 58: Asia Pacific Protein Engineering in Biotechnology Industry Volume Share (%), by Product Type 2024 & 2032
- Figure 59: Asia Pacific Protein Engineering in Biotechnology Industry Revenue (Million), by Technology 2024 & 2032
- Figure 60: Asia Pacific Protein Engineering in Biotechnology Industry Volume (K Unit), by Technology 2024 & 2032
- Figure 61: Asia Pacific Protein Engineering in Biotechnology Industry Revenue Share (%), by Technology 2024 & 2032
- Figure 62: Asia Pacific Protein Engineering in Biotechnology Industry Volume Share (%), by Technology 2024 & 2032
- Figure 63: Asia Pacific Protein Engineering in Biotechnology Industry Revenue (Million), by End User 2024 & 2032
- Figure 64: Asia Pacific Protein Engineering in Biotechnology Industry Volume (K Unit), by End User 2024 & 2032
- Figure 65: Asia Pacific Protein Engineering in Biotechnology Industry Revenue Share (%), by End User 2024 & 2032
- Figure 66: Asia Pacific Protein Engineering in Biotechnology Industry Volume Share (%), by End User 2024 & 2032
- Figure 67: Asia Pacific Protein Engineering in Biotechnology Industry Revenue (Million), by Country 2024 & 2032
- Figure 68: Asia Pacific Protein Engineering in Biotechnology Industry Volume (K Unit), by Country 2024 & 2032
- Figure 69: Asia Pacific Protein Engineering in Biotechnology Industry Revenue Share (%), by Country 2024 & 2032
- Figure 70: Asia Pacific Protein Engineering in Biotechnology Industry Volume Share (%), by Country 2024 & 2032
- Figure 71: Middle East and Africa Protein Engineering in Biotechnology Industry Revenue (Million), by Product Type 2024 & 2032
- Figure 72: Middle East and Africa Protein Engineering in Biotechnology Industry Volume (K Unit), by Product Type 2024 & 2032
- Figure 73: Middle East and Africa Protein Engineering in Biotechnology Industry Revenue Share (%), by Product Type 2024 & 2032
- Figure 74: Middle East and Africa Protein Engineering in Biotechnology Industry Volume Share (%), by Product Type 2024 & 2032
- Figure 75: Middle East and Africa Protein Engineering in Biotechnology Industry Revenue (Million), by Technology 2024 & 2032
- Figure 76: Middle East and Africa Protein Engineering in Biotechnology Industry Volume (K Unit), by Technology 2024 & 2032
- Figure 77: Middle East and Africa Protein Engineering in Biotechnology Industry Revenue Share (%), by Technology 2024 & 2032
- Figure 78: Middle East and Africa Protein Engineering in Biotechnology Industry Volume Share (%), by Technology 2024 & 2032
- Figure 79: Middle East and Africa Protein Engineering in Biotechnology Industry Revenue (Million), by End User 2024 & 2032
- Figure 80: Middle East and Africa Protein Engineering in Biotechnology Industry Volume (K Unit), by End User 2024 & 2032
- Figure 81: Middle East and Africa Protein Engineering in Biotechnology Industry Revenue Share (%), by End User 2024 & 2032
- Figure 82: Middle East and Africa Protein Engineering in Biotechnology Industry Volume Share (%), by End User 2024 & 2032
- Figure 83: Middle East and Africa Protein Engineering in Biotechnology Industry Revenue (Million), by Country 2024 & 2032
- Figure 84: Middle East and Africa Protein Engineering in Biotechnology Industry Volume (K Unit), by Country 2024 & 2032
- Figure 85: Middle East and Africa Protein Engineering in Biotechnology Industry Revenue Share (%), by Country 2024 & 2032
- Figure 86: Middle East and Africa Protein Engineering in Biotechnology Industry Volume Share (%), by Country 2024 & 2032
- Figure 87: South America Protein Engineering in Biotechnology Industry Revenue (Million), by Product Type 2024 & 2032
- Figure 88: South America Protein Engineering in Biotechnology Industry Volume (K Unit), by Product Type 2024 & 2032
- Figure 89: South America Protein Engineering in Biotechnology Industry Revenue Share (%), by Product Type 2024 & 2032
- Figure 90: South America Protein Engineering in Biotechnology Industry Volume Share (%), by Product Type 2024 & 2032
- Figure 91: South America Protein Engineering in Biotechnology Industry Revenue (Million), by Technology 2024 & 2032
- Figure 92: South America Protein Engineering in Biotechnology Industry Volume (K Unit), by Technology 2024 & 2032
- Figure 93: South America Protein Engineering in Biotechnology Industry Revenue Share (%), by Technology 2024 & 2032
- Figure 94: South America Protein Engineering in Biotechnology Industry Volume Share (%), by Technology 2024 & 2032
- Figure 95: South America Protein Engineering in Biotechnology Industry Revenue (Million), by End User 2024 & 2032
- Figure 96: South America Protein Engineering in Biotechnology Industry Volume (K Unit), by End User 2024 & 2032
- Figure 97: South America Protein Engineering in Biotechnology Industry Revenue Share (%), by End User 2024 & 2032
- Figure 98: South America Protein Engineering in Biotechnology Industry Volume Share (%), by End User 2024 & 2032
- Figure 99: South America Protein Engineering in Biotechnology Industry Revenue (Million), by Country 2024 & 2032
- Figure 100: South America Protein Engineering in Biotechnology Industry Volume (K Unit), by Country 2024 & 2032
- Figure 101: South America Protein Engineering in Biotechnology Industry Revenue Share (%), by Country 2024 & 2032
- Figure 102: South America Protein Engineering in Biotechnology Industry Volume Share (%), by Country 2024 & 2032
List of Tables
- Table 1: Global Protein Engineering in Biotechnology Industry Revenue Million Forecast, by Region 2019 & 2032
- Table 2: Global Protein Engineering in Biotechnology Industry Volume K Unit Forecast, by Region 2019 & 2032
- Table 3: Global Protein Engineering in Biotechnology Industry Revenue Million Forecast, by Product Type 2019 & 2032
- Table 4: Global Protein Engineering in Biotechnology Industry Volume K Unit Forecast, by Product Type 2019 & 2032
- Table 5: Global Protein Engineering in Biotechnology Industry Revenue Million Forecast, by Technology 2019 & 2032
- Table 6: Global Protein Engineering in Biotechnology Industry Volume K Unit Forecast, by Technology 2019 & 2032
- Table 7: Global Protein Engineering in Biotechnology Industry Revenue Million Forecast, by End User 2019 & 2032
- Table 8: Global Protein Engineering in Biotechnology Industry Volume K Unit Forecast, by End User 2019 & 2032
- Table 9: Global Protein Engineering in Biotechnology Industry Revenue Million Forecast, by Region 2019 & 2032
- Table 10: Global Protein Engineering in Biotechnology Industry Volume K Unit Forecast, by Region 2019 & 2032
- Table 11: Global Protein Engineering in Biotechnology Industry Revenue Million Forecast, by Country 2019 & 2032
- Table 12: Global Protein Engineering in Biotechnology Industry Volume K Unit Forecast, by Country 2019 & 2032
- Table 13: United States Protein Engineering in Biotechnology Industry Revenue (Million) Forecast, by Application 2019 & 2032
- Table 14: United States Protein Engineering in Biotechnology Industry Volume (K Unit) Forecast, by Application 2019 & 2032
- Table 15: Canada Protein Engineering in Biotechnology Industry Revenue (Million) Forecast, by Application 2019 & 2032
- Table 16: Canada Protein Engineering in Biotechnology Industry Volume (K Unit) Forecast, by Application 2019 & 2032
- Table 17: Mexico Protein Engineering in Biotechnology Industry Revenue (Million) Forecast, by Application 2019 & 2032
- Table 18: Mexico Protein Engineering in Biotechnology Industry Volume (K Unit) Forecast, by Application 2019 & 2032
- Table 19: Global Protein Engineering in Biotechnology Industry Revenue Million Forecast, by Country 2019 & 2032
- Table 20: Global Protein Engineering in Biotechnology Industry Volume K Unit Forecast, by Country 2019 & 2032
- Table 21: Germany Protein Engineering in Biotechnology Industry Revenue (Million) Forecast, by Application 2019 & 2032
- Table 22: Germany Protein Engineering in Biotechnology Industry Volume (K Unit) Forecast, by Application 2019 & 2032
- Table 23: United Kingdom Protein Engineering in Biotechnology Industry Revenue (Million) Forecast, by Application 2019 & 2032
- Table 24: United Kingdom Protein Engineering in Biotechnology Industry Volume (K Unit) Forecast, by Application 2019 & 2032
- Table 25: France Protein Engineering in Biotechnology Industry Revenue (Million) Forecast, by Application 2019 & 2032
- Table 26: France Protein Engineering in Biotechnology Industry Volume (K Unit) Forecast, by Application 2019 & 2032
- Table 27: Italy Protein Engineering in Biotechnology Industry Revenue (Million) Forecast, by Application 2019 & 2032
- Table 28: Italy Protein Engineering in Biotechnology Industry Volume (K Unit) Forecast, by Application 2019 & 2032
- Table 29: Spain Protein Engineering in Biotechnology Industry Revenue (Million) Forecast, by Application 2019 & 2032
- Table 30: Spain Protein Engineering in Biotechnology Industry Volume (K Unit) Forecast, by Application 2019 & 2032
- Table 31: Rest of Europe Protein Engineering in Biotechnology Industry Revenue (Million) Forecast, by Application 2019 & 2032
- Table 32: Rest of Europe Protein Engineering in Biotechnology Industry Volume (K Unit) Forecast, by Application 2019 & 2032
- Table 33: Global Protein Engineering in Biotechnology Industry Revenue Million Forecast, by Country 2019 & 2032
- Table 34: Global Protein Engineering in Biotechnology Industry Volume K Unit Forecast, by Country 2019 & 2032
- Table 35: China Protein Engineering in Biotechnology Industry Revenue (Million) Forecast, by Application 2019 & 2032
- Table 36: China Protein Engineering in Biotechnology Industry Volume (K Unit) Forecast, by Application 2019 & 2032
- Table 37: Japan Protein Engineering in Biotechnology Industry Revenue (Million) Forecast, by Application 2019 & 2032
- Table 38: Japan Protein Engineering in Biotechnology Industry Volume (K Unit) Forecast, by Application 2019 & 2032
- Table 39: India Protein Engineering in Biotechnology Industry Revenue (Million) Forecast, by Application 2019 & 2032
- Table 40: India Protein Engineering in Biotechnology Industry Volume (K Unit) Forecast, by Application 2019 & 2032
- Table 41: Australia Protein Engineering in Biotechnology Industry Revenue (Million) Forecast, by Application 2019 & 2032
- Table 42: Australia Protein Engineering in Biotechnology Industry Volume (K Unit) Forecast, by Application 2019 & 2032
- Table 43: South Korea Protein Engineering in Biotechnology Industry Revenue (Million) Forecast, by Application 2019 & 2032
- Table 44: South Korea Protein Engineering in Biotechnology Industry Volume (K Unit) Forecast, by Application 2019 & 2032
- Table 45: Rest of Asia Pacific Protein Engineering in Biotechnology Industry Revenue (Million) Forecast, by Application 2019 & 2032
- Table 46: Rest of Asia Pacific Protein Engineering in Biotechnology Industry Volume (K Unit) Forecast, by Application 2019 & 2032
- Table 47: Global Protein Engineering in Biotechnology Industry Revenue Million Forecast, by Country 2019 & 2032
- Table 48: Global Protein Engineering in Biotechnology Industry Volume K Unit Forecast, by Country 2019 & 2032
- Table 49: GCC Protein Engineering in Biotechnology Industry Revenue (Million) Forecast, by Application 2019 & 2032
- Table 50: GCC Protein Engineering in Biotechnology Industry Volume (K Unit) Forecast, by Application 2019 & 2032
- Table 51: South Africa Protein Engineering in Biotechnology Industry Revenue (Million) Forecast, by Application 2019 & 2032
- Table 52: South Africa Protein Engineering in Biotechnology Industry Volume (K Unit) Forecast, by Application 2019 & 2032
- Table 53: Rest of Middle East and Africa Protein Engineering in Biotechnology Industry Revenue (Million) Forecast, by Application 2019 & 2032
- Table 54: Rest of Middle East and Africa Protein Engineering in Biotechnology Industry Volume (K Unit) Forecast, by Application 2019 & 2032
- Table 55: Global Protein Engineering in Biotechnology Industry Revenue Million Forecast, by Country 2019 & 2032
- Table 56: Global Protein Engineering in Biotechnology Industry Volume K Unit Forecast, by Country 2019 & 2032
- Table 57: Brazil Protein Engineering in Biotechnology Industry Revenue (Million) Forecast, by Application 2019 & 2032
- Table 58: Brazil Protein Engineering in Biotechnology Industry Volume (K Unit) Forecast, by Application 2019 & 2032
- Table 59: Argentina Protein Engineering in Biotechnology Industry Revenue (Million) Forecast, by Application 2019 & 2032
- Table 60: Argentina Protein Engineering in Biotechnology Industry Volume (K Unit) Forecast, by Application 2019 & 2032
- Table 61: Rest of South America Protein Engineering in Biotechnology Industry Revenue (Million) Forecast, by Application 2019 & 2032
- Table 62: Rest of South America Protein Engineering in Biotechnology Industry Volume (K Unit) Forecast, by Application 2019 & 2032
- Table 63: Global Protein Engineering in Biotechnology Industry Revenue Million Forecast, by Product Type 2019 & 2032
- Table 64: Global Protein Engineering in Biotechnology Industry Volume K Unit Forecast, by Product Type 2019 & 2032
- Table 65: Global Protein Engineering in Biotechnology Industry Revenue Million Forecast, by Technology 2019 & 2032
- Table 66: Global Protein Engineering in Biotechnology Industry Volume K Unit Forecast, by Technology 2019 & 2032
- Table 67: Global Protein Engineering in Biotechnology Industry Revenue Million Forecast, by End User 2019 & 2032
- Table 68: Global Protein Engineering in Biotechnology Industry Volume K Unit Forecast, by End User 2019 & 2032
- Table 69: Global Protein Engineering in Biotechnology Industry Revenue Million Forecast, by Country 2019 & 2032
- Table 70: Global Protein Engineering in Biotechnology Industry Volume K Unit Forecast, by Country 2019 & 2032
- Table 71: United States Protein Engineering in Biotechnology Industry Revenue (Million) Forecast, by Application 2019 & 2032
- Table 72: United States Protein Engineering in Biotechnology Industry Volume (K Unit) Forecast, by Application 2019 & 2032
- Table 73: Canada Protein Engineering in Biotechnology Industry Revenue (Million) Forecast, by Application 2019 & 2032
- Table 74: Canada Protein Engineering in Biotechnology Industry Volume (K Unit) Forecast, by Application 2019 & 2032
- Table 75: Mexico Protein Engineering in Biotechnology Industry Revenue (Million) Forecast, by Application 2019 & 2032
- Table 76: Mexico Protein Engineering in Biotechnology Industry Volume (K Unit) Forecast, by Application 2019 & 2032
- Table 77: Global Protein Engineering in Biotechnology Industry Revenue Million Forecast, by Product Type 2019 & 2032
- Table 78: Global Protein Engineering in Biotechnology Industry Volume K Unit Forecast, by Product Type 2019 & 2032
- Table 79: Global Protein Engineering in Biotechnology Industry Revenue Million Forecast, by Technology 2019 & 2032
- Table 80: Global Protein Engineering in Biotechnology Industry Volume K Unit Forecast, by Technology 2019 & 2032
- Table 81: Global Protein Engineering in Biotechnology Industry Revenue Million Forecast, by End User 2019 & 2032
- Table 82: Global Protein Engineering in Biotechnology Industry Volume K Unit Forecast, by End User 2019 & 2032
- Table 83: Global Protein Engineering in Biotechnology Industry Revenue Million Forecast, by Country 2019 & 2032
- Table 84: Global Protein Engineering in Biotechnology Industry Volume K Unit Forecast, by Country 2019 & 2032
- Table 85: Germany Protein Engineering in Biotechnology Industry Revenue (Million) Forecast, by Application 2019 & 2032
- Table 86: Germany Protein Engineering in Biotechnology Industry Volume (K Unit) Forecast, by Application 2019 & 2032
- Table 87: United Kingdom Protein Engineering in Biotechnology Industry Revenue (Million) Forecast, by Application 2019 & 2032
- Table 88: United Kingdom Protein Engineering in Biotechnology Industry Volume (K Unit) Forecast, by Application 2019 & 2032
- Table 89: France Protein Engineering in Biotechnology Industry Revenue (Million) Forecast, by Application 2019 & 2032
- Table 90: France Protein Engineering in Biotechnology Industry Volume (K Unit) Forecast, by Application 2019 & 2032
- Table 91: Italy Protein Engineering in Biotechnology Industry Revenue (Million) Forecast, by Application 2019 & 2032
- Table 92: Italy Protein Engineering in Biotechnology Industry Volume (K Unit) Forecast, by Application 2019 & 2032
- Table 93: Spain Protein Engineering in Biotechnology Industry Revenue (Million) Forecast, by Application 2019 & 2032
- Table 94: Spain Protein Engineering in Biotechnology Industry Volume (K Unit) Forecast, by Application 2019 & 2032
- Table 95: Rest of Europe Protein Engineering in Biotechnology Industry Revenue (Million) Forecast, by Application 2019 & 2032
- Table 96: Rest of Europe Protein Engineering in Biotechnology Industry Volume (K Unit) Forecast, by Application 2019 & 2032
- Table 97: Global Protein Engineering in Biotechnology Industry Revenue Million Forecast, by Product Type 2019 & 2032
- Table 98: Global Protein Engineering in Biotechnology Industry Volume K Unit Forecast, by Product Type 2019 & 2032
- Table 99: Global Protein Engineering in Biotechnology Industry Revenue Million Forecast, by Technology 2019 & 2032
- Table 100: Global Protein Engineering in Biotechnology Industry Volume K Unit Forecast, by Technology 2019 & 2032
- Table 101: Global Protein Engineering in Biotechnology Industry Revenue Million Forecast, by End User 2019 & 2032
- Table 102: Global Protein Engineering in Biotechnology Industry Volume K Unit Forecast, by End User 2019 & 2032
- Table 103: Global Protein Engineering in Biotechnology Industry Revenue Million Forecast, by Country 2019 & 2032
- Table 104: Global Protein Engineering in Biotechnology Industry Volume K Unit Forecast, by Country 2019 & 2032
- Table 105: China Protein Engineering in Biotechnology Industry Revenue (Million) Forecast, by Application 2019 & 2032
- Table 106: China Protein Engineering in Biotechnology Industry Volume (K Unit) Forecast, by Application 2019 & 2032
- Table 107: Japan Protein Engineering in Biotechnology Industry Revenue (Million) Forecast, by Application 2019 & 2032
- Table 108: Japan Protein Engineering in Biotechnology Industry Volume (K Unit) Forecast, by Application 2019 & 2032
- Table 109: India Protein Engineering in Biotechnology Industry Revenue (Million) Forecast, by Application 2019 & 2032
- Table 110: India Protein Engineering in Biotechnology Industry Volume (K Unit) Forecast, by Application 2019 & 2032
- Table 111: Australia Protein Engineering in Biotechnology Industry Revenue (Million) Forecast, by Application 2019 & 2032
- Table 112: Australia Protein Engineering in Biotechnology Industry Volume (K Unit) Forecast, by Application 2019 & 2032
- Table 113: South Korea Protein Engineering in Biotechnology Industry Revenue (Million) Forecast, by Application 2019 & 2032
- Table 114: South Korea Protein Engineering in Biotechnology Industry Volume (K Unit) Forecast, by Application 2019 & 2032
- Table 115: Rest of Asia Pacific Protein Engineering in Biotechnology Industry Revenue (Million) Forecast, by Application 2019 & 2032
- Table 116: Rest of Asia Pacific Protein Engineering in Biotechnology Industry Volume (K Unit) Forecast, by Application 2019 & 2032
- Table 117: Global Protein Engineering in Biotechnology Industry Revenue Million Forecast, by Product Type 2019 & 2032
- Table 118: Global Protein Engineering in Biotechnology Industry Volume K Unit Forecast, by Product Type 2019 & 2032
- Table 119: Global Protein Engineering in Biotechnology Industry Revenue Million Forecast, by Technology 2019 & 2032
- Table 120: Global Protein Engineering in Biotechnology Industry Volume K Unit Forecast, by Technology 2019 & 2032
- Table 121: Global Protein Engineering in Biotechnology Industry Revenue Million Forecast, by End User 2019 & 2032
- Table 122: Global Protein Engineering in Biotechnology Industry Volume K Unit Forecast, by End User 2019 & 2032
- Table 123: Global Protein Engineering in Biotechnology Industry Revenue Million Forecast, by Country 2019 & 2032
- Table 124: Global Protein Engineering in Biotechnology Industry Volume K Unit Forecast, by Country 2019 & 2032
- Table 125: GCC Protein Engineering in Biotechnology Industry Revenue (Million) Forecast, by Application 2019 & 2032
- Table 126: GCC Protein Engineering in Biotechnology Industry Volume (K Unit) Forecast, by Application 2019 & 2032
- Table 127: South Africa Protein Engineering in Biotechnology Industry Revenue (Million) Forecast, by Application 2019 & 2032
- Table 128: South Africa Protein Engineering in Biotechnology Industry Volume (K Unit) Forecast, by Application 2019 & 2032
- Table 129: Rest of Middle East and Africa Protein Engineering in Biotechnology Industry Revenue (Million) Forecast, by Application 2019 & 2032
- Table 130: Rest of Middle East and Africa Protein Engineering in Biotechnology Industry Volume (K Unit) Forecast, by Application 2019 & 2032
- Table 131: Global Protein Engineering in Biotechnology Industry Revenue Million Forecast, by Product Type 2019 & 2032
- Table 132: Global Protein Engineering in Biotechnology Industry Volume K Unit Forecast, by Product Type 2019 & 2032
- Table 133: Global Protein Engineering in Biotechnology Industry Revenue Million Forecast, by Technology 2019 & 2032
- Table 134: Global Protein Engineering in Biotechnology Industry Volume K Unit Forecast, by Technology 2019 & 2032
- Table 135: Global Protein Engineering in Biotechnology Industry Revenue Million Forecast, by End User 2019 & 2032
- Table 136: Global Protein Engineering in Biotechnology Industry Volume K Unit Forecast, by End User 2019 & 2032
- Table 137: Global Protein Engineering in Biotechnology Industry Revenue Million Forecast, by Country 2019 & 2032
- Table 138: Global Protein Engineering in Biotechnology Industry Volume K Unit Forecast, by Country 2019 & 2032
- Table 139: Brazil Protein Engineering in Biotechnology Industry Revenue (Million) Forecast, by Application 2019 & 2032
- Table 140: Brazil Protein Engineering in Biotechnology Industry Volume (K Unit) Forecast, by Application 2019 & 2032
- Table 141: Argentina Protein Engineering in Biotechnology Industry Revenue (Million) Forecast, by Application 2019 & 2032
- Table 142: Argentina Protein Engineering in Biotechnology Industry Volume (K Unit) Forecast, by Application 2019 & 2032
- Table 143: Rest of South America Protein Engineering in Biotechnology Industry Revenue (Million) Forecast, by Application 2019 & 2032
- Table 144: Rest of South America Protein Engineering in Biotechnology Industry Volume (K Unit) Forecast, by Application 2019 & 2032
Frequently Asked Questions
1. What is the projected Compound Annual Growth Rate (CAGR) of the Protein Engineering in Biotechnology Industry?
The projected CAGR is approximately 16.25%.
2. Which companies are prominent players in the Protein Engineering in Biotechnology Industry?
Key companies in the market include Novo Nordisk AS, Bio-Rad Laboratories Inc, Merck KGaA, Amgen Inc, Waters Corporation, Thermo Fisher Scientific Inc, Eli Lilly and Company, GenScript Biotech Corporation, Agilent Technologies Inc, PerkinElmer Inc, Bruker Corporation, GE HealthCare.
3. What are the main segments of the Protein Engineering in Biotechnology Industry?
The market segments include Product Type, Technology, End User.
4. Can you provide details about the market size?
The market size is estimated to be USD 3.52 Million as of 2022.
5. What are some drivers contributing to market growth?
Increasing Prevalence of Chronic Diseases and Rise in Demand for Targeted Therapies; Rising Government Funding for Protein Engineering Studies.
6. What are the notable trends driving market growth?
The Monoclonal Antibodies Segment is Anticipated to Witness Notable Growth Over the Forecast Period.
7. Are there any restraints impacting market growth?
High Costs of Protein Engineering Techniques.
8. Can you provide examples of recent developments in the market?
April 2024: Northpond-funded Laboratory for Bioengineering Research and Innovation made an investment with the Wyss Institute for the AmnioX project to facilitate the development of protein-based drugs, thus improving the accessibility of medicines to patients.
9. What pricing options are available for accessing the report?
Pricing options include single-user, multi-user, and enterprise licenses priced at USD 4750, USD 5250, and USD 8750 respectively.
10. Is the market size provided in terms of value or volume?
The market size is provided in terms of value, measured in Million and volume, measured in K Unit.
11. Are there any specific market keywords associated with the report?
Yes, the market keyword associated with the report is "Protein Engineering in Biotechnology Industry," which aids in identifying and referencing the specific market segment covered.
12. How do I determine which pricing option suits my needs best?
The pricing options vary based on user requirements and access needs. Individual users may opt for single-user licenses, while businesses requiring broader access may choose multi-user or enterprise licenses for cost-effective access to the report.
13. Are there any additional resources or data provided in the Protein Engineering in Biotechnology Industry report?
While the report offers comprehensive insights, it's advisable to review the specific contents or supplementary materials provided to ascertain if additional resources or data are available.
14. How can I stay updated on further developments or reports in the Protein Engineering in Biotechnology Industry?
To stay informed about further developments, trends, and reports in the Protein Engineering in Biotechnology Industry, consider subscribing to industry newsletters, following relevant companies and organizations, or regularly checking reputable industry news sources and publications.
Methodology
Step 1 - Identification of Relevant Samples Size from Population Database


Step 2 - Approaches for Defining Global Market Size (Value, Volume* & Price*)

Note*: In applicable scenarios
Step 3 - Data Sources
Primary Research
- Web Analytics
- Survey Reports
- Research Institute
- Latest Research Reports
- Opinion Leaders
Secondary Research
- Annual Reports
- White Paper
- Latest Press Release
- Industry Association
- Paid Database
- Investor Presentations

Step 4 - Data Triangulation
Involves using different sources of information in order to increase the validity of a study
These sources are likely to be stakeholders in a program - participants, other researchers, program staff, other community members, and so on.
Then we put all data in single framework & apply various statistical tools to find out the dynamic on the market.
During the analysis stage, feedback from the stakeholder groups would be compared to determine areas of agreement as well as areas of divergence
