

Key Insights
The retail-ready packaging market is experiencing significant expansion, fueled by escalating demand for efficient and visually appealing in-store display solutions. A projected Compound Annual Growth Rate (CAGR) of 5.7% indicates substantial market growth throughout the forecast period. Key growth drivers include the burgeoning e-commerce sector, the imperative for streamlined supply chain operations, and a growing consumer preference for sustainable and eco-friendly packaging. Analysis of market segmentation reveals a varied landscape. Paper and paperboard maintain dominance as a material type due to its cost-effectiveness and recyclability. However, plastics and advanced materials are gaining prominence, driven by innovations in barrier properties and the need for extended product shelf life. Die-cut display containers and corrugated cardboard boxes are leading package types, prized for their versatility across diverse products and retail environments. The food and beverage sector represents a significant portion of end-user applications, with growth anticipated across all segments due to increasing product variety and sophisticated branding strategies. Geographically, North America and Europe exhibit strong market presence, while Asia-Pacific is identified as a high-growth region, propelled by rapid economic development and an expanding consumer base. Leading market participants are prioritizing investments in innovative packaging designs, automation, and sustainable sourcing to secure a competitive advantage and address evolving consumer and retail expectations.
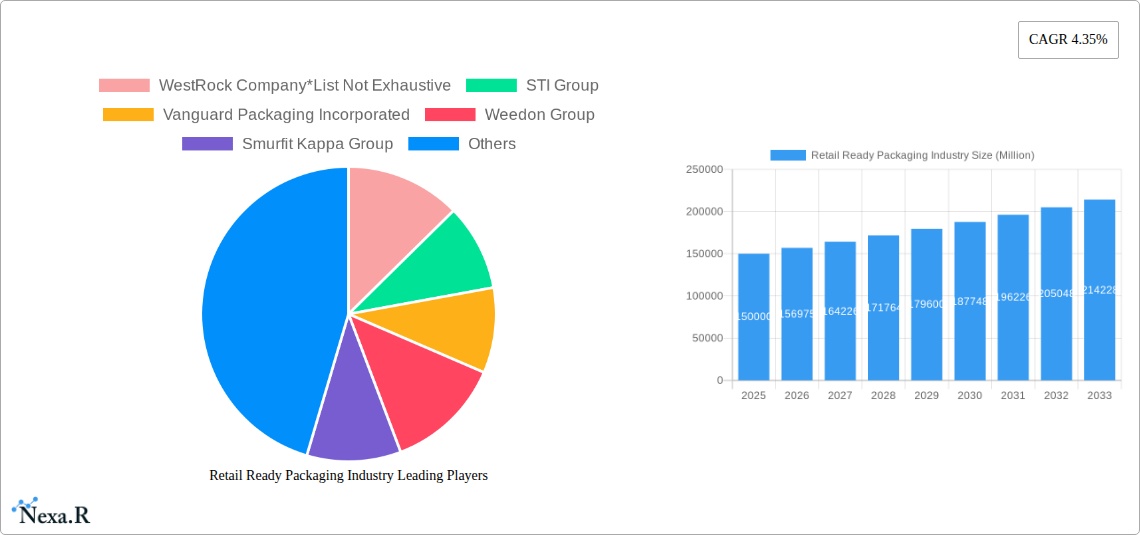
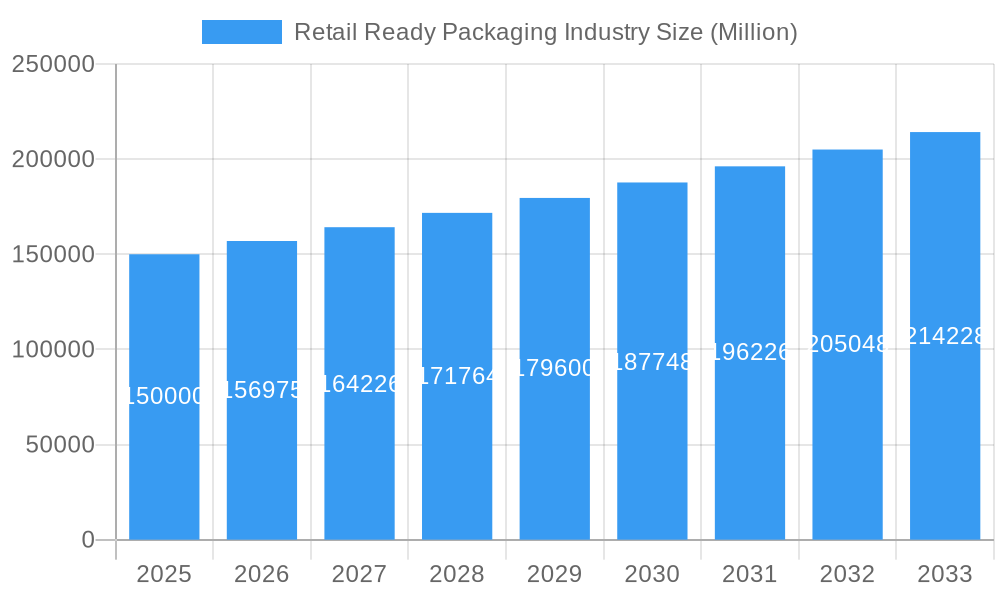
Retail Ready Packaging Industry Market Size (In Billion)
Intense competition characterizes the market, with key players actively pursuing market share through strategic alliances, mergers, acquisitions, and technological advancements. However, escalating raw material costs and stringent environmental regulations pose considerable challenges, underscoring the necessity for continuous innovation in sustainable and cost-effective packaging solutions. The forecast period is expected to witness further industry consolidation, with companies concentrating on expanding product portfolios, enhancing supply chain efficiencies, and capitalizing on regional growth opportunities. Significant research and development investments are anticipated to explore novel eco-friendly materials and develop efficient packaging solutions for online retail, focusing on product protection during transit and optimizing the unboxing experience. The increasing trend towards personalized and interactive packaging, designed to enhance consumer engagement and brand loyalty, will also shape the future trajectory of the retail-ready packaging market.
Retail Ready Packaging Industry Company Market Share
Retail Ready Packaging Market Size: The global retail-ready packaging market is projected to reach approximately 78.31 billion by the end of the base year 2025. This comprehensive report offers an in-depth analysis of the retail-ready packaging industry, covering market dynamics, growth trends, regional dominance, product segmentation, key players, and future projections. The analysis spans from 2019 to 2033, with a base year of 2025 and a forecast period of 2025-2033. This report is essential for businesses operating within or considering entry into the packaging sector, including manufacturers, distributors, retailers, and investors. Market values are presented in billion units.
Retail Ready Packaging Industry Market Dynamics & Structure
The retail ready packaging market is characterized by moderate concentration, with several major players holding significant market share. Technological innovations, particularly in sustainable materials and automated packaging solutions, are key drivers. Regulatory frameworks concerning sustainability and recyclability are increasingly influencing product development and adoption. Competitive substitutes, such as reusable packaging systems, pose a challenge, while end-user demographics, specifically the growth of e-commerce, significantly impact demand. Mergers and acquisitions (M&A) activity has been steady, contributing to market consolidation.
- Market Concentration: Moderately concentrated, with top 10 players holding xx% market share in 2024.
- Technological Innovation: Focus on automation, sustainable materials (e.g., recycled paperboard, biodegradable plastics), and improved display capabilities.
- Regulatory Framework: Growing emphasis on sustainability and recyclability, leading to stricter regulations in various regions.
- Competitive Substitutes: Reusable packaging systems and alternative display methods present competitive pressures.
- End-User Demographics: E-commerce growth fuels demand for efficient and protective packaging for individual shipments.
- M&A Trends: xx M&A deals recorded in the last 5 years, indicating ongoing market consolidation.
Retail Ready Packaging Industry Growth Trends & Insights
The retail ready packaging market witnessed robust growth during the historical period (2019-2024), driven by the expansion of e-commerce, increased consumer demand for convenience, and a greater focus on sustainable packaging solutions. The market is expected to maintain a healthy CAGR of xx% during the forecast period (2025-2033). Technological advancements, such as the integration of smart packaging and improved automation in packaging lines, are further accelerating growth. Consumer preferences for convenient and visually appealing packaging are also driving adoption rates. Market penetration of retail-ready packaging in various end-user applications continues to increase, particularly in the food and beverage sector.
Dominant Regions, Countries, or Segments in Retail Ready Packaging Industry
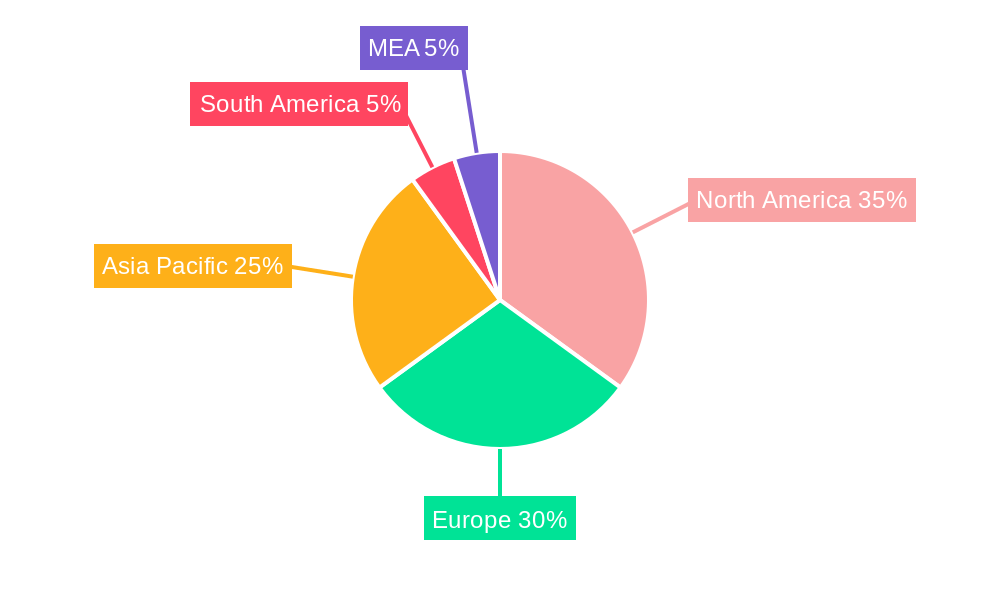
North America and Europe currently dominate the retail ready packaging market, driven by high consumer spending, robust retail infrastructure, and stringent regulatory frameworks promoting sustainable packaging. However, Asia-Pacific is projected to witness the fastest growth due to rapid economic development, expanding retail sectors, and increasing disposable incomes.
By Material Type: Paper and paperboard currently holds the largest market share, driven by its cost-effectiveness and recyclability. However, the demand for plastics is also substantial, particularly in applications requiring high barrier properties or enhanced product protection.
By Type of Package: Corrugated cardboard boxes account for the largest segment, owing to their versatility and cost-effectiveness. Die-cut display containers are experiencing significant growth due to their enhanced visual appeal and ability to improve product presentation on retail shelves.
By End-User Application: The food and beverage sector is a dominant end-user, followed by household products.
- North America: Strong retail sector, high consumer spending, and focus on sustainability drive growth.
- Europe: Similar to North America, with a mature market and high adoption of sustainable packaging.
- Asia-Pacific: Fastest-growing region, fueled by economic expansion and increasing consumer demand.
- Paper and Paperboard: Largest market segment due to cost-effectiveness and sustainability.
- Corrugated Cardboard Boxes: Dominates the type of package segment due to versatility and cost-effectiveness.
- Food and Beverage: Leading end-user application, with high demand for protective and aesthetically pleasing packaging.
Retail Ready Packaging Industry Product Landscape
The retail ready packaging landscape is marked by continuous innovation in materials, design, and functionality. New materials emphasizing sustainability, such as recycled paperboard and biodegradable plastics, are gaining traction. Innovative designs focusing on improved shelf appeal, enhanced product protection, and ease of handling are also prevalent. Performance metrics include cost-effectiveness, recyclability, shelf life extension, and tamper evidence. Unique selling propositions often revolve around sustainability claims, superior product protection, and improved display capabilities.
Key Drivers, Barriers & Challenges in Retail Ready Packaging Industry
Key Drivers:
- Growing e-commerce sector driving demand for efficient and protective packaging.
- Increasing consumer preference for convenient and aesthetically pleasing packaging.
- Rising focus on sustainability and environmentally friendly packaging solutions.
- Technological advancements such as automation and smart packaging.
Key Barriers & Challenges:
- Fluctuations in raw material prices, impacting production costs.
- Stringent environmental regulations increasing compliance burdens.
- Intense competition among packaging manufacturers.
- Supply chain disruptions impacting timely delivery of materials and products.
Emerging Opportunities in Retail Ready Packaging Industry
- Growing demand for customized and personalized packaging.
- Expansion into emerging markets with untapped potential.
- Development of innovative packaging solutions for specific product categories.
- Integration of smart packaging technologies for enhanced traceability and consumer engagement.
Growth Accelerators in the Retail Ready Packaging Industry Industry
Technological breakthroughs in sustainable materials, automation, and smart packaging are key growth accelerators. Strategic partnerships between packaging manufacturers and retailers are enhancing supply chain efficiency. Market expansion strategies, particularly into developing economies, are expected to drive future growth.
Key Players Shaping the Retail Ready Packaging Industry Market
- WestRock Company
- STI Group
- Vanguard Packaging Incorporated
- Weedon Group
- Smurfit Kappa Group
- Caps Cases Limited
- Cardboard Box Company
- DS Smith PLC
- Mondi Group
- International Paper Company
Notable Milestones in Retail Ready Packaging Industry Sector
- October 2022: ORBIS Corporation showcased integrated reusable packaging solutions at PACK EXPO 2022, highlighting improved supply chain efficiency and sustainability.
- February 2022: Linpac Packaging launched a new line of rigid-plastic, retail-ready packaging, emphasizing flexibility, structural soundness, and impact absorption.
In-Depth Retail Ready Packaging Industry Market Outlook
The retail ready packaging market is poised for continued growth, driven by technological innovation, sustainability initiatives, and expanding e-commerce. Strategic partnerships and market expansion into developing regions will play a significant role in shaping the future market landscape. The focus on sustainable and innovative packaging solutions will be paramount in securing market share and meeting evolving consumer demands.
Retail Ready Packaging Industry Segmentation
-
1. Material Type
- 1.1. Paper and Paperboard
- 1.2. Plastics
- 1.3. Other Material Types
-
2. Type of Package
- 2.1. Die-cut Display Containers
- 2.2. Corrugated Cardboard Boxes
- 2.3. Shrink Wrapped Trays
- 2.4. Modified Cases
- 2.5. Plastic Containers
- 2.6. Other Type of Packages
-
3. End-User Application
- 3.1. Food
- 3.2. Beverage
- 3.3. Household Products
- 3.4. Other End-User Applications
Retail Ready Packaging Industry Segmentation By Geography
-
1. North America
- 1.1. United States
- 1.2. Canada
-
2. Europe
- 2.1. Germany
- 2.2. United Kingdoms
- 2.3. France
- 2.4. Rest of the Europe
-
3. Asia Pacific
- 3.1. China
- 3.2. India
- 3.3. Japan
- 3.4. Rest of the Asia Pacific
- 4. Latin America
- 5. Middle East and Africa
Retail Ready Packaging Industry Regional Market Share
Geographic Coverage of Retail Ready Packaging Industry
Retail Ready Packaging Industry REPORT HIGHLIGHTS
| Aspects | Details |
|---|---|
| Study Period | 2020-2034 |
| Base Year | 2025 |
| Estimated Year | 2026 |
| Forecast Period | 2026-2034 |
| Historical Period | 2020-2025 |
| Growth Rate | CAGR of 5.7% from 2020-2034 |
| Segmentation |
|
Table of Contents
- 1. Introduction
- 1.1. Research Scope
- 1.2. Market Segmentation
- 1.3. Research Objective
- 1.4. Definitions and Assumptions
- 2. Executive Summary
- 2.1. Market Snapshot
- 3. Market Dynamics
- 3.1. Market Drivers
- 3.2. Market Restrains
- 3.3. Market Trends
- 3.4. Market Opportunities
- 4. Market Factor Analysis
- 4.1. Porters Five Forces
- 4.1.1. Bargaining Power of Suppliers
- 4.1.2. Bargaining Power of Buyers
- 4.1.3. Threat of New Entrants
- 4.1.4. Threat of Substitutes
- 4.1.5. Competitive Rivalry
- 4.2. PESTEL analysis
- 4.3. BCG Analysis
- 4.3.1. Stars (High Growth, High Market Share)
- 4.3.2. Cash Cows (Low Growth, High Market Share)
- 4.3.3. Question Mark (High Growth, Low Market Share)
- 4.3.4. Dogs (Low Growth, Low Market Share)
- 4.4. Ansoff Matrix Analysis
- 4.5. Supply Chain Analysis
- 4.6. Regulatory Landscape
- 4.7. Current Market Potential and Opportunity Assessment (TAM–SAM–SOM Framework)
- 4.8. NRP Analyst Note
- 4.1. Porters Five Forces
- 5. Market Analysis, Insights and Forecast 2021-2033
- 5.1. Market Analysis, Insights and Forecast - by Material Type
- 5.1.1. Paper and Paperboard
- 5.1.2. Plastics
- 5.1.3. Other Material Types
- 5.2. Market Analysis, Insights and Forecast - by Type of Package
- 5.2.1. Die-cut Display Containers
- 5.2.2. Corrugated Cardboard Boxes
- 5.2.3. Shrink Wrapped Trays
- 5.2.4. Modified Cases
- 5.2.5. Plastic Containers
- 5.2.6. Other Type of Packages
- 5.3. Market Analysis, Insights and Forecast - by End-User Application
- 5.3.1. Food
- 5.3.2. Beverage
- 5.3.3. Household Products
- 5.3.4. Other End-User Applications
- 5.4. Market Analysis, Insights and Forecast - by Region
- 5.4.1. North America
- 5.4.2. Europe
- 5.4.3. Asia Pacific
- 5.4.4. Latin America
- 5.4.5. Middle East and Africa
- 5.1. Market Analysis, Insights and Forecast - by Material Type
- 6. Global Retail Ready Packaging Industry Analysis, Insights and Forecast, 2021-2033
- 6.1. Market Analysis, Insights and Forecast - by Material Type
- 6.1.1. Paper and Paperboard
- 6.1.2. Plastics
- 6.1.3. Other Material Types
- 6.2. Market Analysis, Insights and Forecast - by Type of Package
- 6.2.1. Die-cut Display Containers
- 6.2.2. Corrugated Cardboard Boxes
- 6.2.3. Shrink Wrapped Trays
- 6.2.4. Modified Cases
- 6.2.5. Plastic Containers
- 6.2.6. Other Type of Packages
- 6.3. Market Analysis, Insights and Forecast - by End-User Application
- 6.3.1. Food
- 6.3.2. Beverage
- 6.3.3. Household Products
- 6.3.4. Other End-User Applications
- 6.1. Market Analysis, Insights and Forecast - by Material Type
- 7. North America Retail Ready Packaging Industry Analysis, Insights and Forecast, 2020-2032
- 7.1. Market Analysis, Insights and Forecast - by Material Type
- 7.1.1. Paper and Paperboard
- 7.1.2. Plastics
- 7.1.3. Other Material Types
- 7.2. Market Analysis, Insights and Forecast - by Type of Package
- 7.2.1. Die-cut Display Containers
- 7.2.2. Corrugated Cardboard Boxes
- 7.2.3. Shrink Wrapped Trays
- 7.2.4. Modified Cases
- 7.2.5. Plastic Containers
- 7.2.6. Other Type of Packages
- 7.3. Market Analysis, Insights and Forecast - by End-User Application
- 7.3.1. Food
- 7.3.2. Beverage
- 7.3.3. Household Products
- 7.3.4. Other End-User Applications
- 7.1. Market Analysis, Insights and Forecast - by Material Type
- 8. Europe Retail Ready Packaging Industry Analysis, Insights and Forecast, 2020-2032
- 8.1. Market Analysis, Insights and Forecast - by Material Type
- 8.1.1. Paper and Paperboard
- 8.1.2. Plastics
- 8.1.3. Other Material Types
- 8.2. Market Analysis, Insights and Forecast - by Type of Package
- 8.2.1. Die-cut Display Containers
- 8.2.2. Corrugated Cardboard Boxes
- 8.2.3. Shrink Wrapped Trays
- 8.2.4. Modified Cases
- 8.2.5. Plastic Containers
- 8.2.6. Other Type of Packages
- 8.3. Market Analysis, Insights and Forecast - by End-User Application
- 8.3.1. Food
- 8.3.2. Beverage
- 8.3.3. Household Products
- 8.3.4. Other End-User Applications
- 8.1. Market Analysis, Insights and Forecast - by Material Type
- 9. Asia Pacific Retail Ready Packaging Industry Analysis, Insights and Forecast, 2020-2032
- 9.1. Market Analysis, Insights and Forecast - by Material Type
- 9.1.1. Paper and Paperboard
- 9.1.2. Plastics
- 9.1.3. Other Material Types
- 9.2. Market Analysis, Insights and Forecast - by Type of Package
- 9.2.1. Die-cut Display Containers
- 9.2.2. Corrugated Cardboard Boxes
- 9.2.3. Shrink Wrapped Trays
- 9.2.4. Modified Cases
- 9.2.5. Plastic Containers
- 9.2.6. Other Type of Packages
- 9.3. Market Analysis, Insights and Forecast - by End-User Application
- 9.3.1. Food
- 9.3.2. Beverage
- 9.3.3. Household Products
- 9.3.4. Other End-User Applications
- 9.1. Market Analysis, Insights and Forecast - by Material Type
- 10. Latin America Retail Ready Packaging Industry Analysis, Insights and Forecast, 2020-2032
- 10.1. Market Analysis, Insights and Forecast - by Material Type
- 10.1.1. Paper and Paperboard
- 10.1.2. Plastics
- 10.1.3. Other Material Types
- 10.2. Market Analysis, Insights and Forecast - by Type of Package
- 10.2.1. Die-cut Display Containers
- 10.2.2. Corrugated Cardboard Boxes
- 10.2.3. Shrink Wrapped Trays
- 10.2.4. Modified Cases
- 10.2.5. Plastic Containers
- 10.2.6. Other Type of Packages
- 10.3. Market Analysis, Insights and Forecast - by End-User Application
- 10.3.1. Food
- 10.3.2. Beverage
- 10.3.3. Household Products
- 10.3.4. Other End-User Applications
- 10.1. Market Analysis, Insights and Forecast - by Material Type
- 11. Middle East and Africa Retail Ready Packaging Industry Analysis, Insights and Forecast, 2020-2032
- 11.1. Market Analysis, Insights and Forecast - by Material Type
- 11.1.1. Paper and Paperboard
- 11.1.2. Plastics
- 11.1.3. Other Material Types
- 11.2. Market Analysis, Insights and Forecast - by Type of Package
- 11.2.1. Die-cut Display Containers
- 11.2.2. Corrugated Cardboard Boxes
- 11.2.3. Shrink Wrapped Trays
- 11.2.4. Modified Cases
- 11.2.5. Plastic Containers
- 11.2.6. Other Type of Packages
- 11.3. Market Analysis, Insights and Forecast - by End-User Application
- 11.3.1. Food
- 11.3.2. Beverage
- 11.3.3. Household Products
- 11.3.4. Other End-User Applications
- 11.1. Market Analysis, Insights and Forecast - by Material Type
- 12. Competitive Analysis
- 12.1. Company Profiles
- 12.1.1 WestRock Company*List Not Exhaustive
- 12.1.1.1. Company Overview
- 12.1.1.2. Products
- 12.1.1.3. Company Financials
- 12.1.1.4. SWOT Analysis
- 12.1.2 STI Group
- 12.1.2.1. Company Overview
- 12.1.2.2. Products
- 12.1.2.3. Company Financials
- 12.1.2.4. SWOT Analysis
- 12.1.3 Vanguard Packaging Incorporated
- 12.1.3.1. Company Overview
- 12.1.3.2. Products
- 12.1.3.3. Company Financials
- 12.1.3.4. SWOT Analysis
- 12.1.4 Weedon Group
- 12.1.4.1. Company Overview
- 12.1.4.2. Products
- 12.1.4.3. Company Financials
- 12.1.4.4. SWOT Analysis
- 12.1.5 Smurfit Kappa Group
- 12.1.5.1. Company Overview
- 12.1.5.2. Products
- 12.1.5.3. Company Financials
- 12.1.5.4. SWOT Analysis
- 12.1.6 Caps Cases Limited
- 12.1.6.1. Company Overview
- 12.1.6.2. Products
- 12.1.6.3. Company Financials
- 12.1.6.4. SWOT Analysis
- 12.1.7 Cardboard Box Company
- 12.1.7.1. Company Overview
- 12.1.7.2. Products
- 12.1.7.3. Company Financials
- 12.1.7.4. SWOT Analysis
- 12.1.8 DS Smith PLC
- 12.1.8.1. Company Overview
- 12.1.8.2. Products
- 12.1.8.3. Company Financials
- 12.1.8.4. SWOT Analysis
- 12.1.9 Mondi Group
- 12.1.9.1. Company Overview
- 12.1.9.2. Products
- 12.1.9.3. Company Financials
- 12.1.9.4. SWOT Analysis
- 12.1.10 International Paper Company
- 12.1.10.1. Company Overview
- 12.1.10.2. Products
- 12.1.10.3. Company Financials
- 12.1.10.4. SWOT Analysis
- 12.1.1 WestRock Company*List Not Exhaustive
- 12.2. Market Entropy
- 12.2.1 Company's Key Areas Served
- 12.2.2 Recent Developments
- 12.3. Company Market Share Analysis 2025
- 12.3.1 Top 5 Companies Market Share Analysis
- 12.3.2 Top 3 Companies Market Share Analysis
- 12.4. List of Potential Customers
- 13. Research Methodology
List of Figures
- Figure 1: Global Retail Ready Packaging Industry Revenue Breakdown (billion, %) by Region 2025 & 2033
- Figure 2: North America Retail Ready Packaging Industry Revenue (billion), by Material Type 2025 & 2033
- Figure 3: North America Retail Ready Packaging Industry Revenue Share (%), by Material Type 2025 & 2033
- Figure 4: North America Retail Ready Packaging Industry Revenue (billion), by Type of Package 2025 & 2033
- Figure 5: North America Retail Ready Packaging Industry Revenue Share (%), by Type of Package 2025 & 2033
- Figure 6: North America Retail Ready Packaging Industry Revenue (billion), by End-User Application 2025 & 2033
- Figure 7: North America Retail Ready Packaging Industry Revenue Share (%), by End-User Application 2025 & 2033
- Figure 8: North America Retail Ready Packaging Industry Revenue (billion), by Country 2025 & 2033
- Figure 9: North America Retail Ready Packaging Industry Revenue Share (%), by Country 2025 & 2033
- Figure 10: Europe Retail Ready Packaging Industry Revenue (billion), by Material Type 2025 & 2033
- Figure 11: Europe Retail Ready Packaging Industry Revenue Share (%), by Material Type 2025 & 2033
- Figure 12: Europe Retail Ready Packaging Industry Revenue (billion), by Type of Package 2025 & 2033
- Figure 13: Europe Retail Ready Packaging Industry Revenue Share (%), by Type of Package 2025 & 2033
- Figure 14: Europe Retail Ready Packaging Industry Revenue (billion), by End-User Application 2025 & 2033
- Figure 15: Europe Retail Ready Packaging Industry Revenue Share (%), by End-User Application 2025 & 2033
- Figure 16: Europe Retail Ready Packaging Industry Revenue (billion), by Country 2025 & 2033
- Figure 17: Europe Retail Ready Packaging Industry Revenue Share (%), by Country 2025 & 2033
- Figure 18: Asia Pacific Retail Ready Packaging Industry Revenue (billion), by Material Type 2025 & 2033
- Figure 19: Asia Pacific Retail Ready Packaging Industry Revenue Share (%), by Material Type 2025 & 2033
- Figure 20: Asia Pacific Retail Ready Packaging Industry Revenue (billion), by Type of Package 2025 & 2033
- Figure 21: Asia Pacific Retail Ready Packaging Industry Revenue Share (%), by Type of Package 2025 & 2033
- Figure 22: Asia Pacific Retail Ready Packaging Industry Revenue (billion), by End-User Application 2025 & 2033
- Figure 23: Asia Pacific Retail Ready Packaging Industry Revenue Share (%), by End-User Application 2025 & 2033
- Figure 24: Asia Pacific Retail Ready Packaging Industry Revenue (billion), by Country 2025 & 2033
- Figure 25: Asia Pacific Retail Ready Packaging Industry Revenue Share (%), by Country 2025 & 2033
- Figure 26: Latin America Retail Ready Packaging Industry Revenue (billion), by Material Type 2025 & 2033
- Figure 27: Latin America Retail Ready Packaging Industry Revenue Share (%), by Material Type 2025 & 2033
- Figure 28: Latin America Retail Ready Packaging Industry Revenue (billion), by Type of Package 2025 & 2033
- Figure 29: Latin America Retail Ready Packaging Industry Revenue Share (%), by Type of Package 2025 & 2033
- Figure 30: Latin America Retail Ready Packaging Industry Revenue (billion), by End-User Application 2025 & 2033
- Figure 31: Latin America Retail Ready Packaging Industry Revenue Share (%), by End-User Application 2025 & 2033
- Figure 32: Latin America Retail Ready Packaging Industry Revenue (billion), by Country 2025 & 2033
- Figure 33: Latin America Retail Ready Packaging Industry Revenue Share (%), by Country 2025 & 2033
- Figure 34: Middle East and Africa Retail Ready Packaging Industry Revenue (billion), by Material Type 2025 & 2033
- Figure 35: Middle East and Africa Retail Ready Packaging Industry Revenue Share (%), by Material Type 2025 & 2033
- Figure 36: Middle East and Africa Retail Ready Packaging Industry Revenue (billion), by Type of Package 2025 & 2033
- Figure 37: Middle East and Africa Retail Ready Packaging Industry Revenue Share (%), by Type of Package 2025 & 2033
- Figure 38: Middle East and Africa Retail Ready Packaging Industry Revenue (billion), by End-User Application 2025 & 2033
- Figure 39: Middle East and Africa Retail Ready Packaging Industry Revenue Share (%), by End-User Application 2025 & 2033
- Figure 40: Middle East and Africa Retail Ready Packaging Industry Revenue (billion), by Country 2025 & 2033
- Figure 41: Middle East and Africa Retail Ready Packaging Industry Revenue Share (%), by Country 2025 & 2033
List of Tables
- Table 1: Global Retail Ready Packaging Industry Revenue billion Forecast, by Material Type 2020 & 2033
- Table 2: Global Retail Ready Packaging Industry Revenue billion Forecast, by Type of Package 2020 & 2033
- Table 3: Global Retail Ready Packaging Industry Revenue billion Forecast, by End-User Application 2020 & 2033
- Table 4: Global Retail Ready Packaging Industry Revenue billion Forecast, by Region 2020 & 2033
- Table 5: Global Retail Ready Packaging Industry Revenue billion Forecast, by Material Type 2020 & 2033
- Table 6: Global Retail Ready Packaging Industry Revenue billion Forecast, by Type of Package 2020 & 2033
- Table 7: Global Retail Ready Packaging Industry Revenue billion Forecast, by End-User Application 2020 & 2033
- Table 8: Global Retail Ready Packaging Industry Revenue billion Forecast, by Country 2020 & 2033
- Table 9: United States Retail Ready Packaging Industry Revenue (billion) Forecast, by Application 2020 & 2033
- Table 10: Canada Retail Ready Packaging Industry Revenue (billion) Forecast, by Application 2020 & 2033
- Table 11: Global Retail Ready Packaging Industry Revenue billion Forecast, by Material Type 2020 & 2033
- Table 12: Global Retail Ready Packaging Industry Revenue billion Forecast, by Type of Package 2020 & 2033
- Table 13: Global Retail Ready Packaging Industry Revenue billion Forecast, by End-User Application 2020 & 2033
- Table 14: Global Retail Ready Packaging Industry Revenue billion Forecast, by Country 2020 & 2033
- Table 15: Germany Retail Ready Packaging Industry Revenue (billion) Forecast, by Application 2020 & 2033
- Table 16: United Kingdoms Retail Ready Packaging Industry Revenue (billion) Forecast, by Application 2020 & 2033
- Table 17: France Retail Ready Packaging Industry Revenue (billion) Forecast, by Application 2020 & 2033
- Table 18: Rest of the Europe Retail Ready Packaging Industry Revenue (billion) Forecast, by Application 2020 & 2033
- Table 19: Global Retail Ready Packaging Industry Revenue billion Forecast, by Material Type 2020 & 2033
- Table 20: Global Retail Ready Packaging Industry Revenue billion Forecast, by Type of Package 2020 & 2033
- Table 21: Global Retail Ready Packaging Industry Revenue billion Forecast, by End-User Application 2020 & 2033
- Table 22: Global Retail Ready Packaging Industry Revenue billion Forecast, by Country 2020 & 2033
- Table 23: China Retail Ready Packaging Industry Revenue (billion) Forecast, by Application 2020 & 2033
- Table 24: India Retail Ready Packaging Industry Revenue (billion) Forecast, by Application 2020 & 2033
- Table 25: Japan Retail Ready Packaging Industry Revenue (billion) Forecast, by Application 2020 & 2033
- Table 26: Rest of the Asia Pacific Retail Ready Packaging Industry Revenue (billion) Forecast, by Application 2020 & 2033
- Table 27: Global Retail Ready Packaging Industry Revenue billion Forecast, by Material Type 2020 & 2033
- Table 28: Global Retail Ready Packaging Industry Revenue billion Forecast, by Type of Package 2020 & 2033
- Table 29: Global Retail Ready Packaging Industry Revenue billion Forecast, by End-User Application 2020 & 2033
- Table 30: Global Retail Ready Packaging Industry Revenue billion Forecast, by Country 2020 & 2033
- Table 31: Global Retail Ready Packaging Industry Revenue billion Forecast, by Material Type 2020 & 2033
- Table 32: Global Retail Ready Packaging Industry Revenue billion Forecast, by Type of Package 2020 & 2033
- Table 33: Global Retail Ready Packaging Industry Revenue billion Forecast, by End-User Application 2020 & 2033
- Table 34: Global Retail Ready Packaging Industry Revenue billion Forecast, by Country 2020 & 2033
Frequently Asked Questions
1. What is the projected Compound Annual Growth Rate (CAGR) of the Retail Ready Packaging Industry?
The projected CAGR is approximately 5.7%.
2. Which companies are prominent players in the Retail Ready Packaging Industry?
Key companies in the market include WestRock Company*List Not Exhaustive, STI Group, Vanguard Packaging Incorporated, Weedon Group, Smurfit Kappa Group, Caps Cases Limited, Cardboard Box Company, DS Smith PLC, Mondi Group, International Paper Company.
3. What are the main segments of the Retail Ready Packaging Industry?
The market segments include Material Type, Type of Package, End-User Application.
4. Can you provide details about the market size?
The market size is estimated to be USD 78.31 billion as of 2022.
5. What are some drivers contributing to market growth?
Increasing Consumer Interest Towards Convenient and Eco-friendly Shopping Solutions; Growing Need for Streamlining the Supply Chain Process.
6. What are the notable trends driving market growth?
Die-cut Display Container to Hold Significant Share.
7. Are there any restraints impacting market growth?
Investment in R&D Activities and Additional Capital Expenditure.
8. Can you provide examples of recent developments in the market?
October 2022: At the 2022 PACK EXPO, ORBIS Corporation, a global pioneer in reusable packaging, highlighted the importance integrated reusable packaging solutions play in enhancing supply chain effectiveness and sustainability. By enabling a quick and simple transfer of product from the truck directly to the store floor, the XpressBulk retail-ready merchandising trays offer a sustainable, effective solution for the manual shelf replenishment process.
9. What pricing options are available for accessing the report?
Pricing options include single-user, multi-user, and enterprise licenses priced at USD 4750, USD 5250, and USD 8750 respectively.
10. Is the market size provided in terms of value or volume?
The market size is provided in terms of value, measured in billion.
11. Are there any specific market keywords associated with the report?
Yes, the market keyword associated with the report is "Retail Ready Packaging Industry," which aids in identifying and referencing the specific market segment covered.
12. How do I determine which pricing option suits my needs best?
The pricing options vary based on user requirements and access needs. Individual users may opt for single-user licenses, while businesses requiring broader access may choose multi-user or enterprise licenses for cost-effective access to the report.
13. Are there any additional resources or data provided in the Retail Ready Packaging Industry report?
While the report offers comprehensive insights, it's advisable to review the specific contents or supplementary materials provided to ascertain if additional resources or data are available.
14. How can I stay updated on further developments or reports in the Retail Ready Packaging Industry?
To stay informed about further developments, trends, and reports in the Retail Ready Packaging Industry, consider subscribing to industry newsletters, following relevant companies and organizations, or regularly checking reputable industry news sources and publications.
Methodology
Step 1 - Identification of Relevant Samples Size from Population Database


Step 2 - Approaches for Defining Global Market Size (Value, Volume* & Price*)

Note*: In applicable scenarios
Step 3 - Data Sources
Primary Research
- Web Analytics
- Survey Reports
- Research Institute
- Latest Research Reports
- Opinion Leaders
Secondary Research
- Annual Reports
- White Paper
- Latest Press Release
- Industry Association
- Paid Database
- Investor Presentations

Step 4 - Data Triangulation
Involves using different sources of information in order to increase the validity of a study
These sources are likely to be stakeholders in a program - participants, other researchers, program staff, other community members, and so on.
Then we put all data in single framework & apply various statistical tools to find out the dynamic on the market.
During the analysis stage, feedback from the stakeholder groups would be compared to determine areas of agreement as well as areas of divergence