

Key Insights
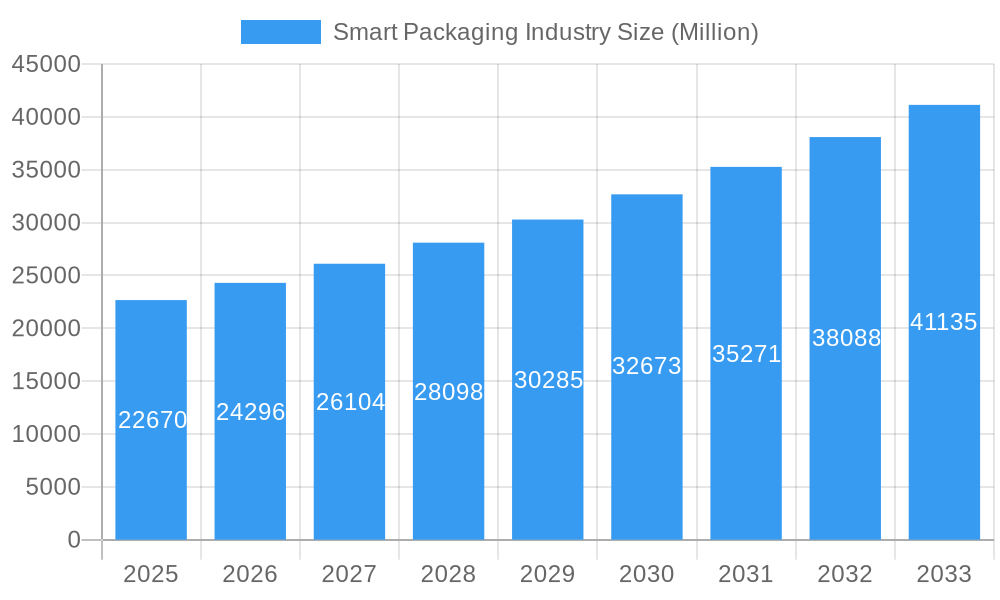
The smart packaging market, valued at $22.67 billion in 2025, is projected to experience robust growth, driven by a Compound Annual Growth Rate (CAGR) of 7.12% from 2025 to 2033. This expansion is fueled by several key factors. Increasing consumer demand for convenience, product authenticity verification, and improved supply chain efficiency are significant drivers. The adoption of technologies like RFID (Radio-Frequency Identification) and sensors for real-time tracking and monitoring of goods throughout the supply chain is accelerating market growth. Furthermore, the rising prevalence of e-commerce and the need for enhanced product protection during transit are boosting demand for sophisticated smart packaging solutions. Growth is particularly strong in the food and beverage sector, where smart packaging ensures product freshness and extends shelf life, reducing food waste and improving consumer satisfaction. The healthcare industry also represents a significant market segment, with smart packaging playing a crucial role in maintaining medication integrity and preventing counterfeiting. Competitive landscape analysis reveals key players like Stora Enso, BASF SE, and Amcor PLC are continuously innovating and expanding their product portfolios to capitalize on this growth opportunity. Geographical analysis indicates North America and Europe currently hold significant market shares, but the Asia-Pacific region is poised for substantial growth driven by increasing consumer spending and technological advancements.
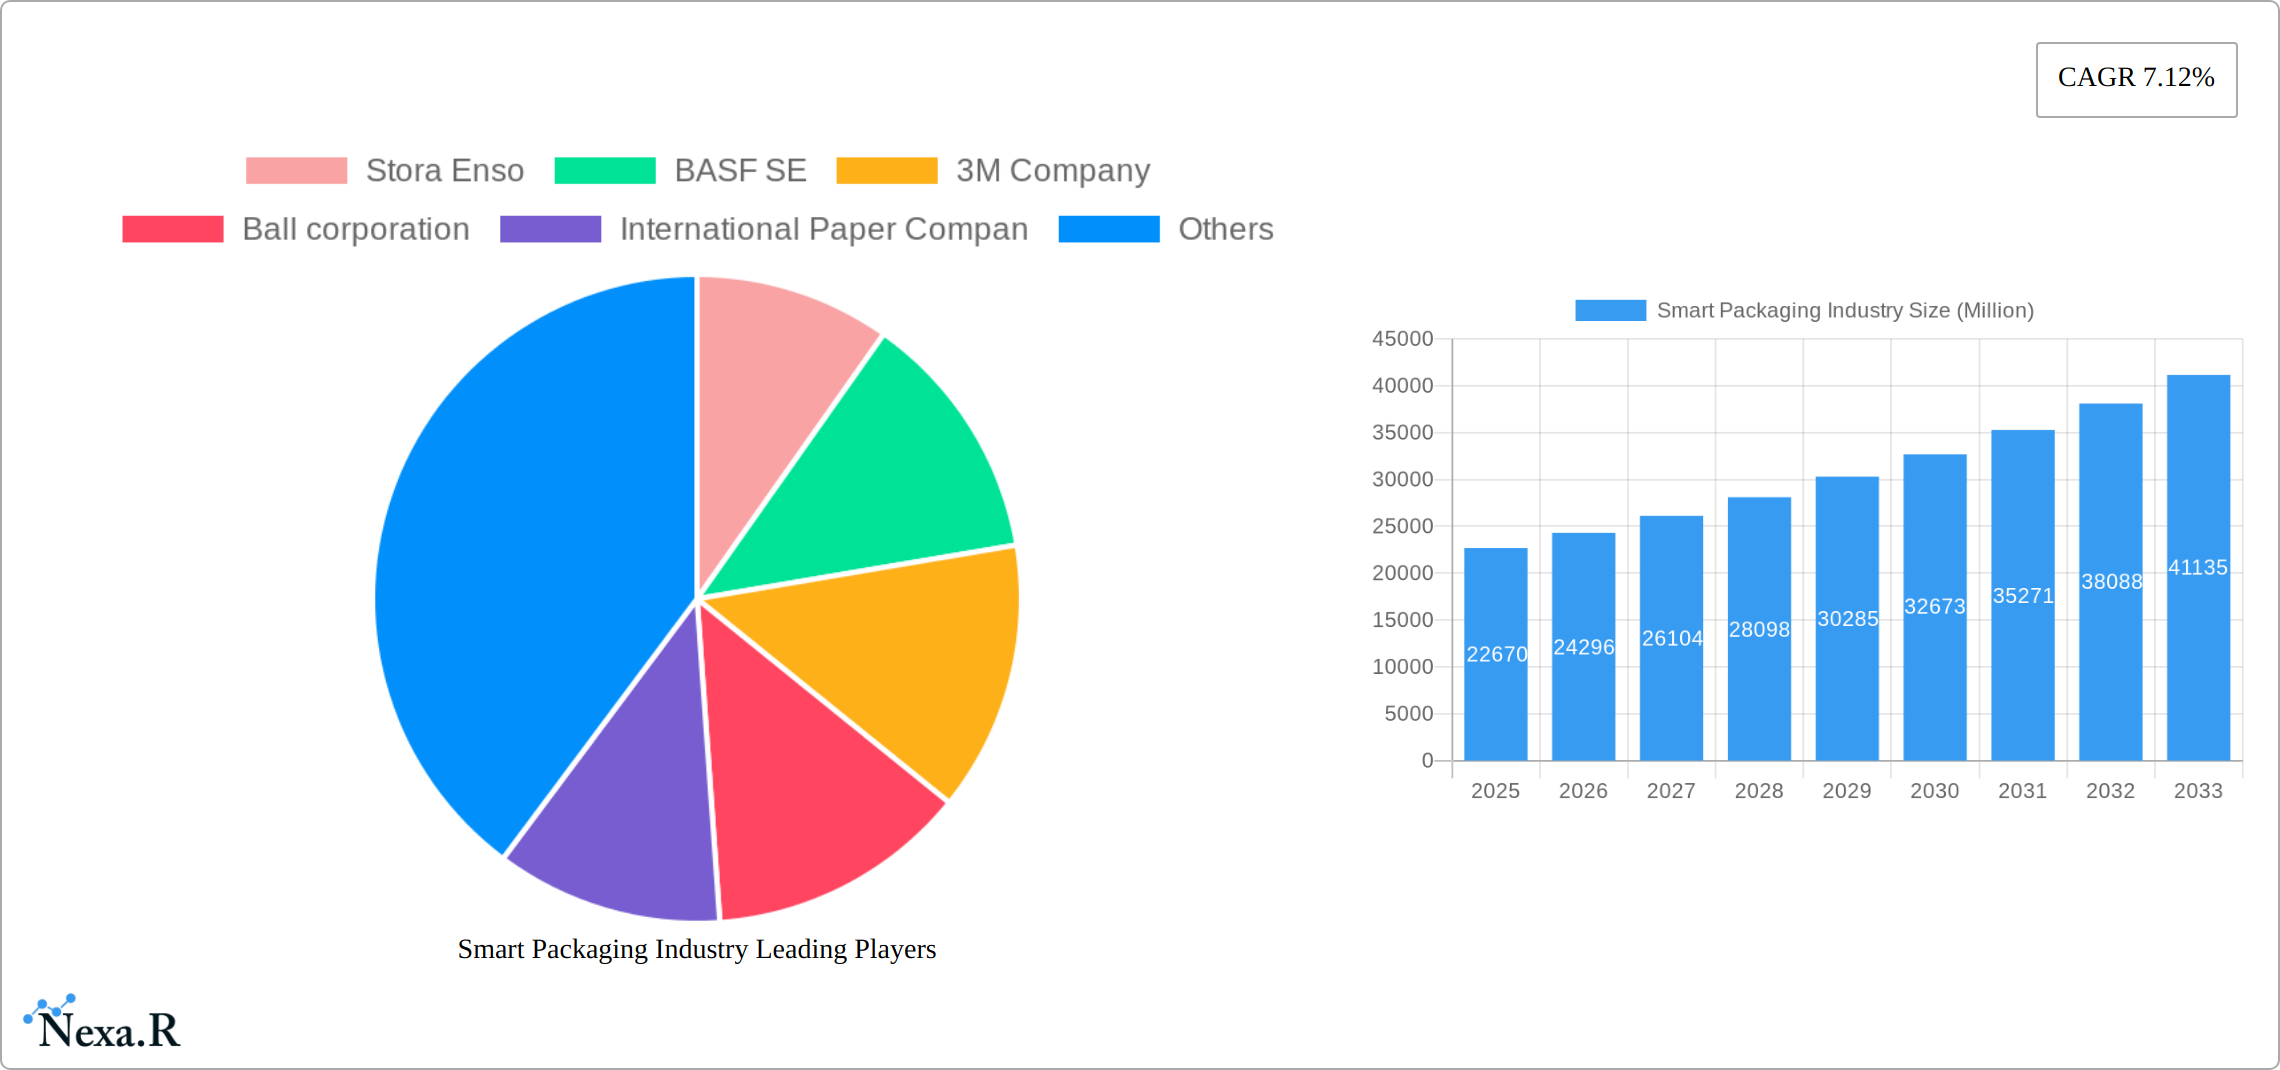
Smart Packaging Industry Market Size (In Billion)
The restraints on market growth primarily involve the relatively high initial investment costs associated with implementing smart packaging technologies, especially for smaller businesses. However, the long-term cost savings realized through reduced waste, improved supply chain visibility, and enhanced brand protection are expected to offset these initial expenses. Furthermore, concerns regarding data security and consumer privacy related to the integration of digital technologies into packaging need to be addressed through robust security protocols and transparent data handling practices. The continued development and refinement of more cost-effective and user-friendly smart packaging solutions will be key to unlocking the full market potential and ensuring widespread adoption across diverse industries and geographies. Future growth will likely see increased integration of advanced analytics and artificial intelligence to optimize supply chain processes and enhance consumer engagement.
Smart Packaging Industry Company Market Share
Smart Packaging Industry Market Report: 2019-2033
This comprehensive report provides a detailed analysis of the Smart Packaging market, encompassing market dynamics, growth trends, regional dominance, product landscape, key players, and future outlook. The study period spans 2019-2033, with 2025 serving as the base and estimated year. The forecast period is 2025-2033, and the historical period covers 2019-2024. The report segments the market by technology (Active Packaging, Intelligent Packaging) and end-user vertical (Food, Beverage, Healthcare, Personal Care, Other End-user Verticals), offering granular insights for informed decision-making. Market values are presented in million units.
Smart Packaging Industry Market Dynamics & Structure
The smart packaging market is characterized by a moderate level of concentration, with leading entities such as Amcor PLC, Avery Dennison Corporation, and Stora Enso collectively commanding a substantial market share. In 2025, this combined share is estimated to be around **[Insert Specific Percentage]%**. A significant catalyst for market growth is relentless technological innovation, spurred by advancements in areas like Radio-Frequency Identification (RFID), sophisticated sensors, and the burgeoning field of connected packaging. The industry is also shaped by robust regulatory frameworks, with a pronounced emphasis on environmental sustainability and stringent food safety standards influencing prevailing market trends. While competitive pressures from conventional packaging solutions persist, the escalating demand for enhanced product traceability, improved supply chain visibility, and superior consumer convenience is effectively mitigating these challenges. Mergers and acquisitions (M&A) continue to be a notable trend, with an estimated **[Insert Specific Number]** M&A deals recorded during the historical period from 2019 to 2024. Shifting end-user demographics, particularly the increasing preference for convenience, transparency, and interactive experiences among younger consumer cohorts, are actively molding product demand and innovation trajectories.
- Market Concentration: Moderately concentrated, with top players projected to hold approximately **[Insert Specific Percentage]%** of the market share by 2025.
- Technological Innovation: Key growth drivers include the widespread adoption and integration of RFID technology, advanced sensor capabilities, and the development of comprehensive connected packaging ecosystems.
- Regulatory Landscape: Stringent regulations prioritizing environmental sustainability, waste reduction, and uncompromising food safety standards are a defining aspect of the market.
- Competitive Substitutes: While traditional packaging materials present ongoing competition, the unique value propositions of smart packaging solutions are increasingly differentiating them.
- M&A Activity: The period between 2019 and 2024 saw a significant **[Insert Specific Number]** M&A deals, indicating consolidation and strategic expansion within the sector.
- Innovation Barriers: High research and development (R&D) expenditures and the complexities associated with integrating new technologies into existing supply chains represent notable barriers to innovation.
Smart Packaging Industry Growth Trends & Insights
The global smart packaging market is experiencing robust growth, driven by the rising adoption of smart technologies across various end-user verticals. The market size is projected to reach xx million units by 2033, exhibiting a Compound Annual Growth Rate (CAGR) of xx% during the forecast period (2025-2033). This growth is fueled by several factors, including increased consumer demand for product authenticity verification, improved supply chain visibility, and enhanced brand engagement. Technological advancements, such as the integration of Internet of Things (IoT) capabilities into packaging, are further accelerating market penetration. Shifts in consumer behavior towards environmentally sustainable and convenient packaging solutions are creating new growth opportunities.
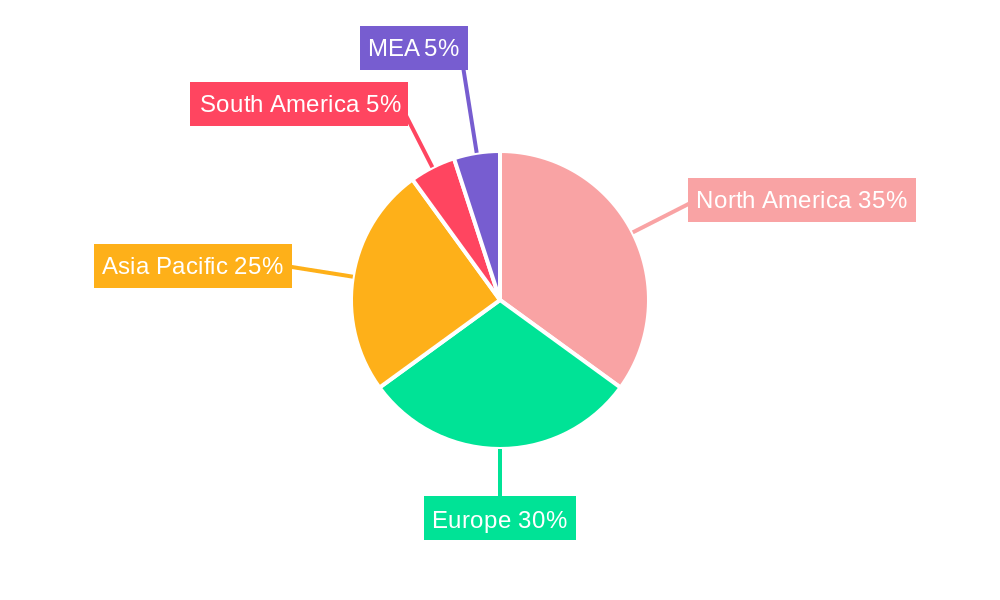
Dominant Regions, Countries, or Segments in Smart Packaging Industry
North America currently holds the largest market share in the smart packaging industry, driven by high consumer spending, technological advancements, and supportive regulatory frameworks. Within technology segments, Intelligent Packaging, particularly RFID-enabled solutions, holds a significant share due to its ability to provide comprehensive product traceability and real-time inventory management. In terms of end-user verticals, the Food and Beverage sector is the dominant segment, driven by the need for enhanced food safety and supply chain optimization.
- North America: Largest market share driven by high consumer spending and technological innovation.
- Intelligent Packaging: Leading technology segment due to traceability capabilities.
- Food & Beverage: Dominant end-user vertical driven by food safety and supply chain needs.
- Key Drivers: Strong consumer demand, technological advancements, supportive regulations, and increased government initiatives.
Smart Packaging Industry Product Landscape
The smart packaging market offers a diverse range of products, including active packaging with temperature-sensitive indicators, intelligent packaging with embedded sensors for real-time data capture, and connected packaging facilitating interactive experiences. These products enhance product quality, extend shelf life, and improve supply chain efficiency. Key innovations focus on sustainability, with biodegradable and compostable materials gaining traction. Unique selling propositions include enhanced traceability, brand protection, and improved consumer engagement.
Key Drivers, Barriers & Challenges in Smart Packaging Industry
Key Drivers:
- Rising consumer demand for product authenticity and transparency.
- Advancements in sensor and RFID technologies.
- Growing focus on sustainable packaging solutions.
- Increased need for supply chain visibility and efficiency.
Key Challenges:
- High initial investment costs for implementing smart packaging solutions.
- Lack of standardization across various smart packaging technologies.
- Concerns regarding data security and privacy.
- Potential for increased material costs associated with new technologies.
Emerging Opportunities in Smart Packaging Industry
Emerging opportunities lie in the development of innovative smart packaging solutions for emerging markets, with a focus on providing cost-effective and sustainable options. Further opportunities include integrating smart packaging with augmented reality (AR) and virtual reality (VR) technologies to enhance consumer engagement, and developing specialized smart packaging for temperature-sensitive pharmaceuticals and perishable goods. The increasing adoption of e-commerce also presents significant growth potential.
Growth Accelerators in the Smart Packaging Industry
The smart packaging industry is poised for accelerated growth in the forthcoming years, propelled by a confluence of strategic factors. Continuous advancements in core technologies, coupled with the formation of strategic alliances between prominent packaging manufacturers and innovative technology providers, are critical growth engines. Furthermore, the expansion into underserved and emerging markets, alongside the increasing adoption of eco-friendly and sustainable packaging materials, will significantly contribute to market expansion. The proactive support from government initiatives and regulatory bodies aimed at fostering the development and implementation of cutting-edge packaging solutions is also anticipated to play a pivotal role in driving market growth.
Key Players Shaping the Smart Packaging Industry Market
Notable Milestones in Smart Packaging Industry Sector
- January 2023: Avery Dennison significantly bolstered its RFID capabilities by announcing an investment exceeding USD 100 million to expand its RFID manufacturing infrastructure in Mexico, with the ambitious goal of becoming the world's largest RFID provider.
- March 2023: In a move towards enhanced sustainability, Amcor entered into a strategic partnership with Nfinite Nanotechnology Inc. to co-develop innovative recyclable and compostable nanocoated packaging solutions.
In-Depth Smart Packaging Industry Market Outlook
The smart packaging market presents a landscape brimming with substantial future potential. This optimism is largely fueled by the relentless evolution of technological capabilities and a progressively strong consumer and industry demand for packaging solutions that are not only intelligent and connected but also demonstrably sustainable and highly efficient. To effectively harness these emerging opportunities, companies will need to prioritize strategic partnerships, foster a culture of continuous product innovation, and actively pursue expansion into new and evolving markets. The overarching trend indicates continued robust growth, with intelligent packaging technologies at the forefront, poised to redefine the future of product protection, information dissemination, and consumer engagement.
Smart Packaging Industry Segmentation
-
1. Technology
- 1.1. Active Packaging
- 1.2. Intelligent Packaging
-
2. End-user Vertical
- 2.1. Food
- 2.2. Beverage
- 2.3. Healthcare
- 2.4. Personal Care
- 2.5. Other End-user Verticals
Smart Packaging Industry Segmentation By Geography
-
1. North America
- 1.1. United States
- 1.2. Canada
-
2. Europe
- 2.1. Germany
- 2.2. United Kingdom
- 2.3. France
- 2.4. Rest of Europe
-
3. Asia Pacific
- 3.1. China
- 3.2. Japan
- 3.3. India
- 3.4. Rest of Asia Pacific
- 4. Latin America
- 5. Middle East and Africa
Smart Packaging Industry Regional Market Share
Geographic Coverage of Smart Packaging Industry
Smart Packaging Industry REPORT HIGHLIGHTS
| Aspects | Details |
|---|---|
| Study Period | 2020-2034 |
| Base Year | 2025 |
| Estimated Year | 2026 |
| Forecast Period | 2026-2034 |
| Historical Period | 2020-2025 |
| Growth Rate | CAGR of 7.12% from 2020-2034 |
| Segmentation |
|
Table of Contents
- 1. Introduction
- 1.1. Research Scope
- 1.2. Market Segmentation
- 1.3. Research Objective
- 1.4. Definitions and Assumptions
- 2. Executive Summary
- 2.1. Market Snapshot
- 3. Market Dynamics
- 3.1. Market Drivers
- 3.2. Market Restrains
- 3.3. Market Trends
- 3.4. Market Opportunities
- 4. Market Factor Analysis
- 4.1. Porters Five Forces
- 4.1.1. Bargaining Power of Suppliers
- 4.1.2. Bargaining Power of Buyers
- 4.1.3. Threat of New Entrants
- 4.1.4. Threat of Substitutes
- 4.1.5. Competitive Rivalry
- 4.2. PESTEL analysis
- 4.3. BCG Analysis
- 4.3.1. Stars (High Growth, High Market Share)
- 4.3.2. Cash Cows (Low Growth, High Market Share)
- 4.3.3. Question Mark (High Growth, Low Market Share)
- 4.3.4. Dogs (Low Growth, Low Market Share)
- 4.4. Ansoff Matrix Analysis
- 4.5. Supply Chain Analysis
- 4.6. Regulatory Landscape
- 4.7. Current Market Potential and Opportunity Assessment (TAM–SAM–SOM Framework)
- 4.8. NRP Analyst Note
- 4.1. Porters Five Forces
- 5. Market Analysis, Insights and Forecast 2021-2033
- 5.1. Market Analysis, Insights and Forecast - by Technology
- 5.1.1. Active Packaging
- 5.1.2. Intelligent Packaging
- 5.2. Market Analysis, Insights and Forecast - by End-user Vertical
- 5.2.1. Food
- 5.2.2. Beverage
- 5.2.3. Healthcare
- 5.2.4. Personal Care
- 5.2.5. Other End-user Verticals
- 5.3. Market Analysis, Insights and Forecast - by Region
- 5.3.1. North America
- 5.3.2. Europe
- 5.3.3. Asia Pacific
- 5.3.4. Latin America
- 5.3.5. Middle East and Africa
- 5.1. Market Analysis, Insights and Forecast - by Technology
- 6. Global Smart Packaging Industry Analysis, Insights and Forecast, 2021-2033
- 6.1. Market Analysis, Insights and Forecast - by Technology
- 6.1.1. Active Packaging
- 6.1.2. Intelligent Packaging
- 6.2. Market Analysis, Insights and Forecast - by End-user Vertical
- 6.2.1. Food
- 6.2.2. Beverage
- 6.2.3. Healthcare
- 6.2.4. Personal Care
- 6.2.5. Other End-user Verticals
- 6.1. Market Analysis, Insights and Forecast - by Technology
- 7. North America Smart Packaging Industry Analysis, Insights and Forecast, 2020-2032
- 7.1. Market Analysis, Insights and Forecast - by Technology
- 7.1.1. Active Packaging
- 7.1.2. Intelligent Packaging
- 7.2. Market Analysis, Insights and Forecast - by End-user Vertical
- 7.2.1. Food
- 7.2.2. Beverage
- 7.2.3. Healthcare
- 7.2.4. Personal Care
- 7.2.5. Other End-user Verticals
- 7.1. Market Analysis, Insights and Forecast - by Technology
- 8. Europe Smart Packaging Industry Analysis, Insights and Forecast, 2020-2032
- 8.1. Market Analysis, Insights and Forecast - by Technology
- 8.1.1. Active Packaging
- 8.1.2. Intelligent Packaging
- 8.2. Market Analysis, Insights and Forecast - by End-user Vertical
- 8.2.1. Food
- 8.2.2. Beverage
- 8.2.3. Healthcare
- 8.2.4. Personal Care
- 8.2.5. Other End-user Verticals
- 8.1. Market Analysis, Insights and Forecast - by Technology
- 9. Asia Pacific Smart Packaging Industry Analysis, Insights and Forecast, 2020-2032
- 9.1. Market Analysis, Insights and Forecast - by Technology
- 9.1.1. Active Packaging
- 9.1.2. Intelligent Packaging
- 9.2. Market Analysis, Insights and Forecast - by End-user Vertical
- 9.2.1. Food
- 9.2.2. Beverage
- 9.2.3. Healthcare
- 9.2.4. Personal Care
- 9.2.5. Other End-user Verticals
- 9.1. Market Analysis, Insights and Forecast - by Technology
- 10. Latin America Smart Packaging Industry Analysis, Insights and Forecast, 2020-2032
- 10.1. Market Analysis, Insights and Forecast - by Technology
- 10.1.1. Active Packaging
- 10.1.2. Intelligent Packaging
- 10.2. Market Analysis, Insights and Forecast - by End-user Vertical
- 10.2.1. Food
- 10.2.2. Beverage
- 10.2.3. Healthcare
- 10.2.4. Personal Care
- 10.2.5. Other End-user Verticals
- 10.1. Market Analysis, Insights and Forecast - by Technology
- 11. Middle East and Africa Smart Packaging Industry Analysis, Insights and Forecast, 2020-2032
- 11.1. Market Analysis, Insights and Forecast - by Technology
- 11.1.1. Active Packaging
- 11.1.2. Intelligent Packaging
- 11.2. Market Analysis, Insights and Forecast - by End-user Vertical
- 11.2.1. Food
- 11.2.2. Beverage
- 11.2.3. Healthcare
- 11.2.4. Personal Care
- 11.2.5. Other End-user Verticals
- 11.1. Market Analysis, Insights and Forecast - by Technology
- 12. Competitive Analysis
- 12.1. Company Profiles
- 12.1.1 Stora Enso
- 12.1.1.1. Company Overview
- 12.1.1.2. Products
- 12.1.1.3. Company Financials
- 12.1.1.4. SWOT Analysis
- 12.1.2 BASF SE
- 12.1.2.1. Company Overview
- 12.1.2.2. Products
- 12.1.2.3. Company Financials
- 12.1.2.4. SWOT Analysis
- 12.1.3 3M Company
- 12.1.3.1. Company Overview
- 12.1.3.2. Products
- 12.1.3.3. Company Financials
- 12.1.3.4. SWOT Analysis
- 12.1.4 Ball corporation
- 12.1.4.1. Company Overview
- 12.1.4.2. Products
- 12.1.4.3. Company Financials
- 12.1.4.4. SWOT Analysis
- 12.1.5 International Paper Compan
- 12.1.5.1. Company Overview
- 12.1.5.2. Products
- 12.1.5.3. Company Financials
- 12.1.5.4. SWOT Analysis
- 12.1.6 Amcor PLC
- 12.1.6.1. Company Overview
- 12.1.6.2. Products
- 12.1.6.3. Company Financials
- 12.1.6.4. SWOT Analysis
- 12.1.7 Avery Dennison Corporation
- 12.1.7.1. Company Overview
- 12.1.7.2. Products
- 12.1.7.3. Company Financials
- 12.1.7.4. SWOT Analysis
- 12.1.8 Huhtamaki OYJ
- 12.1.8.1. Company Overview
- 12.1.8.2. Products
- 12.1.8.3. Company Financials
- 12.1.8.4. SWOT Analysis
- 12.1.9 Zebra Technologies Corporation
- 12.1.9.1. Company Overview
- 12.1.9.2. Products
- 12.1.9.3. Company Financials
- 12.1.9.4. SWOT Analysis
- 12.1.10 Sealed Air Corporation
- 12.1.10.1. Company Overview
- 12.1.10.2. Products
- 12.1.10.3. Company Financials
- 12.1.10.4. SWOT Analysis
- 12.1.1 Stora Enso
- 12.2. Market Entropy
- 12.2.1 Company's Key Areas Served
- 12.2.2 Recent Developments
- 12.3. Company Market Share Analysis 2025
- 12.3.1 Top 5 Companies Market Share Analysis
- 12.3.2 Top 3 Companies Market Share Analysis
- 12.4. List of Potential Customers
- 13. Research Methodology
List of Figures
- Figure 1: Global Smart Packaging Industry Revenue Breakdown (Million, %) by Region 2025 & 2033
- Figure 2: North America Smart Packaging Industry Revenue (Million), by Technology 2025 & 2033
- Figure 3: North America Smart Packaging Industry Revenue Share (%), by Technology 2025 & 2033
- Figure 4: North America Smart Packaging Industry Revenue (Million), by End-user Vertical 2025 & 2033
- Figure 5: North America Smart Packaging Industry Revenue Share (%), by End-user Vertical 2025 & 2033
- Figure 6: North America Smart Packaging Industry Revenue (Million), by Country 2025 & 2033
- Figure 7: North America Smart Packaging Industry Revenue Share (%), by Country 2025 & 2033
- Figure 8: Europe Smart Packaging Industry Revenue (Million), by Technology 2025 & 2033
- Figure 9: Europe Smart Packaging Industry Revenue Share (%), by Technology 2025 & 2033
- Figure 10: Europe Smart Packaging Industry Revenue (Million), by End-user Vertical 2025 & 2033
- Figure 11: Europe Smart Packaging Industry Revenue Share (%), by End-user Vertical 2025 & 2033
- Figure 12: Europe Smart Packaging Industry Revenue (Million), by Country 2025 & 2033
- Figure 13: Europe Smart Packaging Industry Revenue Share (%), by Country 2025 & 2033
- Figure 14: Asia Pacific Smart Packaging Industry Revenue (Million), by Technology 2025 & 2033
- Figure 15: Asia Pacific Smart Packaging Industry Revenue Share (%), by Technology 2025 & 2033
- Figure 16: Asia Pacific Smart Packaging Industry Revenue (Million), by End-user Vertical 2025 & 2033
- Figure 17: Asia Pacific Smart Packaging Industry Revenue Share (%), by End-user Vertical 2025 & 2033
- Figure 18: Asia Pacific Smart Packaging Industry Revenue (Million), by Country 2025 & 2033
- Figure 19: Asia Pacific Smart Packaging Industry Revenue Share (%), by Country 2025 & 2033
- Figure 20: Latin America Smart Packaging Industry Revenue (Million), by Technology 2025 & 2033
- Figure 21: Latin America Smart Packaging Industry Revenue Share (%), by Technology 2025 & 2033
- Figure 22: Latin America Smart Packaging Industry Revenue (Million), by End-user Vertical 2025 & 2033
- Figure 23: Latin America Smart Packaging Industry Revenue Share (%), by End-user Vertical 2025 & 2033
- Figure 24: Latin America Smart Packaging Industry Revenue (Million), by Country 2025 & 2033
- Figure 25: Latin America Smart Packaging Industry Revenue Share (%), by Country 2025 & 2033
- Figure 26: Middle East and Africa Smart Packaging Industry Revenue (Million), by Technology 2025 & 2033
- Figure 27: Middle East and Africa Smart Packaging Industry Revenue Share (%), by Technology 2025 & 2033
- Figure 28: Middle East and Africa Smart Packaging Industry Revenue (Million), by End-user Vertical 2025 & 2033
- Figure 29: Middle East and Africa Smart Packaging Industry Revenue Share (%), by End-user Vertical 2025 & 2033
- Figure 30: Middle East and Africa Smart Packaging Industry Revenue (Million), by Country 2025 & 2033
- Figure 31: Middle East and Africa Smart Packaging Industry Revenue Share (%), by Country 2025 & 2033
List of Tables
- Table 1: Global Smart Packaging Industry Revenue Million Forecast, by Technology 2020 & 2033
- Table 2: Global Smart Packaging Industry Revenue Million Forecast, by End-user Vertical 2020 & 2033
- Table 3: Global Smart Packaging Industry Revenue Million Forecast, by Region 2020 & 2033
- Table 4: Global Smart Packaging Industry Revenue Million Forecast, by Technology 2020 & 2033
- Table 5: Global Smart Packaging Industry Revenue Million Forecast, by End-user Vertical 2020 & 2033
- Table 6: Global Smart Packaging Industry Revenue Million Forecast, by Country 2020 & 2033
- Table 7: United States Smart Packaging Industry Revenue (Million) Forecast, by Application 2020 & 2033
- Table 8: Canada Smart Packaging Industry Revenue (Million) Forecast, by Application 2020 & 2033
- Table 9: Global Smart Packaging Industry Revenue Million Forecast, by Technology 2020 & 2033
- Table 10: Global Smart Packaging Industry Revenue Million Forecast, by End-user Vertical 2020 & 2033
- Table 11: Global Smart Packaging Industry Revenue Million Forecast, by Country 2020 & 2033
- Table 12: Germany Smart Packaging Industry Revenue (Million) Forecast, by Application 2020 & 2033
- Table 13: United Kingdom Smart Packaging Industry Revenue (Million) Forecast, by Application 2020 & 2033
- Table 14: France Smart Packaging Industry Revenue (Million) Forecast, by Application 2020 & 2033
- Table 15: Rest of Europe Smart Packaging Industry Revenue (Million) Forecast, by Application 2020 & 2033
- Table 16: Global Smart Packaging Industry Revenue Million Forecast, by Technology 2020 & 2033
- Table 17: Global Smart Packaging Industry Revenue Million Forecast, by End-user Vertical 2020 & 2033
- Table 18: Global Smart Packaging Industry Revenue Million Forecast, by Country 2020 & 2033
- Table 19: China Smart Packaging Industry Revenue (Million) Forecast, by Application 2020 & 2033
- Table 20: Japan Smart Packaging Industry Revenue (Million) Forecast, by Application 2020 & 2033
- Table 21: India Smart Packaging Industry Revenue (Million) Forecast, by Application 2020 & 2033
- Table 22: Rest of Asia Pacific Smart Packaging Industry Revenue (Million) Forecast, by Application 2020 & 2033
- Table 23: Global Smart Packaging Industry Revenue Million Forecast, by Technology 2020 & 2033
- Table 24: Global Smart Packaging Industry Revenue Million Forecast, by End-user Vertical 2020 & 2033
- Table 25: Global Smart Packaging Industry Revenue Million Forecast, by Country 2020 & 2033
- Table 26: Global Smart Packaging Industry Revenue Million Forecast, by Technology 2020 & 2033
- Table 27: Global Smart Packaging Industry Revenue Million Forecast, by End-user Vertical 2020 & 2033
- Table 28: Global Smart Packaging Industry Revenue Million Forecast, by Country 2020 & 2033
Frequently Asked Questions
1. What is the projected Compound Annual Growth Rate (CAGR) of the Smart Packaging Industry?
The projected CAGR is approximately 7.12%.
2. Which companies are prominent players in the Smart Packaging Industry?
Key companies in the market include Stora Enso, BASF SE, 3M Company, Ball corporation, International Paper Compan, Amcor PLC, Avery Dennison Corporation, Huhtamaki OYJ, Zebra Technologies Corporation, Sealed Air Corporation.
3. What are the main segments of the Smart Packaging Industry?
The market segments include Technology, End-user Vertical.
4. Can you provide details about the market size?
The market size is estimated to be USD 22.67 Million as of 2022.
5. What are some drivers contributing to market growth?
Advancement in Technology in Food Packaging for Quality Inspection; Rising Awareness Regarding Food Safety; Development in the Printing Industry Due to Various Applications of Smart Packaging.
6. What are the notable trends driving market growth?
Active Packaging to Hold Major Share in the Market.
7. Are there any restraints impacting market growth?
High Costs Due to Initial Requirement.
8. Can you provide examples of recent developments in the market?
March 2023: Amcor, a company that creates and manufactures environment-friendly packaging solutions, announced a joint research project agreement with NfiniteNanotechnology Inc. to validate the application of Nfinite's nanocoating technology to improve packaging that can be recycled and composted.
9. What pricing options are available for accessing the report?
Pricing options include single-user, multi-user, and enterprise licenses priced at USD 4750, USD 5250, and USD 8750 respectively.
10. Is the market size provided in terms of value or volume?
The market size is provided in terms of value, measured in Million.
11. Are there any specific market keywords associated with the report?
Yes, the market keyword associated with the report is "Smart Packaging Industry," which aids in identifying and referencing the specific market segment covered.
12. How do I determine which pricing option suits my needs best?
The pricing options vary based on user requirements and access needs. Individual users may opt for single-user licenses, while businesses requiring broader access may choose multi-user or enterprise licenses for cost-effective access to the report.
13. Are there any additional resources or data provided in the Smart Packaging Industry report?
While the report offers comprehensive insights, it's advisable to review the specific contents or supplementary materials provided to ascertain if additional resources or data are available.
14. How can I stay updated on further developments or reports in the Smart Packaging Industry?
To stay informed about further developments, trends, and reports in the Smart Packaging Industry, consider subscribing to industry newsletters, following relevant companies and organizations, or regularly checking reputable industry news sources and publications.
Methodology
Step 1 - Identification of Relevant Samples Size from Population Database


Step 2 - Approaches for Defining Global Market Size (Value, Volume* & Price*)

Note*: In applicable scenarios
Step 3 - Data Sources
Primary Research
- Web Analytics
- Survey Reports
- Research Institute
- Latest Research Reports
- Opinion Leaders
Secondary Research
- Annual Reports
- White Paper
- Latest Press Release
- Industry Association
- Paid Database
- Investor Presentations

Step 4 - Data Triangulation
Involves using different sources of information in order to increase the validity of a study
These sources are likely to be stakeholders in a program - participants, other researchers, program staff, other community members, and so on.
Then we put all data in single framework & apply various statistical tools to find out the dynamic on the market.
During the analysis stage, feedback from the stakeholder groups would be compared to determine areas of agreement as well as areas of divergence