

Key Insights
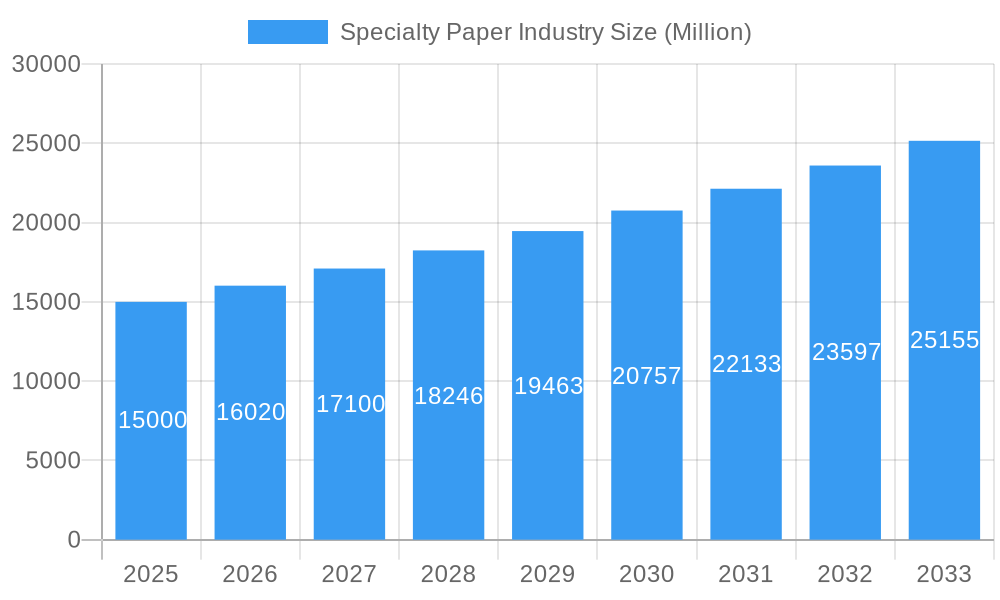
The global specialty paper market, estimated at $18 billion in 2025, is projected for significant expansion with a compound annual growth rate (CAGR) of 5.1% through 2033. Key growth drivers include the escalating demand for sustainable packaging solutions across food service, printing & publication, and building & construction sectors. The rising preference for eco-friendly kraft paper and its expanding applications in lamination and retail bags further stimulate market growth. Technological advancements enhancing paper durability and printability also play a crucial role. The burgeoning e-commerce sector's demand for packaging materials also bolsters specialty paper consumption. While North America and Europe currently dominate market share, Asia Pacific is set for substantial growth due to its expanding industrial base and increasing consumer spending. Potential restraints include raw material price volatility and stringent environmental regulations.
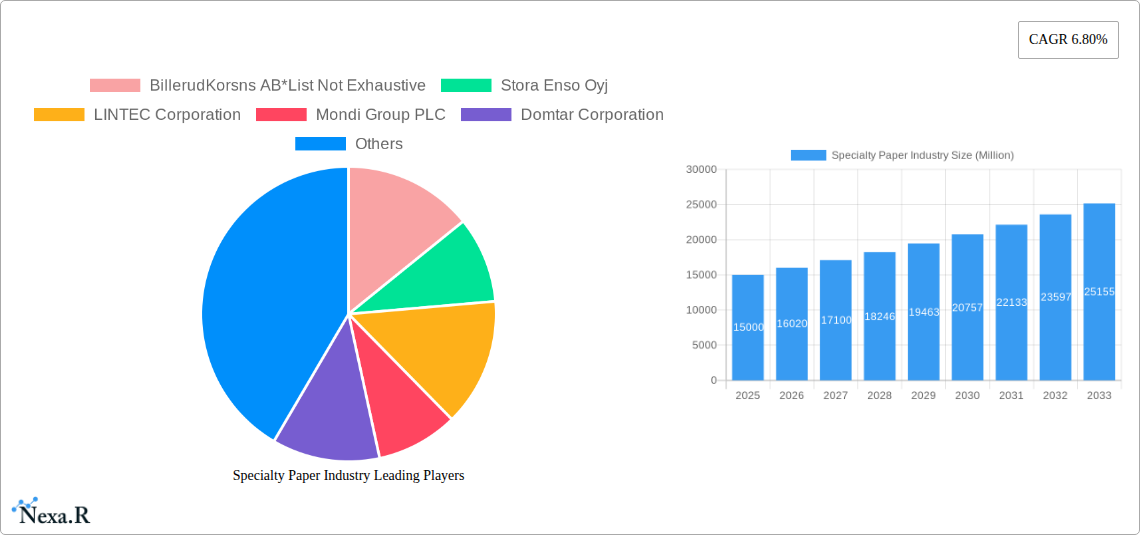
Specialty Paper Industry Market Size (In Billion)
The specialty paper market is segmented by product type, with kraft paper leading due to its sustainability and versatility, followed by container board and label paper. Silicon-based paper serves niche high-performance applications. End-user industries are led by packaging & labeling, with significant contributions from food service and printing & publication. Leading companies like BillerudKorsnäs AB, Stora Enso Oyj, and Mondi Group PLC are actively investing in R&D to enhance product offerings and expand market reach. The competitive landscape features established and emerging players focused on innovation to meet evolving market demands, driving continued growth and advancement in the specialty paper industry.
Specialty Paper Industry Company Market Share
Specialty Paper Industry Market Report: 2019-2033
This comprehensive report provides an in-depth analysis of the global specialty paper industry, offering invaluable insights for industry professionals, investors, and strategic decision-makers. Covering the period 2019-2033, with a focus on 2025, this report analyzes market dynamics, growth trends, key players, and emerging opportunities within the parent market of paper and the child market of specialty paper. The report utilizes data in Million units.
Specialty Paper Industry Market Dynamics & Structure
The specialty paper market is characterized by moderate concentration, with several key players holding significant market share. The industry is driven by technological innovation, particularly in sustainable and high-performance materials. Stringent environmental regulations are shaping production methods and material choices. Competitive pressures from substitute materials, like plastics, necessitate continuous innovation. End-user demographics, particularly in packaging and labeling, significantly influence market demand. Mergers and acquisitions (M&A) activity is moderate, with strategic alliances aimed at expanding product portfolios and geographic reach.
- Market Concentration: The top five players hold approximately xx% of the global market share in 2025.
- Technological Innovation: Focus on sustainable materials (e.g., recycled fibers, bio-based coatings) and enhanced functionality (e.g., improved barrier properties, water resistance).
- Regulatory Framework: Compliance with environmental regulations (e.g., reduced carbon emissions, waste management) is a significant cost factor.
- Competitive Substitutes: Plastics and other alternative packaging materials pose a significant threat.
- End-User Demographics: Growth in e-commerce and food delivery services fuels demand for packaging and labeling materials.
- M&A Trends: XX major M&A deals were recorded between 2019 and 2024, primarily focused on expanding geographical presence and product lines.
Specialty Paper Industry Growth Trends & Insights
The global specialty paper market is projected to experience steady growth during the forecast period (2025-2033). Market size is expected to reach xx Million units by 2033, driven by increasing demand across various end-use segments. Adoption rates for sustainable specialty papers are increasing due to growing environmental awareness. Technological disruptions, such as the development of advanced coating technologies and improved printing techniques, are driving product innovation and market expansion. Consumer behavior shifts towards eco-friendly and functional packaging solutions further fuel market growth. The CAGR from 2025 to 2033 is estimated at xx%. Market penetration for sustainable specialty papers is expected to reach xx% by 2033.
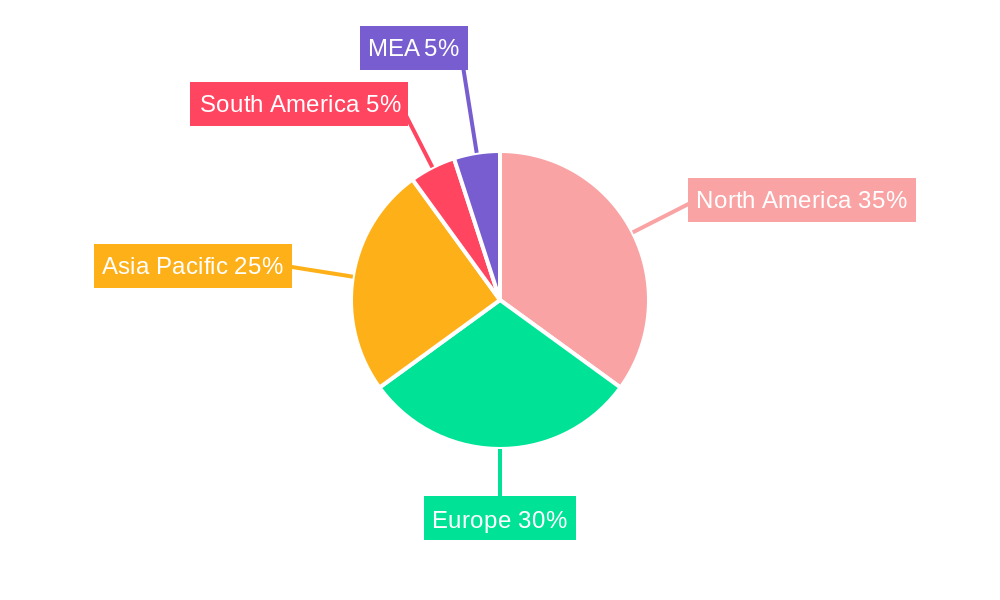
Dominant Regions, Countries, or Segments in Specialty Paper Industry
North America and Europe currently dominate the specialty paper market, driven by strong demand from packaging, printing, and food service sectors. Within these regions, specific countries like the US, Germany, and the UK are key players. The Packaging & Labeling segment is the largest end-user industry, followed by Food Service and Printing & Publication. Growth is driven by:
North America: Strong economic growth, advanced packaging technology, and increasing demand for sustainable packaging.
Europe: High disposable incomes, sophisticated printing industry, and strict environmental regulations driving adoption of eco-friendly products.
Asia-Pacific: Rapid economic development and increasing industrialization are boosting demand, although market penetration of specialty papers still lags behind developed regions.
By End-user Industry: Packaging & Labeling holds the largest market share (xx%), exhibiting robust growth driven by e-commerce expansion.
By Type: Kraft Paper and Container Board/Paper Board are the leading segments due to their wide applications in packaging.
Specialty Paper Industry Product Landscape
The specialty paper market offers a diverse range of products catering to specific end-user needs. Innovations include functional coatings for improved barrier properties, water resistance, and printability. Technological advancements in papermaking processes enhance product quality, efficiency, and sustainability. Unique selling propositions include eco-friendly certifications, superior performance characteristics, and customized solutions to meet individual requirements.
Key Drivers, Barriers & Challenges in Specialty Paper Industry
Key Drivers: Growing demand for sustainable packaging solutions, increasing investments in R&D for new materials and technologies, and expanding application areas (e.g., advanced electronics, medical devices).
Key Challenges: Fluctuating raw material prices, intense competition from substitute materials, and stringent environmental regulations that impose higher production costs. Supply chain disruptions can impact production volumes and lead times with xx% reduction in production recorded in 2023 due to supply chain issues.
Emerging Opportunities in Specialty Paper Industry
Emerging opportunities include the growing demand for sustainable and biodegradable packaging solutions, the expansion into new applications like medical and electronic packaging, and the development of smart packaging with integrated technologies (e.g., sensors, RFID tags). Untapped markets in developing economies represent significant growth potential.
Growth Accelerators in the Specialty Paper Industry
Technological advancements such as enhanced coatings and sustainable manufacturing processes are major catalysts for growth. Strategic partnerships for joint ventures and increased R&D investments drive innovation and broader market reach.
Key Players Shaping the Specialty Paper Industry Market
- BillerudKorsnäs AB
- Stora Enso Oyj
- LINTEC Corporation
- Mondi Group PLC
- Domtar Corporation
- Sappi Limited
- Nippon Paper Industries Co Ltd
- ITC Limited
- Twin Rivers Paper Company
- Nordic Paper AS
Notable Milestones in Specialty Paper Industry Sector
- November 2022: Sappi North America invested USD 418 million in paper machine rebuilds, focusing on sustainable packaging alternatives.
- September 2022: Sappi Europe invested a double-digit million-euro sum to expand wet-strength label paper production.
In-Depth Specialty Paper Industry Market Outlook
The specialty paper market is poised for continued growth, driven by innovation, sustainability, and expanding applications. Strategic partnerships, technological breakthroughs, and market expansion into emerging economies offer significant future opportunities. The focus on sustainable and high-performance materials will shape industry development in the coming years.
Specialty Paper Industry Segmentation
-
1. Type
- 1.1. Kraft Paper
- 1.2. Container Board/Paper Board
- 1.3. Label Paper
- 1.4. Silicon-based Paper
- 1.5. Others
-
2. End-user Industry
- 2.1. Packaging & Labelling
- 2.2. Food Service
- 2.3. Printing & Publication
- 2.4. Building & Construction
- 2.5. Other En
Specialty Paper Industry Segmentation By Geography
-
1. North America
- 1.1. United States
- 1.2. Canada
-
2. Europe
- 2.1. Germany
- 2.2. United Kingdom
- 2.3. France
- 2.4. Rest of Europe
-
3. Asia Pacific
- 3.1. China
- 3.2. India
- 3.3. Japan
- 3.4. Rest of Asia Pacific
-
4. Latin America
- 4.1. Brazil
- 4.2. Mexico
- 4.3. Rest of Latin America
- 5. Middle East and Africa
Specialty Paper Industry Regional Market Share
Geographic Coverage of Specialty Paper Industry
Specialty Paper Industry REPORT HIGHLIGHTS
| Aspects | Details |
|---|---|
| Study Period | 2020-2034 |
| Base Year | 2025 |
| Estimated Year | 2026 |
| Forecast Period | 2026-2034 |
| Historical Period | 2020-2025 |
| Growth Rate | CAGR of 5.1% from 2020-2034 |
| Segmentation |
|
Table of Contents
- 1. Introduction
- 1.1. Research Scope
- 1.2. Market Segmentation
- 1.3. Research Objective
- 1.4. Definitions and Assumptions
- 2. Executive Summary
- 2.1. Market Snapshot
- 3. Market Dynamics
- 3.1. Market Drivers
- 3.2. Market Restrains
- 3.3. Market Trends
- 3.4. Market Opportunities
- 4. Market Factor Analysis
- 4.1. Porters Five Forces
- 4.1.1. Bargaining Power of Suppliers
- 4.1.2. Bargaining Power of Buyers
- 4.1.3. Threat of New Entrants
- 4.1.4. Threat of Substitutes
- 4.1.5. Competitive Rivalry
- 4.2. PESTEL analysis
- 4.3. BCG Analysis
- 4.3.1. Stars (High Growth, High Market Share)
- 4.3.2. Cash Cows (Low Growth, High Market Share)
- 4.3.3. Question Mark (High Growth, Low Market Share)
- 4.3.4. Dogs (Low Growth, Low Market Share)
- 4.4. Ansoff Matrix Analysis
- 4.5. Supply Chain Analysis
- 4.6. Regulatory Landscape
- 4.7. Current Market Potential and Opportunity Assessment (TAM–SAM–SOM Framework)
- 4.8. NRP Analyst Note
- 4.1. Porters Five Forces
- 5. Market Analysis, Insights and Forecast 2021-2033
- 5.1. Market Analysis, Insights and Forecast - by Type
- 5.1.1. Kraft Paper
- 5.1.2. Container Board/Paper Board
- 5.1.3. Label Paper
- 5.1.4. Silicon-based Paper
- 5.1.5. Others
- 5.2. Market Analysis, Insights and Forecast - by End-user Industry
- 5.2.1. Packaging & Labelling
- 5.2.2. Food Service
- 5.2.3. Printing & Publication
- 5.2.4. Building & Construction
- 5.2.5. Other En
- 5.3. Market Analysis, Insights and Forecast - by Region
- 5.3.1. North America
- 5.3.2. Europe
- 5.3.3. Asia Pacific
- 5.3.4. Latin America
- 5.3.5. Middle East and Africa
- 5.1. Market Analysis, Insights and Forecast - by Type
- 6. Global Specialty Paper Industry Analysis, Insights and Forecast, 2021-2033
- 6.1. Market Analysis, Insights and Forecast - by Type
- 6.1.1. Kraft Paper
- 6.1.2. Container Board/Paper Board
- 6.1.3. Label Paper
- 6.1.4. Silicon-based Paper
- 6.1.5. Others
- 6.2. Market Analysis, Insights and Forecast - by End-user Industry
- 6.2.1. Packaging & Labelling
- 6.2.2. Food Service
- 6.2.3. Printing & Publication
- 6.2.4. Building & Construction
- 6.2.5. Other En
- 6.1. Market Analysis, Insights and Forecast - by Type
- 7. North America Specialty Paper Industry Analysis, Insights and Forecast, 2020-2032
- 7.1. Market Analysis, Insights and Forecast - by Type
- 7.1.1. Kraft Paper
- 7.1.2. Container Board/Paper Board
- 7.1.3. Label Paper
- 7.1.4. Silicon-based Paper
- 7.1.5. Others
- 7.2. Market Analysis, Insights and Forecast - by End-user Industry
- 7.2.1. Packaging & Labelling
- 7.2.2. Food Service
- 7.2.3. Printing & Publication
- 7.2.4. Building & Construction
- 7.2.5. Other En
- 7.1. Market Analysis, Insights and Forecast - by Type
- 8. Europe Specialty Paper Industry Analysis, Insights and Forecast, 2020-2032
- 8.1. Market Analysis, Insights and Forecast - by Type
- 8.1.1. Kraft Paper
- 8.1.2. Container Board/Paper Board
- 8.1.3. Label Paper
- 8.1.4. Silicon-based Paper
- 8.1.5. Others
- 8.2. Market Analysis, Insights and Forecast - by End-user Industry
- 8.2.1. Packaging & Labelling
- 8.2.2. Food Service
- 8.2.3. Printing & Publication
- 8.2.4. Building & Construction
- 8.2.5. Other En
- 8.1. Market Analysis, Insights and Forecast - by Type
- 9. Asia Pacific Specialty Paper Industry Analysis, Insights and Forecast, 2020-2032
- 9.1. Market Analysis, Insights and Forecast - by Type
- 9.1.1. Kraft Paper
- 9.1.2. Container Board/Paper Board
- 9.1.3. Label Paper
- 9.1.4. Silicon-based Paper
- 9.1.5. Others
- 9.2. Market Analysis, Insights and Forecast - by End-user Industry
- 9.2.1. Packaging & Labelling
- 9.2.2. Food Service
- 9.2.3. Printing & Publication
- 9.2.4. Building & Construction
- 9.2.5. Other En
- 9.1. Market Analysis, Insights and Forecast - by Type
- 10. Latin America Specialty Paper Industry Analysis, Insights and Forecast, 2020-2032
- 10.1. Market Analysis, Insights and Forecast - by Type
- 10.1.1. Kraft Paper
- 10.1.2. Container Board/Paper Board
- 10.1.3. Label Paper
- 10.1.4. Silicon-based Paper
- 10.1.5. Others
- 10.2. Market Analysis, Insights and Forecast - by End-user Industry
- 10.2.1. Packaging & Labelling
- 10.2.2. Food Service
- 10.2.3. Printing & Publication
- 10.2.4. Building & Construction
- 10.2.5. Other En
- 10.1. Market Analysis, Insights and Forecast - by Type
- 11. Middle East and Africa Specialty Paper Industry Analysis, Insights and Forecast, 2020-2032
- 11.1. Market Analysis, Insights and Forecast - by Type
- 11.1.1. Kraft Paper
- 11.1.2. Container Board/Paper Board
- 11.1.3. Label Paper
- 11.1.4. Silicon-based Paper
- 11.1.5. Others
- 11.2. Market Analysis, Insights and Forecast - by End-user Industry
- 11.2.1. Packaging & Labelling
- 11.2.2. Food Service
- 11.2.3. Printing & Publication
- 11.2.4. Building & Construction
- 11.2.5. Other En
- 11.1. Market Analysis, Insights and Forecast - by Type
- 12. Competitive Analysis
- 12.1. Company Profiles
- 12.1.1 BillerudKorsns AB*List Not Exhaustive
- 12.1.1.1. Company Overview
- 12.1.1.2. Products
- 12.1.1.3. Company Financials
- 12.1.1.4. SWOT Analysis
- 12.1.2 Stora Enso Oyj
- 12.1.2.1. Company Overview
- 12.1.2.2. Products
- 12.1.2.3. Company Financials
- 12.1.2.4. SWOT Analysis
- 12.1.3 LINTEC Corporation
- 12.1.3.1. Company Overview
- 12.1.3.2. Products
- 12.1.3.3. Company Financials
- 12.1.3.4. SWOT Analysis
- 12.1.4 Mondi Group PLC
- 12.1.4.1. Company Overview
- 12.1.4.2. Products
- 12.1.4.3. Company Financials
- 12.1.4.4. SWOT Analysis
- 12.1.5 Domtar Corporation
- 12.1.5.1. Company Overview
- 12.1.5.2. Products
- 12.1.5.3. Company Financials
- 12.1.5.4. SWOT Analysis
- 12.1.6 Sappi Limited
- 12.1.6.1. Company Overview
- 12.1.6.2. Products
- 12.1.6.3. Company Financials
- 12.1.6.4. SWOT Analysis
- 12.1.7 Nippon Paper Industries Co Ltd
- 12.1.7.1. Company Overview
- 12.1.7.2. Products
- 12.1.7.3. Company Financials
- 12.1.7.4. SWOT Analysis
- 12.1.8 ITC Limited
- 12.1.8.1. Company Overview
- 12.1.8.2. Products
- 12.1.8.3. Company Financials
- 12.1.8.4. SWOT Analysis
- 12.1.9 Twin Rivers Paper Company
- 12.1.9.1. Company Overview
- 12.1.9.2. Products
- 12.1.9.3. Company Financials
- 12.1.9.4. SWOT Analysis
- 12.1.10 Nordic Paper AS
- 12.1.10.1. Company Overview
- 12.1.10.2. Products
- 12.1.10.3. Company Financials
- 12.1.10.4. SWOT Analysis
- 12.1.1 BillerudKorsns AB*List Not Exhaustive
- 12.2. Market Entropy
- 12.2.1 Company's Key Areas Served
- 12.2.2 Recent Developments
- 12.3. Company Market Share Analysis 2025
- 12.3.1 Top 5 Companies Market Share Analysis
- 12.3.2 Top 3 Companies Market Share Analysis
- 12.4. List of Potential Customers
- 13. Research Methodology
List of Figures
- Figure 1: Global Specialty Paper Industry Revenue Breakdown (billion, %) by Region 2025 & 2033
- Figure 2: North America Specialty Paper Industry Revenue (billion), by Type 2025 & 2033
- Figure 3: North America Specialty Paper Industry Revenue Share (%), by Type 2025 & 2033
- Figure 4: North America Specialty Paper Industry Revenue (billion), by End-user Industry 2025 & 2033
- Figure 5: North America Specialty Paper Industry Revenue Share (%), by End-user Industry 2025 & 2033
- Figure 6: North America Specialty Paper Industry Revenue (billion), by Country 2025 & 2033
- Figure 7: North America Specialty Paper Industry Revenue Share (%), by Country 2025 & 2033
- Figure 8: Europe Specialty Paper Industry Revenue (billion), by Type 2025 & 2033
- Figure 9: Europe Specialty Paper Industry Revenue Share (%), by Type 2025 & 2033
- Figure 10: Europe Specialty Paper Industry Revenue (billion), by End-user Industry 2025 & 2033
- Figure 11: Europe Specialty Paper Industry Revenue Share (%), by End-user Industry 2025 & 2033
- Figure 12: Europe Specialty Paper Industry Revenue (billion), by Country 2025 & 2033
- Figure 13: Europe Specialty Paper Industry Revenue Share (%), by Country 2025 & 2033
- Figure 14: Asia Pacific Specialty Paper Industry Revenue (billion), by Type 2025 & 2033
- Figure 15: Asia Pacific Specialty Paper Industry Revenue Share (%), by Type 2025 & 2033
- Figure 16: Asia Pacific Specialty Paper Industry Revenue (billion), by End-user Industry 2025 & 2033
- Figure 17: Asia Pacific Specialty Paper Industry Revenue Share (%), by End-user Industry 2025 & 2033
- Figure 18: Asia Pacific Specialty Paper Industry Revenue (billion), by Country 2025 & 2033
- Figure 19: Asia Pacific Specialty Paper Industry Revenue Share (%), by Country 2025 & 2033
- Figure 20: Latin America Specialty Paper Industry Revenue (billion), by Type 2025 & 2033
- Figure 21: Latin America Specialty Paper Industry Revenue Share (%), by Type 2025 & 2033
- Figure 22: Latin America Specialty Paper Industry Revenue (billion), by End-user Industry 2025 & 2033
- Figure 23: Latin America Specialty Paper Industry Revenue Share (%), by End-user Industry 2025 & 2033
- Figure 24: Latin America Specialty Paper Industry Revenue (billion), by Country 2025 & 2033
- Figure 25: Latin America Specialty Paper Industry Revenue Share (%), by Country 2025 & 2033
- Figure 26: Middle East and Africa Specialty Paper Industry Revenue (billion), by Type 2025 & 2033
- Figure 27: Middle East and Africa Specialty Paper Industry Revenue Share (%), by Type 2025 & 2033
- Figure 28: Middle East and Africa Specialty Paper Industry Revenue (billion), by End-user Industry 2025 & 2033
- Figure 29: Middle East and Africa Specialty Paper Industry Revenue Share (%), by End-user Industry 2025 & 2033
- Figure 30: Middle East and Africa Specialty Paper Industry Revenue (billion), by Country 2025 & 2033
- Figure 31: Middle East and Africa Specialty Paper Industry Revenue Share (%), by Country 2025 & 2033
List of Tables
- Table 1: Global Specialty Paper Industry Revenue billion Forecast, by Type 2020 & 2033
- Table 2: Global Specialty Paper Industry Revenue billion Forecast, by End-user Industry 2020 & 2033
- Table 3: Global Specialty Paper Industry Revenue billion Forecast, by Region 2020 & 2033
- Table 4: Global Specialty Paper Industry Revenue billion Forecast, by Type 2020 & 2033
- Table 5: Global Specialty Paper Industry Revenue billion Forecast, by End-user Industry 2020 & 2033
- Table 6: Global Specialty Paper Industry Revenue billion Forecast, by Country 2020 & 2033
- Table 7: United States Specialty Paper Industry Revenue (billion) Forecast, by Application 2020 & 2033
- Table 8: Canada Specialty Paper Industry Revenue (billion) Forecast, by Application 2020 & 2033
- Table 9: Global Specialty Paper Industry Revenue billion Forecast, by Type 2020 & 2033
- Table 10: Global Specialty Paper Industry Revenue billion Forecast, by End-user Industry 2020 & 2033
- Table 11: Global Specialty Paper Industry Revenue billion Forecast, by Country 2020 & 2033
- Table 12: Germany Specialty Paper Industry Revenue (billion) Forecast, by Application 2020 & 2033
- Table 13: United Kingdom Specialty Paper Industry Revenue (billion) Forecast, by Application 2020 & 2033
- Table 14: France Specialty Paper Industry Revenue (billion) Forecast, by Application 2020 & 2033
- Table 15: Rest of Europe Specialty Paper Industry Revenue (billion) Forecast, by Application 2020 & 2033
- Table 16: Global Specialty Paper Industry Revenue billion Forecast, by Type 2020 & 2033
- Table 17: Global Specialty Paper Industry Revenue billion Forecast, by End-user Industry 2020 & 2033
- Table 18: Global Specialty Paper Industry Revenue billion Forecast, by Country 2020 & 2033
- Table 19: China Specialty Paper Industry Revenue (billion) Forecast, by Application 2020 & 2033
- Table 20: India Specialty Paper Industry Revenue (billion) Forecast, by Application 2020 & 2033
- Table 21: Japan Specialty Paper Industry Revenue (billion) Forecast, by Application 2020 & 2033
- Table 22: Rest of Asia Pacific Specialty Paper Industry Revenue (billion) Forecast, by Application 2020 & 2033
- Table 23: Global Specialty Paper Industry Revenue billion Forecast, by Type 2020 & 2033
- Table 24: Global Specialty Paper Industry Revenue billion Forecast, by End-user Industry 2020 & 2033
- Table 25: Global Specialty Paper Industry Revenue billion Forecast, by Country 2020 & 2033
- Table 26: Brazil Specialty Paper Industry Revenue (billion) Forecast, by Application 2020 & 2033
- Table 27: Mexico Specialty Paper Industry Revenue (billion) Forecast, by Application 2020 & 2033
- Table 28: Rest of Latin America Specialty Paper Industry Revenue (billion) Forecast, by Application 2020 & 2033
- Table 29: Global Specialty Paper Industry Revenue billion Forecast, by Type 2020 & 2033
- Table 30: Global Specialty Paper Industry Revenue billion Forecast, by End-user Industry 2020 & 2033
- Table 31: Global Specialty Paper Industry Revenue billion Forecast, by Country 2020 & 2033
Frequently Asked Questions
1. What is the projected Compound Annual Growth Rate (CAGR) of the Specialty Paper Industry?
The projected CAGR is approximately 5.1%.
2. Which companies are prominent players in the Specialty Paper Industry?
Key companies in the market include BillerudKorsns AB*List Not Exhaustive, Stora Enso Oyj, LINTEC Corporation, Mondi Group PLC, Domtar Corporation, Sappi Limited, Nippon Paper Industries Co Ltd, ITC Limited, Twin Rivers Paper Company, Nordic Paper AS.
3. What are the main segments of the Specialty Paper Industry?
The market segments include Type, End-user Industry.
4. Can you provide details about the market size?
The market size is estimated to be USD 18 billion as of 2022.
5. What are some drivers contributing to market growth?
Rising Trend of Online Food Ordering; Changing Consumer Preference to Adopt Sustainable Decorative Lamination.
6. What are the notable trends driving market growth?
Food Service Industry is Expected to hold Significant Share.
7. Are there any restraints impacting market growth?
Greenhouse Gas Emission Due To Dairy Activities Leading To Legislative Issues.
8. Can you provide examples of recent developments in the market?
November 2022: Sappi North America announced the investment of USD 418 million in paper machine rebuilds at its Somerset Mill in Skowhegan. With this investment, the company is focusing on increasing Paper Machine No. 2's capacity to produce solid bleached sulfate board products, a sustainable alternative to plastic packaging. This move of the company indicates its long-term Thrive25 strategy, which focuses on growing its portfolio in packaging and speciality papers, pulp, and biomaterials.
9. What pricing options are available for accessing the report?
Pricing options include single-user, multi-user, and enterprise licenses priced at USD 4750, USD 5250, and USD 8750 respectively.
10. Is the market size provided in terms of value or volume?
The market size is provided in terms of value, measured in billion.
11. Are there any specific market keywords associated with the report?
Yes, the market keyword associated with the report is "Specialty Paper Industry," which aids in identifying and referencing the specific market segment covered.
12. How do I determine which pricing option suits my needs best?
The pricing options vary based on user requirements and access needs. Individual users may opt for single-user licenses, while businesses requiring broader access may choose multi-user or enterprise licenses for cost-effective access to the report.
13. Are there any additional resources or data provided in the Specialty Paper Industry report?
While the report offers comprehensive insights, it's advisable to review the specific contents or supplementary materials provided to ascertain if additional resources or data are available.
14. How can I stay updated on further developments or reports in the Specialty Paper Industry?
To stay informed about further developments, trends, and reports in the Specialty Paper Industry, consider subscribing to industry newsletters, following relevant companies and organizations, or regularly checking reputable industry news sources and publications.
Methodology
Step 1 - Identification of Relevant Samples Size from Population Database


Step 2 - Approaches for Defining Global Market Size (Value, Volume* & Price*)

Note*: In applicable scenarios
Step 3 - Data Sources
Primary Research
- Web Analytics
- Survey Reports
- Research Institute
- Latest Research Reports
- Opinion Leaders
Secondary Research
- Annual Reports
- White Paper
- Latest Press Release
- Industry Association
- Paid Database
- Investor Presentations

Step 4 - Data Triangulation
Involves using different sources of information in order to increase the validity of a study
These sources are likely to be stakeholders in a program - participants, other researchers, program staff, other community members, and so on.
Then we put all data in single framework & apply various statistical tools to find out the dynamic on the market.
During the analysis stage, feedback from the stakeholder groups would be compared to determine areas of agreement as well as areas of divergence