

Key Insights
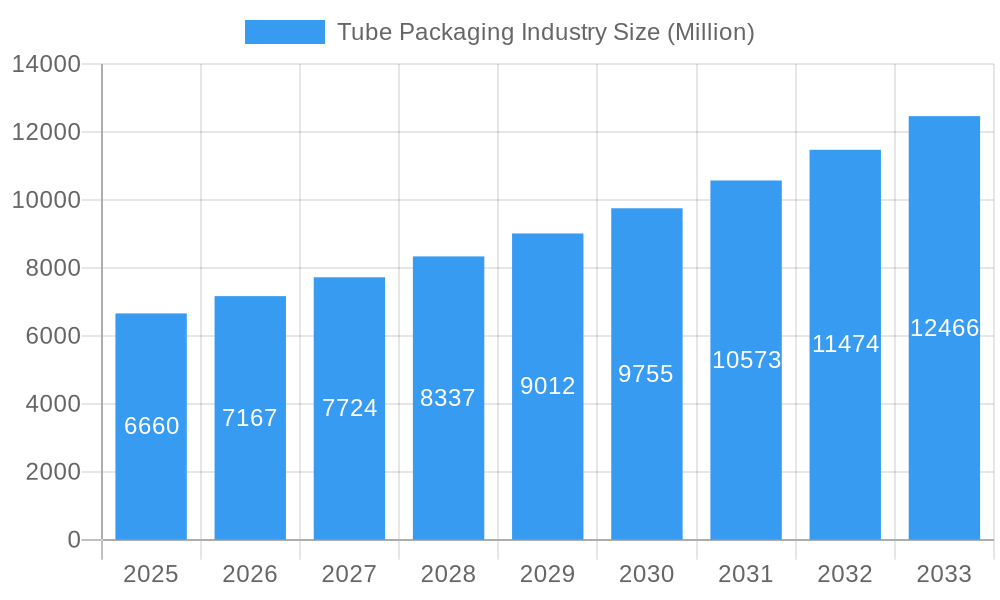
The global tube packaging market, valued at $6.66 billion in 2025, is projected to experience robust growth, driven by the increasing demand for convenient and sustainable packaging solutions across diverse industries. A compound annual growth rate (CAGR) of 7.39% from 2025 to 2033 indicates a significant expansion of the market, reaching an estimated value exceeding $13 billion by 2033. This growth is fueled by several factors, including the rising popularity of cosmetics and personal care products, the growing pharmaceutical industry, and the increasing preference for single-use and portable packaging formats. The preference for eco-friendly materials like paper and aluminum, alongside advancements in packaging technology offering features like tamper-evidence and enhanced barrier properties, further contribute to market expansion. Market segmentation by package type (squeeze, twist, stick, cartridges, others), material (plastic, paper, aluminum, others), and application (cosmetics & toiletries, healthcare & pharmaceutical, food, homecare, others) provides a granular understanding of consumer preferences and emerging trends. Geographic distribution demonstrates strong growth potential in Asia-Pacific, driven by rising disposable incomes and increasing consumer spending in emerging economies like India and China. However, fluctuating raw material prices and stringent environmental regulations present challenges that manufacturers need to address.
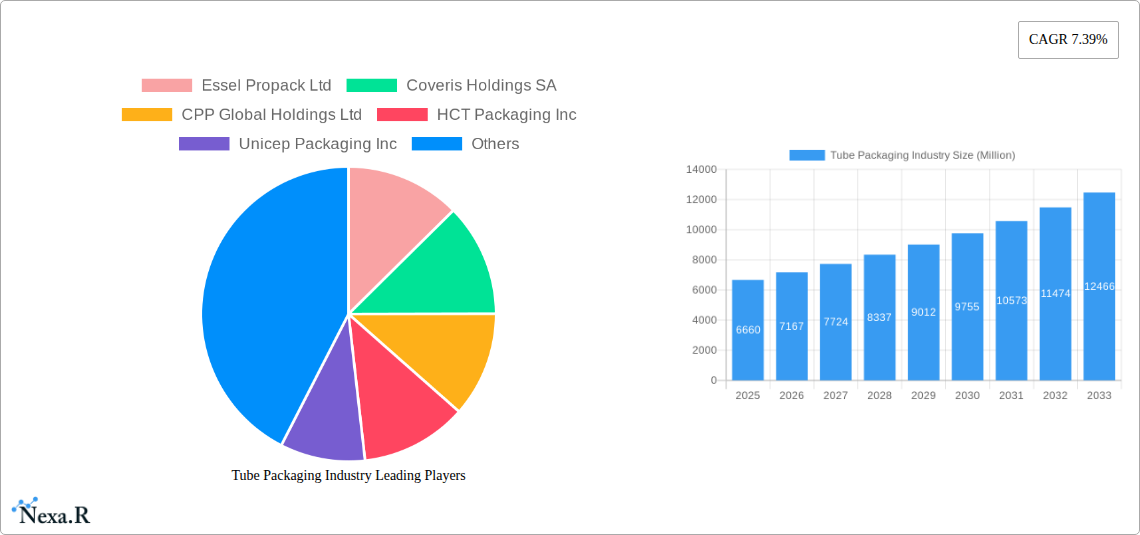
Tube Packaging Industry Market Size (In Billion)
The competitive landscape is characterized by the presence of both large multinational corporations and specialized regional players. Companies like Amcor PLC, Berry Global Inc., and Essel Propack Ltd. hold significant market share, leveraging their established distribution networks and technological expertise. However, smaller companies are also capitalizing on niche market segments and innovative product offerings. Future growth will be shaped by strategic partnerships, mergers and acquisitions, and continuous innovation in material science and packaging design. A focus on sustainability, including the use of recycled and biodegradable materials, and the adoption of circular economy principles, will be crucial for long-term success within the tube packaging industry. The continued development of sophisticated packaging features to enhance product protection and consumer experience will also be key differentiators.
Tube Packaging Industry Company Market Share
Tube Packaging Industry: A Comprehensive Market Report (2019-2033)
This comprehensive report provides an in-depth analysis of the global tube packaging industry, covering market dynamics, growth trends, competitive landscape, and future outlook. The study period spans from 2019 to 2033, with 2025 serving as the base and estimated year. The report meticulously segments the market by package type (squeeze, twist, stick, cartridges, others), material (plastic, paper, aluminum, others), and application (cosmetics & toiletries, healthcare & pharmaceutical, food, homecare, others), offering granular insights into each segment's performance and future potential. This report is invaluable for industry professionals, investors, and strategic decision-makers seeking to navigate this dynamic market.
Tube Packaging Industry Market Dynamics & Structure
The tube packaging market is characterized by a moderately concentrated structure, with several major players holding significant market share. Market concentration is approximately xx%, with the top 5 companies accounting for xx% of the global revenue in 2025. Technological innovation, particularly in sustainable materials and advanced printing techniques, is a key driver. Stringent regulatory frameworks regarding material recyclability and safety standards impact production processes and material selection. Competitive substitutes include other packaging formats like bottles, pouches, and jars, putting pressure on pricing and innovation. End-user demographics, especially growing consumer preference for convenient and sustainable packaging, heavily influence market growth. M&A activity has been significant, with xx major deals recorded between 2019 and 2024, primarily driven by expansion into new geographical markets and technological capabilities.
- Market Concentration: xx% in 2025 (Top 5 players holding xx%)
- M&A Deal Volume (2019-2024): xx
- Key Innovation Drivers: Sustainable materials, advanced printing, improved barrier properties.
- Regulatory Challenges: Compliance with material safety and recyclability standards.
- Competitive Substitutes: Bottles, pouches, jars.
Tube Packaging Industry Growth Trends & Insights
The global tube packaging market exhibited a CAGR of xx% during the historical period (2019-2024), reaching a market size of xx million units in 2024. The market is projected to continue its growth trajectory, reaching xx million units by 2025 and xx million units by 2033, with a projected CAGR of xx% during the forecast period (2025-2033). This growth is fueled by increasing demand from various end-use sectors, especially cosmetics and personal care, driven by rising disposable incomes and changing consumer preferences toward convenient packaging. Technological advancements like lightweighting and improved barrier properties are further enhancing market adoption. Furthermore, the shift towards sustainable packaging solutions is influencing material choices, creating opportunities for eco-friendly alternatives. Consumer behavior, particularly the rising demand for personalized and on-the-go products, is directly impacting packaging design and functionality.
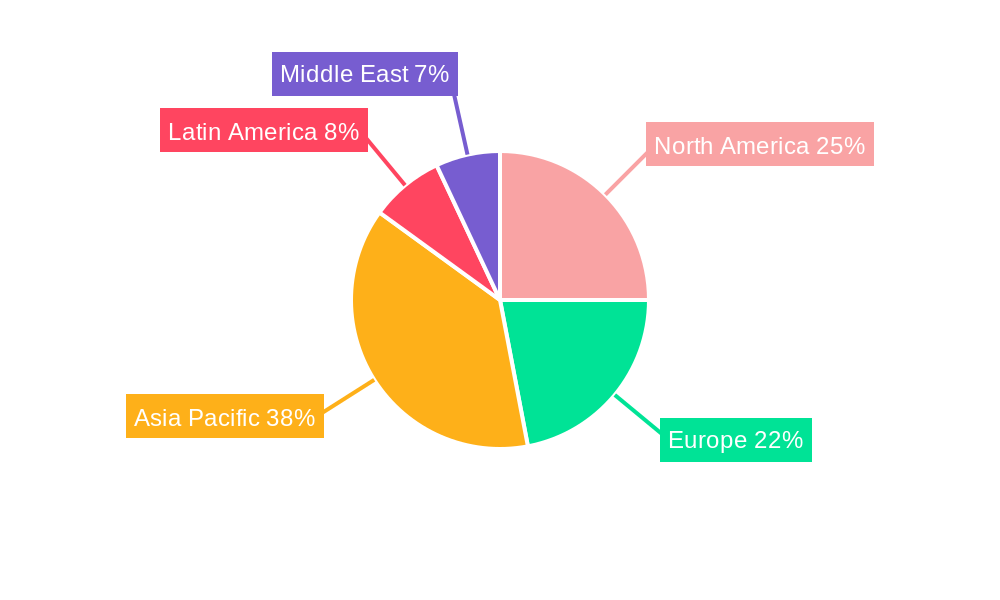
Dominant Regions, Countries, or Segments in Tube Packaging Industry
North America currently dominates the tube packaging market, holding a market share of approximately xx% in 2025. This dominance is attributed to factors such as high per capita consumption in the cosmetics and personal care industry, robust healthcare infrastructure, and established manufacturing capabilities. Europe follows closely, with a xx% market share in 2025. Asia-Pacific is experiencing rapid growth, driven by rising disposable incomes and population growth. In terms of segments, the squeeze tube segment currently holds the largest market share (xx% in 2025) due to its widespread application across various industries. The plastic material segment dominates due to its cost-effectiveness and versatility. The cosmetics and toiletries application segment is the largest end-use sector (xx% in 2025), followed by the healthcare and pharmaceutical sector.
- Dominant Region (2025): North America (xx% market share)
- Key Growth Drivers (Asia-Pacific): Rising disposable incomes, population growth.
- Largest Segment (By Type): Squeeze tubes (xx% market share in 2025)
- Largest Segment (By Material): Plastic (xx% market share in 2025)
- Largest Segment (By Application): Cosmetics & Toiletries (xx% market share in 2025)
Tube Packaging Industry Product Landscape
The tube packaging industry showcases continuous innovation in material science, design, and functionality. Recent product developments include lightweight, high-barrier tubes made from sustainable materials, enhancing product shelf life and reducing environmental impact. Improved printing technologies enable high-quality graphics and branding, increasing product appeal. Innovative closures and dispensing mechanisms improve usability and consumer experience. Unique selling propositions increasingly center on sustainability, convenience, and enhanced barrier protection.
Key Drivers, Barriers & Challenges in Tube Packaging Industry
Key Drivers: Rising demand from the cosmetics & personal care and healthcare sectors, increasing consumer preference for convenient packaging, growing adoption of sustainable packaging alternatives, technological advancements in materials and printing.
Challenges: Fluctuations in raw material prices, stringent environmental regulations, intense competition, supply chain disruptions (estimated impact of xx million units in 2024 due to xx), and challenges in ensuring the recyclability of certain materials.
Emerging Opportunities in Tube Packaging Industry
Emerging trends include the rise of personalized packaging, increasing demand for eco-friendly and recyclable tubes, growth in niche applications (e.g., food and beverages), and expansion into emerging markets. Opportunities lie in developing innovative packaging solutions using biodegradable and compostable materials, creating customized packaging options, and exploring new markets in developing economies.
Growth Accelerators in the Tube Packaging Industry
Long-term growth will be driven by technological breakthroughs in sustainable materials, strategic partnerships between packaging manufacturers and brand owners to develop innovative solutions, and targeted market expansion strategies focusing on emerging economies with high growth potential.
Key Players Shaping the Tube Packaging Industry Market
- Essel Propack Ltd
- Coveris Holdings SA
- CPP Global Holdings Ltd
- HCT Packaging Inc
- Unicep Packaging Inc
- IntraPac International Corporation
- IntraPac International LLC
- CTL - TH Packaging Group SL
- Amcor PLC
- CCL Industries Inc
- VisiPak Inc
- Albea S A
- Viva Group Inc
- Fischbach KG
- Berry Global Inc
- Printpack Inc
- Silgan Holdings Inc
- Clariant International Ltd
Notable Milestones in Tube Packaging Industry Sector
- 2020: Amcor PLC launches a range of recyclable and compostable tubes.
- 2021: Berry Global Inc. acquires a leading tube packaging manufacturer, expanding its market share.
- 2022: Essel Propack Ltd introduces a new printing technology for enhanced graphics on tubes.
- 2023: Several major players announce commitments to using only recycled materials in their tube packaging by 2030.
- 2024: Significant regulatory changes impact material usage across Europe.
In-Depth Tube Packaging Industry Market Outlook
The tube packaging market is poised for continued growth, driven by the factors already outlined. Strategic opportunities lie in investing in sustainable materials and production processes, exploring new applications, and focusing on market expansion in emerging economies. The long-term outlook is positive, anticipating strong growth and innovation in the industry.
Tube Packaging Industry Segmentation
-
1. Type of Package
- 1.1. Squeeze
- 1.2. Twist
- 1.3. Stick
- 1.4. Cartridges
- 1.5. Others
-
2. Material
- 2.1. Plastic
- 2.2. Paper
- 2.3. Aluminum
- 2.4. Others
-
3. Application
- 3.1. Cosmetics & Toiletries
- 3.2. Healthcare & Pharmaceutical
- 3.3. Food
- 3.4. Homecare
- 3.5. Others
Tube Packaging Industry Segmentation By Geography
-
1. North America
- 1.1. United States
- 1.2. Canada
-
2. Europe
- 2.1. United Kingdom
- 2.2. Germany
- 2.3. France
- 2.4. Italy
- 2.5. Rest of Europe
-
3. Asia Pacific
- 3.1. China
- 3.2. Japan
- 3.3. India
- 3.4. Australia
- 3.5. Rest of Asia Pacific
-
4. Latin America
- 4.1. Brazil
- 4.2. Argentina
- 4.3. Rest of Latin America
- 5. Middle East
-
6. United Arab Emirates
- 6.1. Saudi Arabia
- 6.2. Rest of Middle East
Tube Packaging Industry Regional Market Share
Geographic Coverage of Tube Packaging Industry
Tube Packaging Industry REPORT HIGHLIGHTS
| Aspects | Details |
|---|---|
| Study Period | 2020-2034 |
| Base Year | 2025 |
| Estimated Year | 2026 |
| Forecast Period | 2026-2034 |
| Historical Period | 2020-2025 |
| Growth Rate | CAGR of 7.39% from 2020-2034 |
| Segmentation |
|
Table of Contents
- 1. Introduction
- 1.1. Research Scope
- 1.2. Market Segmentation
- 1.3. Research Objective
- 1.4. Definitions and Assumptions
- 2. Executive Summary
- 2.1. Market Snapshot
- 3. Market Dynamics
- 3.1. Market Drivers
- 3.2. Market Restrains
- 3.3. Market Trends
- 3.4. Market Opportunities
- 4. Market Factor Analysis
- 4.1. Porters Five Forces
- 4.1.1. Bargaining Power of Suppliers
- 4.1.2. Bargaining Power of Buyers
- 4.1.3. Threat of New Entrants
- 4.1.4. Threat of Substitutes
- 4.1.5. Competitive Rivalry
- 4.2. PESTEL analysis
- 4.3. BCG Analysis
- 4.3.1. Stars (High Growth, High Market Share)
- 4.3.2. Cash Cows (Low Growth, High Market Share)
- 4.3.3. Question Mark (High Growth, Low Market Share)
- 4.3.4. Dogs (Low Growth, Low Market Share)
- 4.4. Ansoff Matrix Analysis
- 4.5. Supply Chain Analysis
- 4.6. Regulatory Landscape
- 4.7. Current Market Potential and Opportunity Assessment (TAM–SAM–SOM Framework)
- 4.8. NRP Analyst Note
- 4.1. Porters Five Forces
- 5. Market Analysis, Insights and Forecast 2021-2033
- 5.1. Market Analysis, Insights and Forecast - by Type of Package
- 5.1.1. Squeeze
- 5.1.2. Twist
- 5.1.3. Stick
- 5.1.4. Cartridges
- 5.1.5. Others
- 5.2. Market Analysis, Insights and Forecast - by Material
- 5.2.1. Plastic
- 5.2.2. Paper
- 5.2.3. Aluminum
- 5.2.4. Others
- 5.3. Market Analysis, Insights and Forecast - by Application
- 5.3.1. Cosmetics & Toiletries
- 5.3.2. Healthcare & Pharmaceutical
- 5.3.3. Food
- 5.3.4. Homecare
- 5.3.5. Others
- 5.4. Market Analysis, Insights and Forecast - by Region
- 5.4.1. North America
- 5.4.2. Europe
- 5.4.3. Asia Pacific
- 5.4.4. Latin America
- 5.4.5. Middle East
- 5.4.6. United Arab Emirates
- 5.1. Market Analysis, Insights and Forecast - by Type of Package
- 6. Global Tube Packaging Industry Analysis, Insights and Forecast, 2021-2033
- 6.1. Market Analysis, Insights and Forecast - by Type of Package
- 6.1.1. Squeeze
- 6.1.2. Twist
- 6.1.3. Stick
- 6.1.4. Cartridges
- 6.1.5. Others
- 6.2. Market Analysis, Insights and Forecast - by Material
- 6.2.1. Plastic
- 6.2.2. Paper
- 6.2.3. Aluminum
- 6.2.4. Others
- 6.3. Market Analysis, Insights and Forecast - by Application
- 6.3.1. Cosmetics & Toiletries
- 6.3.2. Healthcare & Pharmaceutical
- 6.3.3. Food
- 6.3.4. Homecare
- 6.3.5. Others
- 6.1. Market Analysis, Insights and Forecast - by Type of Package
- 7. North America Tube Packaging Industry Analysis, Insights and Forecast, 2020-2032
- 7.1. Market Analysis, Insights and Forecast - by Type of Package
- 7.1.1. Squeeze
- 7.1.2. Twist
- 7.1.3. Stick
- 7.1.4. Cartridges
- 7.1.5. Others
- 7.2. Market Analysis, Insights and Forecast - by Material
- 7.2.1. Plastic
- 7.2.2. Paper
- 7.2.3. Aluminum
- 7.2.4. Others
- 7.3. Market Analysis, Insights and Forecast - by Application
- 7.3.1. Cosmetics & Toiletries
- 7.3.2. Healthcare & Pharmaceutical
- 7.3.3. Food
- 7.3.4. Homecare
- 7.3.5. Others
- 7.1. Market Analysis, Insights and Forecast - by Type of Package
- 8. Europe Tube Packaging Industry Analysis, Insights and Forecast, 2020-2032
- 8.1. Market Analysis, Insights and Forecast - by Type of Package
- 8.1.1. Squeeze
- 8.1.2. Twist
- 8.1.3. Stick
- 8.1.4. Cartridges
- 8.1.5. Others
- 8.2. Market Analysis, Insights and Forecast - by Material
- 8.2.1. Plastic
- 8.2.2. Paper
- 8.2.3. Aluminum
- 8.2.4. Others
- 8.3. Market Analysis, Insights and Forecast - by Application
- 8.3.1. Cosmetics & Toiletries
- 8.3.2. Healthcare & Pharmaceutical
- 8.3.3. Food
- 8.3.4. Homecare
- 8.3.5. Others
- 8.1. Market Analysis, Insights and Forecast - by Type of Package
- 9. Asia Pacific Tube Packaging Industry Analysis, Insights and Forecast, 2020-2032
- 9.1. Market Analysis, Insights and Forecast - by Type of Package
- 9.1.1. Squeeze
- 9.1.2. Twist
- 9.1.3. Stick
- 9.1.4. Cartridges
- 9.1.5. Others
- 9.2. Market Analysis, Insights and Forecast - by Material
- 9.2.1. Plastic
- 9.2.2. Paper
- 9.2.3. Aluminum
- 9.2.4. Others
- 9.3. Market Analysis, Insights and Forecast - by Application
- 9.3.1. Cosmetics & Toiletries
- 9.3.2. Healthcare & Pharmaceutical
- 9.3.3. Food
- 9.3.4. Homecare
- 9.3.5. Others
- 9.1. Market Analysis, Insights and Forecast - by Type of Package
- 10. Latin America Tube Packaging Industry Analysis, Insights and Forecast, 2020-2032
- 10.1. Market Analysis, Insights and Forecast - by Type of Package
- 10.1.1. Squeeze
- 10.1.2. Twist
- 10.1.3. Stick
- 10.1.4. Cartridges
- 10.1.5. Others
- 10.2. Market Analysis, Insights and Forecast - by Material
- 10.2.1. Plastic
- 10.2.2. Paper
- 10.2.3. Aluminum
- 10.2.4. Others
- 10.3. Market Analysis, Insights and Forecast - by Application
- 10.3.1. Cosmetics & Toiletries
- 10.3.2. Healthcare & Pharmaceutical
- 10.3.3. Food
- 10.3.4. Homecare
- 10.3.5. Others
- 10.1. Market Analysis, Insights and Forecast - by Type of Package
- 11. Middle East Tube Packaging Industry Analysis, Insights and Forecast, 2020-2032
- 11.1. Market Analysis, Insights and Forecast - by Type of Package
- 11.1.1. Squeeze
- 11.1.2. Twist
- 11.1.3. Stick
- 11.1.4. Cartridges
- 11.1.5. Others
- 11.2. Market Analysis, Insights and Forecast - by Material
- 11.2.1. Plastic
- 11.2.2. Paper
- 11.2.3. Aluminum
- 11.2.4. Others
- 11.3. Market Analysis, Insights and Forecast - by Application
- 11.3.1. Cosmetics & Toiletries
- 11.3.2. Healthcare & Pharmaceutical
- 11.3.3. Food
- 11.3.4. Homecare
- 11.3.5. Others
- 11.1. Market Analysis, Insights and Forecast - by Type of Package
- 12. United Arab Emirates Tube Packaging Industry Analysis, Insights and Forecast, 2020-2032
- 12.1. Market Analysis, Insights and Forecast - by Type of Package
- 12.1.1. Squeeze
- 12.1.2. Twist
- 12.1.3. Stick
- 12.1.4. Cartridges
- 12.1.5. Others
- 12.2. Market Analysis, Insights and Forecast - by Material
- 12.2.1. Plastic
- 12.2.2. Paper
- 12.2.3. Aluminum
- 12.2.4. Others
- 12.3. Market Analysis, Insights and Forecast - by Application
- 12.3.1. Cosmetics & Toiletries
- 12.3.2. Healthcare & Pharmaceutical
- 12.3.3. Food
- 12.3.4. Homecare
- 12.3.5. Others
- 12.1. Market Analysis, Insights and Forecast - by Type of Package
- 13. Competitive Analysis
- 13.1. Company Profiles
- 13.1.1 Essel Propack Ltd
- 13.1.1.1. Company Overview
- 13.1.1.2. Products
- 13.1.1.3. Company Financials
- 13.1.1.4. SWOT Analysis
- 13.1.2 Coveris Holdings SA
- 13.1.2.1. Company Overview
- 13.1.2.2. Products
- 13.1.2.3. Company Financials
- 13.1.2.4. SWOT Analysis
- 13.1.3 CPP Global Holdings Ltd
- 13.1.3.1. Company Overview
- 13.1.3.2. Products
- 13.1.3.3. Company Financials
- 13.1.3.4. SWOT Analysis
- 13.1.4 HCT Packaging Inc
- 13.1.4.1. Company Overview
- 13.1.4.2. Products
- 13.1.4.3. Company Financials
- 13.1.4.4. SWOT Analysis
- 13.1.5 Unicep Packaging Inc
- 13.1.5.1. Company Overview
- 13.1.5.2. Products
- 13.1.5.3. Company Financials
- 13.1.5.4. SWOT Analysis
- 13.1.6 IntraPac International Corporation
- 13.1.6.1. Company Overview
- 13.1.6.2. Products
- 13.1.6.3. Company Financials
- 13.1.6.4. SWOT Analysis
- 13.1.7 IntraPac International LLC
- 13.1.7.1. Company Overview
- 13.1.7.2. Products
- 13.1.7.3. Company Financials
- 13.1.7.4. SWOT Analysis
- 13.1.8 CTL - TH Packaging Group SL
- 13.1.8.1. Company Overview
- 13.1.8.2. Products
- 13.1.8.3. Company Financials
- 13.1.8.4. SWOT Analysis
- 13.1.9 Amcor PLC
- 13.1.9.1. Company Overview
- 13.1.9.2. Products
- 13.1.9.3. Company Financials
- 13.1.9.4. SWOT Analysis
- 13.1.10 CCL Industries Inc
- 13.1.10.1. Company Overview
- 13.1.10.2. Products
- 13.1.10.3. Company Financials
- 13.1.10.4. SWOT Analysis
- 13.1.11 VisiPak Inc
- 13.1.11.1. Company Overview
- 13.1.11.2. Products
- 13.1.11.3. Company Financials
- 13.1.11.4. SWOT Analysis
- 13.1.12 Albea S A
- 13.1.12.1. Company Overview
- 13.1.12.2. Products
- 13.1.12.3. Company Financials
- 13.1.12.4. SWOT Analysis
- 13.1.13 Viva Group Inc *List Not Exhaustive
- 13.1.13.1. Company Overview
- 13.1.13.2. Products
- 13.1.13.3. Company Financials
- 13.1.13.4. SWOT Analysis
- 13.1.14 Fischbach KG
- 13.1.14.1. Company Overview
- 13.1.14.2. Products
- 13.1.14.3. Company Financials
- 13.1.14.4. SWOT Analysis
- 13.1.15 Berry Global Inc
- 13.1.15.1. Company Overview
- 13.1.15.2. Products
- 13.1.15.3. Company Financials
- 13.1.15.4. SWOT Analysis
- 13.1.16 Printpack Inc
- 13.1.16.1. Company Overview
- 13.1.16.2. Products
- 13.1.16.3. Company Financials
- 13.1.16.4. SWOT Analysis
- 13.1.17 Silgan Holdings Inc
- 13.1.17.1. Company Overview
- 13.1.17.2. Products
- 13.1.17.3. Company Financials
- 13.1.17.4. SWOT Analysis
- 13.1.18 Clariant International Ltd
- 13.1.18.1. Company Overview
- 13.1.18.2. Products
- 13.1.18.3. Company Financials
- 13.1.18.4. SWOT Analysis
- 13.1.1 Essel Propack Ltd
- 13.2. Market Entropy
- 13.2.1 Company's Key Areas Served
- 13.2.2 Recent Developments
- 13.3. Company Market Share Analysis 2025
- 13.3.1 Top 5 Companies Market Share Analysis
- 13.3.2 Top 3 Companies Market Share Analysis
- 13.4. List of Potential Customers
- 14. Research Methodology
List of Figures
- Figure 1: Global Tube Packaging Industry Revenue Breakdown (Million, %) by Region 2025 & 2033
- Figure 2: North America Tube Packaging Industry Revenue (Million), by Type of Package 2025 & 2033
- Figure 3: North America Tube Packaging Industry Revenue Share (%), by Type of Package 2025 & 2033
- Figure 4: North America Tube Packaging Industry Revenue (Million), by Material 2025 & 2033
- Figure 5: North America Tube Packaging Industry Revenue Share (%), by Material 2025 & 2033
- Figure 6: North America Tube Packaging Industry Revenue (Million), by Application 2025 & 2033
- Figure 7: North America Tube Packaging Industry Revenue Share (%), by Application 2025 & 2033
- Figure 8: North America Tube Packaging Industry Revenue (Million), by Country 2025 & 2033
- Figure 9: North America Tube Packaging Industry Revenue Share (%), by Country 2025 & 2033
- Figure 10: Europe Tube Packaging Industry Revenue (Million), by Type of Package 2025 & 2033
- Figure 11: Europe Tube Packaging Industry Revenue Share (%), by Type of Package 2025 & 2033
- Figure 12: Europe Tube Packaging Industry Revenue (Million), by Material 2025 & 2033
- Figure 13: Europe Tube Packaging Industry Revenue Share (%), by Material 2025 & 2033
- Figure 14: Europe Tube Packaging Industry Revenue (Million), by Application 2025 & 2033
- Figure 15: Europe Tube Packaging Industry Revenue Share (%), by Application 2025 & 2033
- Figure 16: Europe Tube Packaging Industry Revenue (Million), by Country 2025 & 2033
- Figure 17: Europe Tube Packaging Industry Revenue Share (%), by Country 2025 & 2033
- Figure 18: Asia Pacific Tube Packaging Industry Revenue (Million), by Type of Package 2025 & 2033
- Figure 19: Asia Pacific Tube Packaging Industry Revenue Share (%), by Type of Package 2025 & 2033
- Figure 20: Asia Pacific Tube Packaging Industry Revenue (Million), by Material 2025 & 2033
- Figure 21: Asia Pacific Tube Packaging Industry Revenue Share (%), by Material 2025 & 2033
- Figure 22: Asia Pacific Tube Packaging Industry Revenue (Million), by Application 2025 & 2033
- Figure 23: Asia Pacific Tube Packaging Industry Revenue Share (%), by Application 2025 & 2033
- Figure 24: Asia Pacific Tube Packaging Industry Revenue (Million), by Country 2025 & 2033
- Figure 25: Asia Pacific Tube Packaging Industry Revenue Share (%), by Country 2025 & 2033
- Figure 26: Latin America Tube Packaging Industry Revenue (Million), by Type of Package 2025 & 2033
- Figure 27: Latin America Tube Packaging Industry Revenue Share (%), by Type of Package 2025 & 2033
- Figure 28: Latin America Tube Packaging Industry Revenue (Million), by Material 2025 & 2033
- Figure 29: Latin America Tube Packaging Industry Revenue Share (%), by Material 2025 & 2033
- Figure 30: Latin America Tube Packaging Industry Revenue (Million), by Application 2025 & 2033
- Figure 31: Latin America Tube Packaging Industry Revenue Share (%), by Application 2025 & 2033
- Figure 32: Latin America Tube Packaging Industry Revenue (Million), by Country 2025 & 2033
- Figure 33: Latin America Tube Packaging Industry Revenue Share (%), by Country 2025 & 2033
- Figure 34: Middle East Tube Packaging Industry Revenue (Million), by Type of Package 2025 & 2033
- Figure 35: Middle East Tube Packaging Industry Revenue Share (%), by Type of Package 2025 & 2033
- Figure 36: Middle East Tube Packaging Industry Revenue (Million), by Material 2025 & 2033
- Figure 37: Middle East Tube Packaging Industry Revenue Share (%), by Material 2025 & 2033
- Figure 38: Middle East Tube Packaging Industry Revenue (Million), by Application 2025 & 2033
- Figure 39: Middle East Tube Packaging Industry Revenue Share (%), by Application 2025 & 2033
- Figure 40: Middle East Tube Packaging Industry Revenue (Million), by Country 2025 & 2033
- Figure 41: Middle East Tube Packaging Industry Revenue Share (%), by Country 2025 & 2033
- Figure 42: United Arab Emirates Tube Packaging Industry Revenue (Million), by Type of Package 2025 & 2033
- Figure 43: United Arab Emirates Tube Packaging Industry Revenue Share (%), by Type of Package 2025 & 2033
- Figure 44: United Arab Emirates Tube Packaging Industry Revenue (Million), by Material 2025 & 2033
- Figure 45: United Arab Emirates Tube Packaging Industry Revenue Share (%), by Material 2025 & 2033
- Figure 46: United Arab Emirates Tube Packaging Industry Revenue (Million), by Application 2025 & 2033
- Figure 47: United Arab Emirates Tube Packaging Industry Revenue Share (%), by Application 2025 & 2033
- Figure 48: United Arab Emirates Tube Packaging Industry Revenue (Million), by Country 2025 & 2033
- Figure 49: United Arab Emirates Tube Packaging Industry Revenue Share (%), by Country 2025 & 2033
List of Tables
- Table 1: Global Tube Packaging Industry Revenue Million Forecast, by Type of Package 2020 & 2033
- Table 2: Global Tube Packaging Industry Revenue Million Forecast, by Material 2020 & 2033
- Table 3: Global Tube Packaging Industry Revenue Million Forecast, by Application 2020 & 2033
- Table 4: Global Tube Packaging Industry Revenue Million Forecast, by Region 2020 & 2033
- Table 5: Global Tube Packaging Industry Revenue Million Forecast, by Type of Package 2020 & 2033
- Table 6: Global Tube Packaging Industry Revenue Million Forecast, by Material 2020 & 2033
- Table 7: Global Tube Packaging Industry Revenue Million Forecast, by Application 2020 & 2033
- Table 8: Global Tube Packaging Industry Revenue Million Forecast, by Country 2020 & 2033
- Table 9: United States Tube Packaging Industry Revenue (Million) Forecast, by Application 2020 & 2033
- Table 10: Canada Tube Packaging Industry Revenue (Million) Forecast, by Application 2020 & 2033
- Table 11: Global Tube Packaging Industry Revenue Million Forecast, by Type of Package 2020 & 2033
- Table 12: Global Tube Packaging Industry Revenue Million Forecast, by Material 2020 & 2033
- Table 13: Global Tube Packaging Industry Revenue Million Forecast, by Application 2020 & 2033
- Table 14: Global Tube Packaging Industry Revenue Million Forecast, by Country 2020 & 2033
- Table 15: United Kingdom Tube Packaging Industry Revenue (Million) Forecast, by Application 2020 & 2033
- Table 16: Germany Tube Packaging Industry Revenue (Million) Forecast, by Application 2020 & 2033
- Table 17: France Tube Packaging Industry Revenue (Million) Forecast, by Application 2020 & 2033
- Table 18: Italy Tube Packaging Industry Revenue (Million) Forecast, by Application 2020 & 2033
- Table 19: Rest of Europe Tube Packaging Industry Revenue (Million) Forecast, by Application 2020 & 2033
- Table 20: Global Tube Packaging Industry Revenue Million Forecast, by Type of Package 2020 & 2033
- Table 21: Global Tube Packaging Industry Revenue Million Forecast, by Material 2020 & 2033
- Table 22: Global Tube Packaging Industry Revenue Million Forecast, by Application 2020 & 2033
- Table 23: Global Tube Packaging Industry Revenue Million Forecast, by Country 2020 & 2033
- Table 24: China Tube Packaging Industry Revenue (Million) Forecast, by Application 2020 & 2033
- Table 25: Japan Tube Packaging Industry Revenue (Million) Forecast, by Application 2020 & 2033
- Table 26: India Tube Packaging Industry Revenue (Million) Forecast, by Application 2020 & 2033
- Table 27: Australia Tube Packaging Industry Revenue (Million) Forecast, by Application 2020 & 2033
- Table 28: Rest of Asia Pacific Tube Packaging Industry Revenue (Million) Forecast, by Application 2020 & 2033
- Table 29: Global Tube Packaging Industry Revenue Million Forecast, by Type of Package 2020 & 2033
- Table 30: Global Tube Packaging Industry Revenue Million Forecast, by Material 2020 & 2033
- Table 31: Global Tube Packaging Industry Revenue Million Forecast, by Application 2020 & 2033
- Table 32: Global Tube Packaging Industry Revenue Million Forecast, by Country 2020 & 2033
- Table 33: Brazil Tube Packaging Industry Revenue (Million) Forecast, by Application 2020 & 2033
- Table 34: Argentina Tube Packaging Industry Revenue (Million) Forecast, by Application 2020 & 2033
- Table 35: Rest of Latin America Tube Packaging Industry Revenue (Million) Forecast, by Application 2020 & 2033
- Table 36: Global Tube Packaging Industry Revenue Million Forecast, by Type of Package 2020 & 2033
- Table 37: Global Tube Packaging Industry Revenue Million Forecast, by Material 2020 & 2033
- Table 38: Global Tube Packaging Industry Revenue Million Forecast, by Application 2020 & 2033
- Table 39: Global Tube Packaging Industry Revenue Million Forecast, by Country 2020 & 2033
- Table 40: Global Tube Packaging Industry Revenue Million Forecast, by Type of Package 2020 & 2033
- Table 41: Global Tube Packaging Industry Revenue Million Forecast, by Material 2020 & 2033
- Table 42: Global Tube Packaging Industry Revenue Million Forecast, by Application 2020 & 2033
- Table 43: Global Tube Packaging Industry Revenue Million Forecast, by Country 2020 & 2033
- Table 44: Saudi Arabia Tube Packaging Industry Revenue (Million) Forecast, by Application 2020 & 2033
- Table 45: Rest of Middle East Tube Packaging Industry Revenue (Million) Forecast, by Application 2020 & 2033
Frequently Asked Questions
1. What is the projected Compound Annual Growth Rate (CAGR) of the Tube Packaging Industry?
The projected CAGR is approximately 7.39%.
2. Which companies are prominent players in the Tube Packaging Industry?
Key companies in the market include Essel Propack Ltd, Coveris Holdings SA, CPP Global Holdings Ltd, HCT Packaging Inc, Unicep Packaging Inc, IntraPac International Corporation, IntraPac International LLC, CTL - TH Packaging Group SL, Amcor PLC, CCL Industries Inc, VisiPak Inc, Albea S A, Viva Group Inc *List Not Exhaustive, Fischbach KG, Berry Global Inc, Printpack Inc, Silgan Holdings Inc, Clariant International Ltd.
3. What are the main segments of the Tube Packaging Industry?
The market segments include Type of Package, Material, Application.
4. Can you provide details about the market size?
The market size is estimated to be USD 6.66 Million as of 2022.
5. What are some drivers contributing to market growth?
; Growth in Flexible Packaging; Increasing Demand for Convenience Packaging.
6. What are the notable trends driving market growth?
Plastics to Drive the Market Growth.
7. Are there any restraints impacting market growth?
Regulations Restricting the Sale and Availability of Pharmaceutical Plastic Products; Fluctuations in Raw Material Cost Due to Suppliers Bargaining Power.
8. Can you provide examples of recent developments in the market?
N/A
9. What pricing options are available for accessing the report?
Pricing options include single-user, multi-user, and enterprise licenses priced at USD 4750, USD 5250, and USD 8750 respectively.
10. Is the market size provided in terms of value or volume?
The market size is provided in terms of value, measured in Million.
11. Are there any specific market keywords associated with the report?
Yes, the market keyword associated with the report is "Tube Packaging Industry," which aids in identifying and referencing the specific market segment covered.
12. How do I determine which pricing option suits my needs best?
The pricing options vary based on user requirements and access needs. Individual users may opt for single-user licenses, while businesses requiring broader access may choose multi-user or enterprise licenses for cost-effective access to the report.
13. Are there any additional resources or data provided in the Tube Packaging Industry report?
While the report offers comprehensive insights, it's advisable to review the specific contents or supplementary materials provided to ascertain if additional resources or data are available.
14. How can I stay updated on further developments or reports in the Tube Packaging Industry?
To stay informed about further developments, trends, and reports in the Tube Packaging Industry, consider subscribing to industry newsletters, following relevant companies and organizations, or regularly checking reputable industry news sources and publications.
Methodology
Step 1 - Identification of Relevant Samples Size from Population Database


Step 2 - Approaches for Defining Global Market Size (Value, Volume* & Price*)

Note*: In applicable scenarios
Step 3 - Data Sources
Primary Research
- Web Analytics
- Survey Reports
- Research Institute
- Latest Research Reports
- Opinion Leaders
Secondary Research
- Annual Reports
- White Paper
- Latest Press Release
- Industry Association
- Paid Database
- Investor Presentations

Step 4 - Data Triangulation
Involves using different sources of information in order to increase the validity of a study
These sources are likely to be stakeholders in a program - participants, other researchers, program staff, other community members, and so on.
Then we put all data in single framework & apply various statistical tools to find out the dynamic on the market.
During the analysis stage, feedback from the stakeholder groups would be compared to determine areas of agreement as well as areas of divergence