

Key Insights
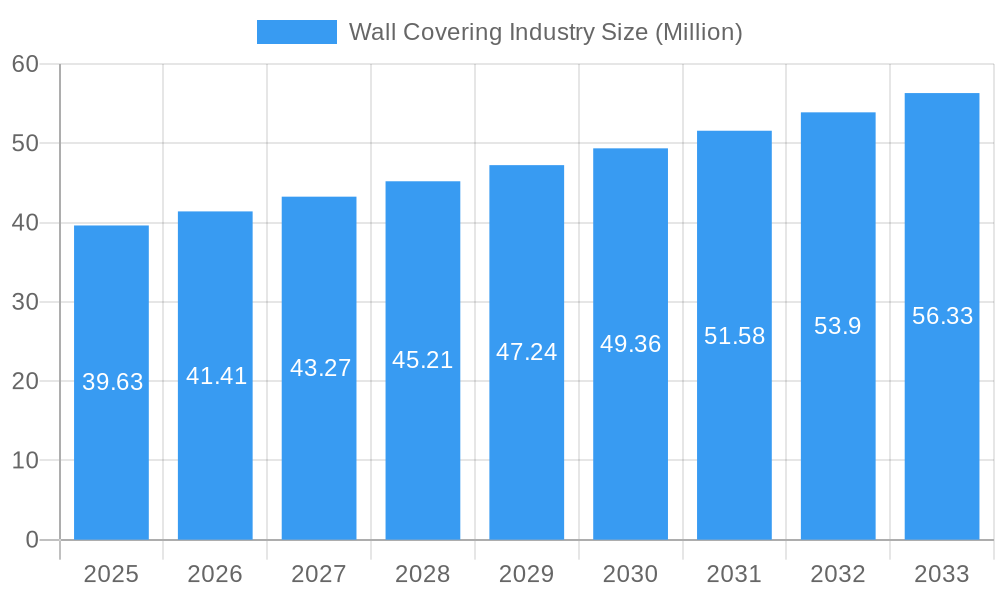
The Wall Covering Industry is projected to reach a market size of $39.63 million by 2025, growing at a compound annual growth rate (CAGR) of 4.47% from 2025 to 2033. The industry is driven by an increasing demand for aesthetically pleasing and functional wall solutions in both residential and commercial sectors. Key drivers include the rise in home renovation projects and the growing popularity of interior design trends that emphasize personalization and style. The market is segmented by distribution channels such as specialty stores, home centers, and e-commerce, which cater to diverse consumer preferences and shopping habits. Product types range from traditional wall panels and wallpapers to innovative materials like tile and metal wall coverings, meeting various consumer needs and design trends.
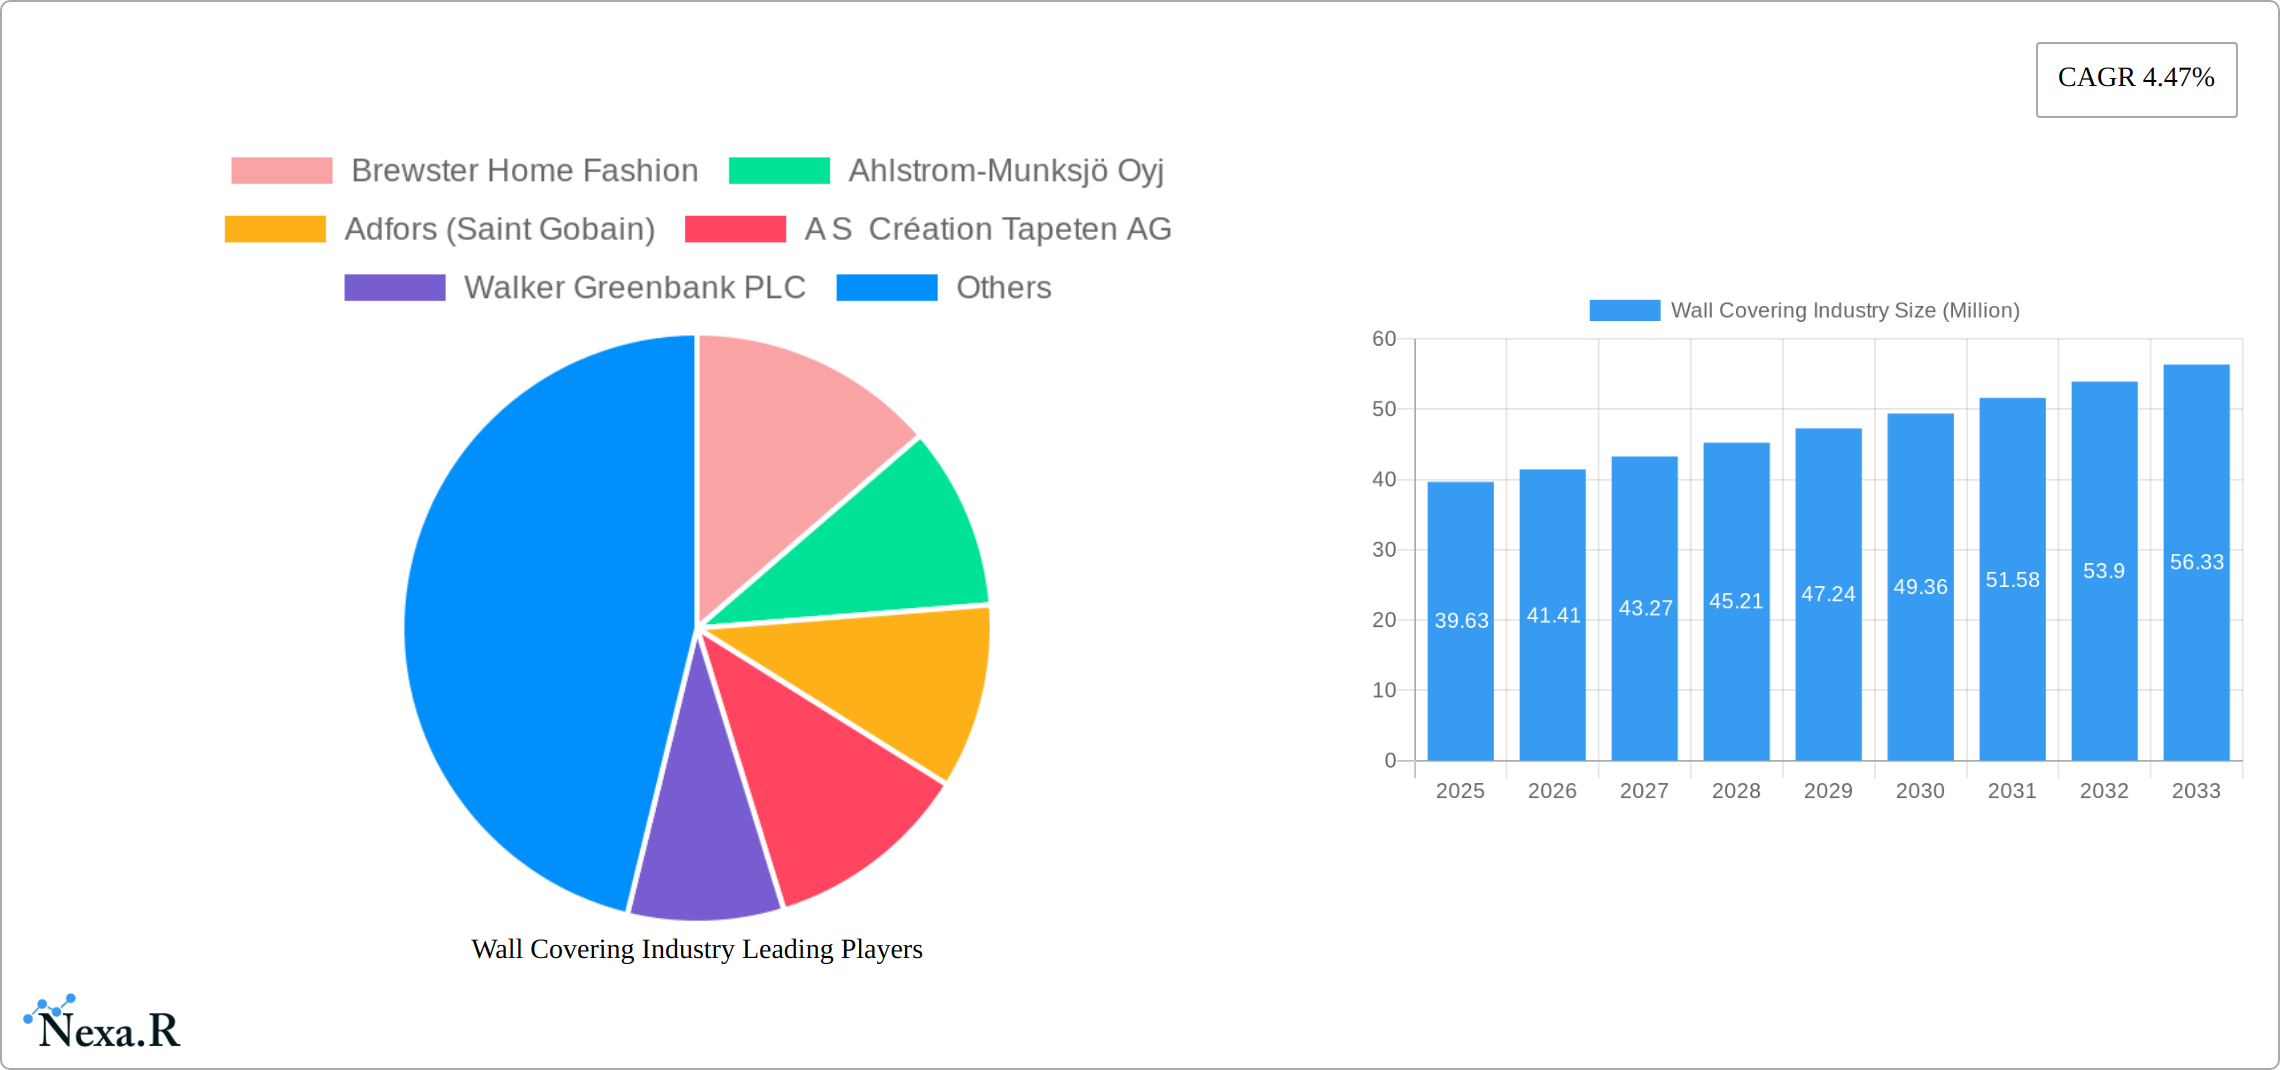
Wall Covering Industry Market Size (In Million)
The market is also influenced by regional dynamics, with North America and Europe holding significant shares due to established markets and high consumer spending on home improvement. In contrast, the Asia Pacific region is experiencing rapid growth, fueled by urbanization and increasing disposable incomes. Major players like Brewster Home Fashion, Ahlstrom-Munksjö Oyj, and Asian Paints Ltd are actively expanding their product portfolios and distribution networks to capitalize on these trends. Challenges include fluctuating raw material costs and the need for sustainable and eco-friendly products. However, opportunities abound in the form of technological advancements and the integration of smart features into wall coverings, promising a vibrant future for the industry.
Wall Covering Industry Company Market Share
Wall Covering Industry Market Report: 2019-2033
This comprehensive report provides a detailed analysis of the global wall covering industry, encompassing market dynamics, growth trends, regional performance, product landscape, and key players. With a study period spanning 2019-2033, a base year of 2025, and a forecast period of 2025-2033, this report offers invaluable insights for industry professionals, investors, and strategic decision-makers. The report analyzes the parent market of home improvement and the child market of interior décor to provide a holistic view. Market values are presented in million units.
Wall Covering Industry Market Dynamics & Structure
The wall covering market is moderately fragmented, with several key players competing for market share. Technological innovation, primarily in material science and digital printing, is a crucial driver. Regulatory frameworks, particularly concerning VOC emissions and sustainability, significantly impact product development and adoption. Competitive substitutes, such as paint and other surface treatments, exert constant pressure. End-user demographics, notably the rising preference for personalized home decor among millennials and Gen Z, are shaping market trends. M&A activity, although not excessively high, is focused on expanding product portfolios and geographical reach.
- Market Concentration: Moderately fragmented, with top 10 players holding approximately xx% market share in 2024.
- Technological Innovation: Focus on eco-friendly materials, digital printing for customization, and smart wall coverings.
- Regulatory Landscape: Stringent environmental regulations driving adoption of sustainable materials.
- Competitive Substitutes: Paint and other surface treatments pose significant competition.
- End-User Demographics: Growing demand driven by millennial and Gen Z home décor preferences.
- M&A Activity: xx deals recorded between 2019-2024, primarily focused on expansion and diversification.
Wall Covering Industry Growth Trends & Insights
The global wall covering market demonstrates robust growth, fueled by escalating disposable incomes, rapid urbanization, and a heightened appreciation for aesthetically pleasing home interiors. Market projections indicate substantial expansion, reaching an estimated [Insert Updated Market Size in Units] by 2033, exhibiting a Compound Annual Growth Rate (CAGR) of [Insert Updated CAGR]% during the forecast period (2025-2033). This growth trajectory is further accelerated by technological advancements, such as the integration of smart functionalities and personalized design capabilities into wall coverings. Simultaneously, the increasing consumer demand for eco-conscious and sustainable products is fundamentally reshaping the industry landscape. E-commerce platforms and personalized design consultations are increasingly influencing consumer purchasing behavior, leading to a more dynamic and customer-centric market.
Dominant Regions, Countries, or Segments in Wall Covering Industry
North America and Europe currently dominate the wall covering market, driven by high disposable incomes and established home improvement cultures. However, Asia-Pacific is projected to experience the fastest growth, fueled by rapid urbanization and rising middle-class populations. Within the segmentation analysis, the Specialty Store distribution channel shows strong performance due to its focus on customized solutions and higher-value products. Wall paper remains the dominant product type, though wall panels and other innovative materials are gaining traction. The residential segment dominates market share, but the commercial segment shows promising growth potential.
- Leading Region: North America
- Fastest-Growing Region: Asia-Pacific
- Dominant Distribution Channel: Specialty Stores
- Dominant Product Type: Wallpaper
- Dominant Application: Residential
Wall Covering Industry Product Landscape
The wall covering industry offers a diverse range of products, including traditional wallpaper, innovative wall panels, and specialized materials such as tile and metal wall coverings. Recent innovations focus on enhanced durability, easy installation, and eco-friendly compositions. Key selling propositions include customization options, high design aesthetics, and improved performance characteristics. Technological advancements such as digital printing, smart functionalities, and self-adhesive options are constantly enriching the product portfolio.
Key Drivers, Barriers & Challenges in Wall Covering Industry
Key Drivers:
- Rising disposable incomes and the continued expansion of urban populations globally.
- A surge in interest in home improvement projects and interior design, driving demand for aesthetically appealing and functional wall coverings.
- Significant advancements in materials science and manufacturing processes, leading to the creation of innovative and high-performance wall coverings.
- The burgeoning market for sustainable and eco-friendly wall coverings, catering to environmentally conscious consumers.
- Increased adoption of digital printing technologies, enabling greater design flexibility and customization.
Key Challenges:
- Volatility in raw material prices, impacting production costs and profitability.
- Intense competition from alternative wall covering materials and solutions.
- Compliance with increasingly stringent environmental regulations and sustainability standards.
- Supply chain disruptions, including logistics bottlenecks and material shortages, impacting production and distribution timelines. These factors contributed to a [Insert Updated Percentage]% reduction in output in 2022, highlighting the need for robust supply chain resilience.
- Fluctuations in global economic conditions impacting consumer spending on non-essential home improvements.
Emerging Opportunities in Wall Covering Industry
Significant opportunities exist in expanding into untapped markets, particularly in rapidly developing economies. The development of innovative product applications, such as smart wall coverings integrating technology and aesthetics, presents substantial growth potential. The demand for personalized and sustainable solutions continues to grow, opening avenues for customized products and services. The integration of smart home technology offers a compelling pathway for innovation and increased market penetration.
Growth Accelerators in the Wall Covering Industry
Technological advancements, such as breakthroughs in digital printing and the development of highly durable and sustainable materials, are critical growth drivers. Strategic partnerships to expand distribution networks and diversify product lines are also playing a significant role. Market expansion into new geographic regions and a focus on niche applications, including commercial spaces with specific functional requirements, represent key areas for growth.
Key Players Shaping the Wall Covering Industry Market
- Brewster Home Fashion
- Ahlstrom-Munksjö Oyj
- Adfors (Saint Gobain)
- A S Création Tapeten AG
- Walker Greenbank PLC
- Grandeco Wallfashion Group
- Benjamin Moore & Co
- J Josephson Inc
- Asian Paints Ltd
- York Wallcoverings Inc
Notable Milestones in Wall Covering Industry Sector
- May 2023: Asian Paints launched its Homes Studio in Chennai and a new 2023 home decor collection, demonstrating a commitment to expanding its reach and product offerings.
- August 2022: Sanderson Design Group partnered with Disney, creating lucrative licensing opportunities and expanding its product lines with popular Disney themes, showcasing successful brand collaborations in the market.
- [Add another milestone with date and brief description]
In-Depth Wall Covering Industry Market Outlook
The wall covering industry is poised for continued growth, driven by technological advancements, expanding product portfolios, and growing consumer demand. Strategic partnerships and market expansion into emerging economies will be crucial for success in the coming years. The market is expected to witness a shift towards personalized, sustainable, and technologically integrated wall coverings, presenting significant opportunities for innovative players.
Wall Covering Industry Segmentation
-
1. Product Type
- 1.1. Wall Panel
-
1.2. Wall Paper
- 1.2.1. Vinyl Wallpaper
- 1.2.2. Non-woven Wallpaper
- 1.2.3. Paper-based Wallpaper
- 1.2.4. Fabric Wallpaper
- 1.2.5. Other Wallpaper Types
- 1.3. Tile
- 1.4. Metal Wall Covering
- 1.5. Other Product Types
-
2. Application
- 2.1. Commercial
- 2.2. Residential
-
3. Distribution Channel
- 3.1. Specialty Store
- 3.2. Home Center
- 3.3. Building Material Dealer
- 3.4. Furniture Store
- 3.5. Mass Merchandizer
- 3.6. E-commerce
- 3.7. Other Distribution Channels
Wall Covering Industry Segmentation By Geography
-
1. North America
- 1.1. United States
- 1.2. Canada
-
2. Europe
- 2.1. United Kingdom
- 2.2. Germany
- 2.3. France
- 2.4. Spain
- 2.5. Italy
-
3. Asia Pacific
- 3.1. China
- 3.2. India
- 3.3. Japan
- 4. Australia and New Zealand
-
5. Latin America
- 5.1. Brazil
- 5.2. Mexico
- 5.3. Argentina
-
6. Middle East and Africa
- 6.1. Saudi Arabia
- 6.2. United Arab Emirates
- 6.3. South Africa
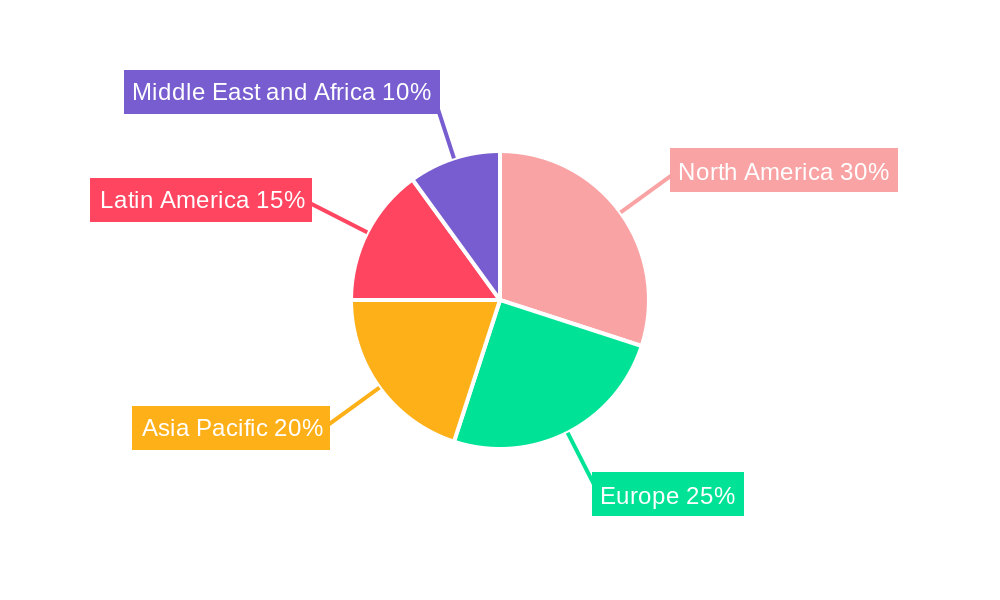
Wall Covering Industry Regional Market Share
Geographic Coverage of Wall Covering Industry
Wall Covering Industry REPORT HIGHLIGHTS
| Aspects | Details |
|---|---|
| Study Period | 2020-2034 |
| Base Year | 2025 |
| Estimated Year | 2026 |
| Forecast Period | 2026-2034 |
| Historical Period | 2020-2025 |
| Growth Rate | CAGR of 4.47% from 2020-2034 |
| Segmentation |
|
Table of Contents
- 1. Introduction
- 1.1. Research Scope
- 1.2. Market Segmentation
- 1.3. Research Objective
- 1.4. Definitions and Assumptions
- 2. Executive Summary
- 2.1. Market Snapshot
- 3. Market Dynamics
- 3.1. Market Drivers
- 3.2. Market Restrains
- 3.3. Market Trends
- 3.4. Market Opportunities
- 4. Market Factor Analysis
- 4.1. Porters Five Forces
- 4.1.1. Bargaining Power of Suppliers
- 4.1.2. Bargaining Power of Buyers
- 4.1.3. Threat of New Entrants
- 4.1.4. Threat of Substitutes
- 4.1.5. Competitive Rivalry
- 4.2. PESTEL analysis
- 4.3. BCG Analysis
- 4.3.1. Stars (High Growth, High Market Share)
- 4.3.2. Cash Cows (Low Growth, High Market Share)
- 4.3.3. Question Mark (High Growth, Low Market Share)
- 4.3.4. Dogs (Low Growth, Low Market Share)
- 4.4. Ansoff Matrix Analysis
- 4.5. Supply Chain Analysis
- 4.6. Regulatory Landscape
- 4.7. Current Market Potential and Opportunity Assessment (TAM–SAM–SOM Framework)
- 4.8. NRP Analyst Note
- 4.1. Porters Five Forces
- 5. Market Analysis, Insights and Forecast 2021-2033
- 5.1. Market Analysis, Insights and Forecast - by Product Type
- 5.1.1. Wall Panel
- 5.1.2. Wall Paper
- 5.1.2.1. Vinyl Wallpaper
- 5.1.2.2. Non-woven Wallpaper
- 5.1.2.3. Paper-based Wallpaper
- 5.1.2.4. Fabric Wallpaper
- 5.1.2.5. Other Wallpaper Types
- 5.1.3. Tile
- 5.1.4. Metal Wall Covering
- 5.1.5. Other Product Types
- 5.2. Market Analysis, Insights and Forecast - by Application
- 5.2.1. Commercial
- 5.2.2. Residential
- 5.3. Market Analysis, Insights and Forecast - by Distribution Channel
- 5.3.1. Specialty Store
- 5.3.2. Home Center
- 5.3.3. Building Material Dealer
- 5.3.4. Furniture Store
- 5.3.5. Mass Merchandizer
- 5.3.6. E-commerce
- 5.3.7. Other Distribution Channels
- 5.4. Market Analysis, Insights and Forecast - by Region
- 5.4.1. North America
- 5.4.2. Europe
- 5.4.3. Asia Pacific
- 5.4.4. Australia and New Zealand
- 5.4.5. Latin America
- 5.4.6. Middle East and Africa
- 5.1. Market Analysis, Insights and Forecast - by Product Type
- 6. Global Wall Covering Industry Analysis, Insights and Forecast, 2021-2033
- 6.1. Market Analysis, Insights and Forecast - by Product Type
- 6.1.1. Wall Panel
- 6.1.2. Wall Paper
- 6.1.2.1. Vinyl Wallpaper
- 6.1.2.2. Non-woven Wallpaper
- 6.1.2.3. Paper-based Wallpaper
- 6.1.2.4. Fabric Wallpaper
- 6.1.2.5. Other Wallpaper Types
- 6.1.3. Tile
- 6.1.4. Metal Wall Covering
- 6.1.5. Other Product Types
- 6.2. Market Analysis, Insights and Forecast - by Application
- 6.2.1. Commercial
- 6.2.2. Residential
- 6.3. Market Analysis, Insights and Forecast - by Distribution Channel
- 6.3.1. Specialty Store
- 6.3.2. Home Center
- 6.3.3. Building Material Dealer
- 6.3.4. Furniture Store
- 6.3.5. Mass Merchandizer
- 6.3.6. E-commerce
- 6.3.7. Other Distribution Channels
- 6.1. Market Analysis, Insights and Forecast - by Product Type
- 7. North America Wall Covering Industry Analysis, Insights and Forecast, 2020-2032
- 7.1. Market Analysis, Insights and Forecast - by Product Type
- 7.1.1. Wall Panel
- 7.1.2. Wall Paper
- 7.1.2.1. Vinyl Wallpaper
- 7.1.2.2. Non-woven Wallpaper
- 7.1.2.3. Paper-based Wallpaper
- 7.1.2.4. Fabric Wallpaper
- 7.1.2.5. Other Wallpaper Types
- 7.1.3. Tile
- 7.1.4. Metal Wall Covering
- 7.1.5. Other Product Types
- 7.2. Market Analysis, Insights and Forecast - by Application
- 7.2.1. Commercial
- 7.2.2. Residential
- 7.3. Market Analysis, Insights and Forecast - by Distribution Channel
- 7.3.1. Specialty Store
- 7.3.2. Home Center
- 7.3.3. Building Material Dealer
- 7.3.4. Furniture Store
- 7.3.5. Mass Merchandizer
- 7.3.6. E-commerce
- 7.3.7. Other Distribution Channels
- 7.1. Market Analysis, Insights and Forecast - by Product Type
- 8. Europe Wall Covering Industry Analysis, Insights and Forecast, 2020-2032
- 8.1. Market Analysis, Insights and Forecast - by Product Type
- 8.1.1. Wall Panel
- 8.1.2. Wall Paper
- 8.1.2.1. Vinyl Wallpaper
- 8.1.2.2. Non-woven Wallpaper
- 8.1.2.3. Paper-based Wallpaper
- 8.1.2.4. Fabric Wallpaper
- 8.1.2.5. Other Wallpaper Types
- 8.1.3. Tile
- 8.1.4. Metal Wall Covering
- 8.1.5. Other Product Types
- 8.2. Market Analysis, Insights and Forecast - by Application
- 8.2.1. Commercial
- 8.2.2. Residential
- 8.3. Market Analysis, Insights and Forecast - by Distribution Channel
- 8.3.1. Specialty Store
- 8.3.2. Home Center
- 8.3.3. Building Material Dealer
- 8.3.4. Furniture Store
- 8.3.5. Mass Merchandizer
- 8.3.6. E-commerce
- 8.3.7. Other Distribution Channels
- 8.1. Market Analysis, Insights and Forecast - by Product Type
- 9. Asia Pacific Wall Covering Industry Analysis, Insights and Forecast, 2020-2032
- 9.1. Market Analysis, Insights and Forecast - by Product Type
- 9.1.1. Wall Panel
- 9.1.2. Wall Paper
- 9.1.2.1. Vinyl Wallpaper
- 9.1.2.2. Non-woven Wallpaper
- 9.1.2.3. Paper-based Wallpaper
- 9.1.2.4. Fabric Wallpaper
- 9.1.2.5. Other Wallpaper Types
- 9.1.3. Tile
- 9.1.4. Metal Wall Covering
- 9.1.5. Other Product Types
- 9.2. Market Analysis, Insights and Forecast - by Application
- 9.2.1. Commercial
- 9.2.2. Residential
- 9.3. Market Analysis, Insights and Forecast - by Distribution Channel
- 9.3.1. Specialty Store
- 9.3.2. Home Center
- 9.3.3. Building Material Dealer
- 9.3.4. Furniture Store
- 9.3.5. Mass Merchandizer
- 9.3.6. E-commerce
- 9.3.7. Other Distribution Channels
- 9.1. Market Analysis, Insights and Forecast - by Product Type
- 10. Australia and New Zealand Wall Covering Industry Analysis, Insights and Forecast, 2020-2032
- 10.1. Market Analysis, Insights and Forecast - by Product Type
- 10.1.1. Wall Panel
- 10.1.2. Wall Paper
- 10.1.2.1. Vinyl Wallpaper
- 10.1.2.2. Non-woven Wallpaper
- 10.1.2.3. Paper-based Wallpaper
- 10.1.2.4. Fabric Wallpaper
- 10.1.2.5. Other Wallpaper Types
- 10.1.3. Tile
- 10.1.4. Metal Wall Covering
- 10.1.5. Other Product Types
- 10.2. Market Analysis, Insights and Forecast - by Application
- 10.2.1. Commercial
- 10.2.2. Residential
- 10.3. Market Analysis, Insights and Forecast - by Distribution Channel
- 10.3.1. Specialty Store
- 10.3.2. Home Center
- 10.3.3. Building Material Dealer
- 10.3.4. Furniture Store
- 10.3.5. Mass Merchandizer
- 10.3.6. E-commerce
- 10.3.7. Other Distribution Channels
- 10.1. Market Analysis, Insights and Forecast - by Product Type
- 11. Latin America Wall Covering Industry Analysis, Insights and Forecast, 2020-2032
- 11.1. Market Analysis, Insights and Forecast - by Product Type
- 11.1.1. Wall Panel
- 11.1.2. Wall Paper
- 11.1.2.1. Vinyl Wallpaper
- 11.1.2.2. Non-woven Wallpaper
- 11.1.2.3. Paper-based Wallpaper
- 11.1.2.4. Fabric Wallpaper
- 11.1.2.5. Other Wallpaper Types
- 11.1.3. Tile
- 11.1.4. Metal Wall Covering
- 11.1.5. Other Product Types
- 11.2. Market Analysis, Insights and Forecast - by Application
- 11.2.1. Commercial
- 11.2.2. Residential
- 11.3. Market Analysis, Insights and Forecast - by Distribution Channel
- 11.3.1. Specialty Store
- 11.3.2. Home Center
- 11.3.3. Building Material Dealer
- 11.3.4. Furniture Store
- 11.3.5. Mass Merchandizer
- 11.3.6. E-commerce
- 11.3.7. Other Distribution Channels
- 11.1. Market Analysis, Insights and Forecast - by Product Type
- 12. Middle East and Africa Wall Covering Industry Analysis, Insights and Forecast, 2020-2032
- 12.1. Market Analysis, Insights and Forecast - by Product Type
- 12.1.1. Wall Panel
- 12.1.2. Wall Paper
- 12.1.2.1. Vinyl Wallpaper
- 12.1.2.2. Non-woven Wallpaper
- 12.1.2.3. Paper-based Wallpaper
- 12.1.2.4. Fabric Wallpaper
- 12.1.2.5. Other Wallpaper Types
- 12.1.3. Tile
- 12.1.4. Metal Wall Covering
- 12.1.5. Other Product Types
- 12.2. Market Analysis, Insights and Forecast - by Application
- 12.2.1. Commercial
- 12.2.2. Residential
- 12.3. Market Analysis, Insights and Forecast - by Distribution Channel
- 12.3.1. Specialty Store
- 12.3.2. Home Center
- 12.3.3. Building Material Dealer
- 12.3.4. Furniture Store
- 12.3.5. Mass Merchandizer
- 12.3.6. E-commerce
- 12.3.7. Other Distribution Channels
- 12.1. Market Analysis, Insights and Forecast - by Product Type
- 13. Competitive Analysis
- 13.1. Company Profiles
- 13.1.1 Brewster Home Fashion
- 13.1.1.1. Company Overview
- 13.1.1.2. Products
- 13.1.1.3. Company Financials
- 13.1.1.4. SWOT Analysis
- 13.1.2 Ahlstrom-Munksjö Oyj
- 13.1.2.1. Company Overview
- 13.1.2.2. Products
- 13.1.2.3. Company Financials
- 13.1.2.4. SWOT Analysis
- 13.1.3 Adfors (Saint Gobain)
- 13.1.3.1. Company Overview
- 13.1.3.2. Products
- 13.1.3.3. Company Financials
- 13.1.3.4. SWOT Analysis
- 13.1.4 A S Création Tapeten AG
- 13.1.4.1. Company Overview
- 13.1.4.2. Products
- 13.1.4.3. Company Financials
- 13.1.4.4. SWOT Analysis
- 13.1.5 Walker Greenbank PLC
- 13.1.5.1. Company Overview
- 13.1.5.2. Products
- 13.1.5.3. Company Financials
- 13.1.5.4. SWOT Analysis
- 13.1.6 Grandeco Wallfashion Group
- 13.1.6.1. Company Overview
- 13.1.6.2. Products
- 13.1.6.3. Company Financials
- 13.1.6.4. SWOT Analysis
- 13.1.7 Benjamin Moore & Co
- 13.1.7.1. Company Overview
- 13.1.7.2. Products
- 13.1.7.3. Company Financials
- 13.1.7.4. SWOT Analysis
- 13.1.8 J Josephson Inc
- 13.1.8.1. Company Overview
- 13.1.8.2. Products
- 13.1.8.3. Company Financials
- 13.1.8.4. SWOT Analysis
- 13.1.9 Asian Paints Ltd
- 13.1.9.1. Company Overview
- 13.1.9.2. Products
- 13.1.9.3. Company Financials
- 13.1.9.4. SWOT Analysis
- 13.1.10 York Wallcoverings Inc
- 13.1.10.1. Company Overview
- 13.1.10.2. Products
- 13.1.10.3. Company Financials
- 13.1.10.4. SWOT Analysis
- 13.1.1 Brewster Home Fashion
- 13.2. Market Entropy
- 13.2.1 Company's Key Areas Served
- 13.2.2 Recent Developments
- 13.3. Company Market Share Analysis 2025
- 13.3.1 Top 5 Companies Market Share Analysis
- 13.3.2 Top 3 Companies Market Share Analysis
- 13.4. List of Potential Customers
- 14. Research Methodology
List of Figures
- Figure 1: Global Wall Covering Industry Revenue Breakdown (Million, %) by Region 2025 & 2033
- Figure 2: North America Wall Covering Industry Revenue (Million), by Product Type 2025 & 2033
- Figure 3: North America Wall Covering Industry Revenue Share (%), by Product Type 2025 & 2033
- Figure 4: North America Wall Covering Industry Revenue (Million), by Application 2025 & 2033
- Figure 5: North America Wall Covering Industry Revenue Share (%), by Application 2025 & 2033
- Figure 6: North America Wall Covering Industry Revenue (Million), by Distribution Channel 2025 & 2033
- Figure 7: North America Wall Covering Industry Revenue Share (%), by Distribution Channel 2025 & 2033
- Figure 8: North America Wall Covering Industry Revenue (Million), by Country 2025 & 2033
- Figure 9: North America Wall Covering Industry Revenue Share (%), by Country 2025 & 2033
- Figure 10: Europe Wall Covering Industry Revenue (Million), by Product Type 2025 & 2033
- Figure 11: Europe Wall Covering Industry Revenue Share (%), by Product Type 2025 & 2033
- Figure 12: Europe Wall Covering Industry Revenue (Million), by Application 2025 & 2033
- Figure 13: Europe Wall Covering Industry Revenue Share (%), by Application 2025 & 2033
- Figure 14: Europe Wall Covering Industry Revenue (Million), by Distribution Channel 2025 & 2033
- Figure 15: Europe Wall Covering Industry Revenue Share (%), by Distribution Channel 2025 & 2033
- Figure 16: Europe Wall Covering Industry Revenue (Million), by Country 2025 & 2033
- Figure 17: Europe Wall Covering Industry Revenue Share (%), by Country 2025 & 2033
- Figure 18: Asia Pacific Wall Covering Industry Revenue (Million), by Product Type 2025 & 2033
- Figure 19: Asia Pacific Wall Covering Industry Revenue Share (%), by Product Type 2025 & 2033
- Figure 20: Asia Pacific Wall Covering Industry Revenue (Million), by Application 2025 & 2033
- Figure 21: Asia Pacific Wall Covering Industry Revenue Share (%), by Application 2025 & 2033
- Figure 22: Asia Pacific Wall Covering Industry Revenue (Million), by Distribution Channel 2025 & 2033
- Figure 23: Asia Pacific Wall Covering Industry Revenue Share (%), by Distribution Channel 2025 & 2033
- Figure 24: Asia Pacific Wall Covering Industry Revenue (Million), by Country 2025 & 2033
- Figure 25: Asia Pacific Wall Covering Industry Revenue Share (%), by Country 2025 & 2033
- Figure 26: Australia and New Zealand Wall Covering Industry Revenue (Million), by Product Type 2025 & 2033
- Figure 27: Australia and New Zealand Wall Covering Industry Revenue Share (%), by Product Type 2025 & 2033
- Figure 28: Australia and New Zealand Wall Covering Industry Revenue (Million), by Application 2025 & 2033
- Figure 29: Australia and New Zealand Wall Covering Industry Revenue Share (%), by Application 2025 & 2033
- Figure 30: Australia and New Zealand Wall Covering Industry Revenue (Million), by Distribution Channel 2025 & 2033
- Figure 31: Australia and New Zealand Wall Covering Industry Revenue Share (%), by Distribution Channel 2025 & 2033
- Figure 32: Australia and New Zealand Wall Covering Industry Revenue (Million), by Country 2025 & 2033
- Figure 33: Australia and New Zealand Wall Covering Industry Revenue Share (%), by Country 2025 & 2033
- Figure 34: Latin America Wall Covering Industry Revenue (Million), by Product Type 2025 & 2033
- Figure 35: Latin America Wall Covering Industry Revenue Share (%), by Product Type 2025 & 2033
- Figure 36: Latin America Wall Covering Industry Revenue (Million), by Application 2025 & 2033
- Figure 37: Latin America Wall Covering Industry Revenue Share (%), by Application 2025 & 2033
- Figure 38: Latin America Wall Covering Industry Revenue (Million), by Distribution Channel 2025 & 2033
- Figure 39: Latin America Wall Covering Industry Revenue Share (%), by Distribution Channel 2025 & 2033
- Figure 40: Latin America Wall Covering Industry Revenue (Million), by Country 2025 & 2033
- Figure 41: Latin America Wall Covering Industry Revenue Share (%), by Country 2025 & 2033
- Figure 42: Middle East and Africa Wall Covering Industry Revenue (Million), by Product Type 2025 & 2033
- Figure 43: Middle East and Africa Wall Covering Industry Revenue Share (%), by Product Type 2025 & 2033
- Figure 44: Middle East and Africa Wall Covering Industry Revenue (Million), by Application 2025 & 2033
- Figure 45: Middle East and Africa Wall Covering Industry Revenue Share (%), by Application 2025 & 2033
- Figure 46: Middle East and Africa Wall Covering Industry Revenue (Million), by Distribution Channel 2025 & 2033
- Figure 47: Middle East and Africa Wall Covering Industry Revenue Share (%), by Distribution Channel 2025 & 2033
- Figure 48: Middle East and Africa Wall Covering Industry Revenue (Million), by Country 2025 & 2033
- Figure 49: Middle East and Africa Wall Covering Industry Revenue Share (%), by Country 2025 & 2033
List of Tables
- Table 1: Global Wall Covering Industry Revenue Million Forecast, by Product Type 2020 & 2033
- Table 2: Global Wall Covering Industry Revenue Million Forecast, by Application 2020 & 2033
- Table 3: Global Wall Covering Industry Revenue Million Forecast, by Distribution Channel 2020 & 2033
- Table 4: Global Wall Covering Industry Revenue Million Forecast, by Region 2020 & 2033
- Table 5: Global Wall Covering Industry Revenue Million Forecast, by Product Type 2020 & 2033
- Table 6: Global Wall Covering Industry Revenue Million Forecast, by Application 2020 & 2033
- Table 7: Global Wall Covering Industry Revenue Million Forecast, by Distribution Channel 2020 & 2033
- Table 8: Global Wall Covering Industry Revenue Million Forecast, by Country 2020 & 2033
- Table 9: United States Wall Covering Industry Revenue (Million) Forecast, by Application 2020 & 2033
- Table 10: Canada Wall Covering Industry Revenue (Million) Forecast, by Application 2020 & 2033
- Table 11: Global Wall Covering Industry Revenue Million Forecast, by Product Type 2020 & 2033
- Table 12: Global Wall Covering Industry Revenue Million Forecast, by Application 2020 & 2033
- Table 13: Global Wall Covering Industry Revenue Million Forecast, by Distribution Channel 2020 & 2033
- Table 14: Global Wall Covering Industry Revenue Million Forecast, by Country 2020 & 2033
- Table 15: United Kingdom Wall Covering Industry Revenue (Million) Forecast, by Application 2020 & 2033
- Table 16: Germany Wall Covering Industry Revenue (Million) Forecast, by Application 2020 & 2033
- Table 17: France Wall Covering Industry Revenue (Million) Forecast, by Application 2020 & 2033
- Table 18: Spain Wall Covering Industry Revenue (Million) Forecast, by Application 2020 & 2033
- Table 19: Italy Wall Covering Industry Revenue (Million) Forecast, by Application 2020 & 2033
- Table 20: Global Wall Covering Industry Revenue Million Forecast, by Product Type 2020 & 2033
- Table 21: Global Wall Covering Industry Revenue Million Forecast, by Application 2020 & 2033
- Table 22: Global Wall Covering Industry Revenue Million Forecast, by Distribution Channel 2020 & 2033
- Table 23: Global Wall Covering Industry Revenue Million Forecast, by Country 2020 & 2033
- Table 24: China Wall Covering Industry Revenue (Million) Forecast, by Application 2020 & 2033
- Table 25: India Wall Covering Industry Revenue (Million) Forecast, by Application 2020 & 2033
- Table 26: Japan Wall Covering Industry Revenue (Million) Forecast, by Application 2020 & 2033
- Table 27: Global Wall Covering Industry Revenue Million Forecast, by Product Type 2020 & 2033
- Table 28: Global Wall Covering Industry Revenue Million Forecast, by Application 2020 & 2033
- Table 29: Global Wall Covering Industry Revenue Million Forecast, by Distribution Channel 2020 & 2033
- Table 30: Global Wall Covering Industry Revenue Million Forecast, by Country 2020 & 2033
- Table 31: Global Wall Covering Industry Revenue Million Forecast, by Product Type 2020 & 2033
- Table 32: Global Wall Covering Industry Revenue Million Forecast, by Application 2020 & 2033
- Table 33: Global Wall Covering Industry Revenue Million Forecast, by Distribution Channel 2020 & 2033
- Table 34: Global Wall Covering Industry Revenue Million Forecast, by Country 2020 & 2033
- Table 35: Brazil Wall Covering Industry Revenue (Million) Forecast, by Application 2020 & 2033
- Table 36: Mexico Wall Covering Industry Revenue (Million) Forecast, by Application 2020 & 2033
- Table 37: Argentina Wall Covering Industry Revenue (Million) Forecast, by Application 2020 & 2033
- Table 38: Global Wall Covering Industry Revenue Million Forecast, by Product Type 2020 & 2033
- Table 39: Global Wall Covering Industry Revenue Million Forecast, by Application 2020 & 2033
- Table 40: Global Wall Covering Industry Revenue Million Forecast, by Distribution Channel 2020 & 2033
- Table 41: Global Wall Covering Industry Revenue Million Forecast, by Country 2020 & 2033
- Table 42: Saudi Arabia Wall Covering Industry Revenue (Million) Forecast, by Application 2020 & 2033
- Table 43: United Arab Emirates Wall Covering Industry Revenue (Million) Forecast, by Application 2020 & 2033
- Table 44: South Africa Wall Covering Industry Revenue (Million) Forecast, by Application 2020 & 2033
Frequently Asked Questions
1. What is the projected Compound Annual Growth Rate (CAGR) of the Wall Covering Industry?
The projected CAGR is approximately 4.47%.
2. Which companies are prominent players in the Wall Covering Industry?
Key companies in the market include Brewster Home Fashion, Ahlstrom-Munksjö Oyj, Adfors (Saint Gobain), A S Création Tapeten AG, Walker Greenbank PLC, Grandeco Wallfashion Group, Benjamin Moore & Co, J Josephson Inc, Asian Paints Ltd, York Wallcoverings Inc.
3. What are the main segments of the Wall Covering Industry?
The market segments include Product Type, Application, Distribution Channel.
4. Can you provide details about the market size?
The market size is estimated to be USD 39.63 Million as of 2022.
5. What are some drivers contributing to market growth?
Increasing Number of Residential Buildings; Availability of Styled Products; Increase in Do-it-yourself (DIY) Trends.
6. What are the notable trends driving market growth?
Wall Panel Segment is Expected Hold Significant Market Share.
7. Are there any restraints impacting market growth?
Limiting Availability and High Cost of Raw Materials.
8. Can you provide examples of recent developments in the market?
May 2023: Asian Paints announced the launch of the homes studio in Chennai and the 2023 collection for home decor. The studio offers a garden selection of fabrics, wallpapers, bedding, and rugs.
9. What pricing options are available for accessing the report?
Pricing options include single-user, multi-user, and enterprise licenses priced at USD 4750, USD 5250, and USD 8750 respectively.
10. Is the market size provided in terms of value or volume?
The market size is provided in terms of value, measured in Million.
11. Are there any specific market keywords associated with the report?
Yes, the market keyword associated with the report is "Wall Covering Industry," which aids in identifying and referencing the specific market segment covered.
12. How do I determine which pricing option suits my needs best?
The pricing options vary based on user requirements and access needs. Individual users may opt for single-user licenses, while businesses requiring broader access may choose multi-user or enterprise licenses for cost-effective access to the report.
13. Are there any additional resources or data provided in the Wall Covering Industry report?
While the report offers comprehensive insights, it's advisable to review the specific contents or supplementary materials provided to ascertain if additional resources or data are available.
14. How can I stay updated on further developments or reports in the Wall Covering Industry?
To stay informed about further developments, trends, and reports in the Wall Covering Industry, consider subscribing to industry newsletters, following relevant companies and organizations, or regularly checking reputable industry news sources and publications.
Methodology
Step 1 - Identification of Relevant Samples Size from Population Database


Step 2 - Approaches for Defining Global Market Size (Value, Volume* & Price*)

Note*: In applicable scenarios
Step 3 - Data Sources
Primary Research
- Web Analytics
- Survey Reports
- Research Institute
- Latest Research Reports
- Opinion Leaders
Secondary Research
- Annual Reports
- White Paper
- Latest Press Release
- Industry Association
- Paid Database
- Investor Presentations

Step 4 - Data Triangulation
Involves using different sources of information in order to increase the validity of a study
These sources are likely to be stakeholders in a program - participants, other researchers, program staff, other community members, and so on.
Then we put all data in single framework & apply various statistical tools to find out the dynamic on the market.
During the analysis stage, feedback from the stakeholder groups would be compared to determine areas of agreement as well as areas of divergence