

Key Insights
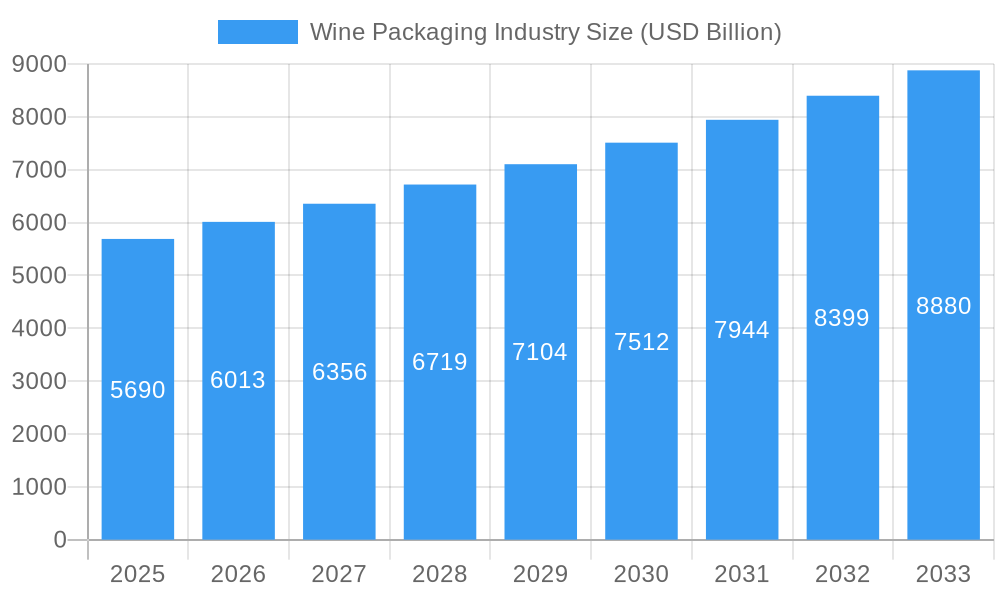
The global wine packaging market, valued at $5.69 billion in 2025, is projected to experience robust growth, driven by a compound annual growth rate (CAGR) of 5.48% from 2025 to 2033. This expansion is fueled by several key factors. Firstly, the increasing global consumption of wine, particularly in emerging markets, necessitates efficient and attractive packaging solutions. Secondly, the growing demand for premium and sustainable packaging options, such as lightweight glass bottles and eco-friendly alternatives like bag-in-box packaging, is significantly impacting market dynamics. Furthermore, advancements in packaging technology, including improved barrier properties and tamper-evident closures, are contributing to market growth. Finally, the wine industry's focus on brand differentiation and enhanced consumer experiences through innovative packaging designs is driving innovation and market expansion.
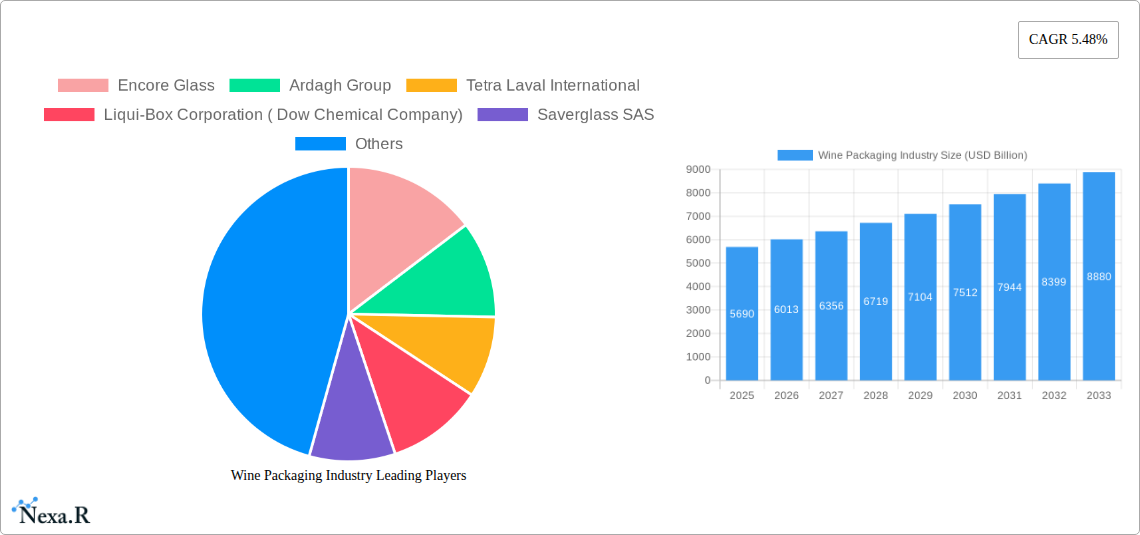
Wine Packaging Industry Market Size (In Billion)
The market is segmented by material type (glass, plastic, metal, paperboard) and product type (glass bottles, plastic bottles, bag-in-box, others). Glass bottles currently dominate the market due to their perceived quality and association with premium wines; however, plastic bottles and bag-in-box solutions are gaining traction due to cost-effectiveness and sustainability concerns. Regional analysis reveals strong growth in Asia-Pacific and North America, driven by increasing wine consumption and disposable incomes. However, Europe, a traditionally dominant region, will continue to contribute significantly to overall market revenue due to established wine production and consumption patterns. Competition in this market is fierce, with major players like Ardagh Group, Tetra Laval International, and Owens-Illinois vying for market share through product innovation, strategic partnerships, and expansion into emerging markets. The forecast period (2025-2033) anticipates sustained growth, although the exact rate may be influenced by macroeconomic factors and changing consumer preferences.
Wine Packaging Industry Company Market Share
This comprehensive report provides a detailed analysis of the global wine packaging industry, encompassing market dynamics, growth trends, key players, and future outlook. With a study period spanning 2019-2033, a base year of 2025, and a forecast period of 2025-2033, this report is an invaluable resource for industry professionals, investors, and strategists seeking to navigate this dynamic market. The total market size is projected to reach xx Billion USD by 2033.
Wine Packaging Industry Market Dynamics & Structure
The wine packaging market is characterized by moderate concentration, with several major players holding significant market share. Technological innovation, driven by sustainability concerns and evolving consumer preferences, is a key driver. Stringent regulatory frameworks concerning material safety and recyclability influence packaging choices. The market also witnesses considerable competition from substitute products, particularly in the areas of flexible packaging. End-user demographics (e.g., age, income, location) significantly impact packaging preferences, influencing the demand for premium vs. cost-effective solutions. Mergers and acquisitions (M&A) activity remains steady, with larger companies acquiring smaller firms to expand their product portfolios and geographical reach.
- Market Concentration: Moderately concentrated, with top 5 players holding approximately xx% market share in 2025.
- Technological Innovation: Focus on lightweighting, sustainability (recycled materials, reduced carbon footprint), and improved barrier properties.
- Regulatory Frameworks: Increasing emphasis on recyclability, compostability, and reduction of material usage.
- Competitive Product Substitutes: Growth of flexible packaging (bag-in-box, pouches) challenges traditional glass and plastic bottles.
- End-User Demographics: Growing demand for premium packaging among affluent consumers, while price-sensitive consumers drive demand for cost-effective options.
- M&A Trends: Consistent M&A activity, driven by expansion strategies and technological acquisition. Estimated xx deals in the period 2019-2024, averaging xx Billion USD annually.
Wine Packaging Industry Growth Trends & Insights
The global wine packaging market experienced robust growth between 2019 and 2024, driven by factors including the increasing consumption of wine globally, the expansion of the e-commerce wine market, and the growing demand for sustainable and innovative packaging solutions. The market is projected to maintain a steady growth trajectory throughout the forecast period (2025-2033), exhibiting a Compound Annual Growth Rate (CAGR) of xx%. Technological disruptions, such as the introduction of lightweight and eco-friendly materials, are accelerating market growth. Consumer behavior is shifting towards premium packaging, increasing demand for aesthetically appealing and sustainable options. Market penetration of sustainable packaging is expected to increase from xx% in 2025 to xx% by 2033.
Dominant Regions, Countries, or Segments in Wine Packaging Industry
The North American and European markets currently dominate the wine packaging industry, driven by high wine consumption and established production bases. However, Asia-Pacific is witnessing the fastest growth rate, fueled by rising disposable incomes and increasing wine consumption, particularly in China. Within material types, glass remains the dominant segment due to its perceived quality and aesthetic appeal, followed by plastic for its cost-effectiveness. The bag-in-box segment is experiencing significant growth due to its cost-effectiveness and sustainability features.
- North America: High wine consumption, well-established supply chains, and strong demand for premium packaging.
- Europe: Large wine production base, sophisticated consumer preferences, and focus on sustainable packaging.
- Asia-Pacific: Fastest-growing region, driven by rising disposable incomes and expanding wine markets.
- Material Type: Glass holds the largest market share (xx%), followed by Plastic (xx%), Metal (xx%), and Paperboard (xx%).
- Product Type: Glass bottles (xx%), Plastic bottles (xx%), Bag-in-Box (xx%), and other product types (xx%).
Wine Packaging Industry Product Landscape
The wine packaging market is witnessing continuous innovation, with a focus on sustainable, lightweight, and functional packaging solutions. New materials, such as recycled PET and bioplastics, are gaining traction. Innovative closure systems, offering tamper evidence and improved oxygen barrier properties, are also impacting market trends. Unique selling propositions (USPs) center around sustainability credentials, enhanced brand aesthetics, and improved product protection. Technological advancements include the use of smart packaging technologies, offering traceability and consumer engagement features.
Key Drivers, Barriers & Challenges in Wine Packaging Industry
Key Drivers:
- Growing global wine consumption.
- Increasing demand for sustainable and eco-friendly packaging.
- Rise of e-commerce in the wine industry.
- Technological advancements leading to innovative packaging solutions.
Challenges:
- Fluctuating raw material prices, increasing the cost of production.
- Stringent regulations regarding material safety and recyclability.
- Intense competition among packaging suppliers.
- Supply chain disruptions impacting timely delivery of packaging materials.
Emerging Opportunities in Wine Packaging Industry
- Growing demand for premium packaging solutions in emerging markets.
- Expanding applications of sustainable packaging materials such as recycled PET and bioplastics.
- Increasing use of smart packaging technologies to enhance traceability and consumer engagement.
- Development of innovative packaging formats, such as lightweight glass bottles and flexible pouches, to meet specific consumer needs.
Growth Accelerators in the Wine Packaging Industry
The wine packaging market is poised for continued growth fueled by several factors. Technological advancements in materials science are constantly creating lighter, more sustainable, and protective options. Strategic partnerships between packaging suppliers and wine producers drive innovation and product development. Expanding wine markets in emerging economies presents significant growth opportunities. The increasing focus on sustainable practices within the wine industry further boosts demand for eco-friendly packaging.
Key Players Shaping the Wine Packaging Industry Market
Notable Milestones in Wine Packaging Industry Sector
- December 2022: Orora Glass wins the Wine Industry Impacts Awards (WIIA) Packaging & Design category for its lightweight sparkling wine bottle.
- November 2022: Smurfit Kappa launches a sustainable packaging solution for e-commerce wine sales.
In-Depth Wine Packaging Industry Market Outlook
The wine packaging market is poised for sustained growth, driven by innovation, sustainability, and expansion into new markets. Opportunities abound for companies that can develop and market environmentally friendly and cost-effective solutions. Strategic partnerships and acquisitions will continue to shape the competitive landscape. The long-term outlook remains positive, with significant potential for market expansion and increased value creation.
Wine Packaging Industry Segmentation
-
1. Material Type
- 1.1. Glass
- 1.2. Plastic
- 1.3. Metal
- 1.4. Paper Board
-
2. Product Type
- 2.1. Glass Bottles
- 2.2. Plastic Bottles
- 2.3. Bag in Box
- 2.4. Other Product Types
Wine Packaging Industry Segmentation By Geography
-
1. North America
- 1.1. United States
- 1.2. Canada
-
2. Europe
- 2.1. United Kingdom
- 2.2. Germany
- 2.3. Italy
- 2.4. France
- 2.5. Spain
- 2.6. Rest of Europe
-
3. Asia Pacific
- 3.1. China
- 3.2. Japan
- 3.3. Australia and New Zealand
- 3.4. Rest of Asia Pacific
- 4. Latin America
- 5. Middle East and Africa
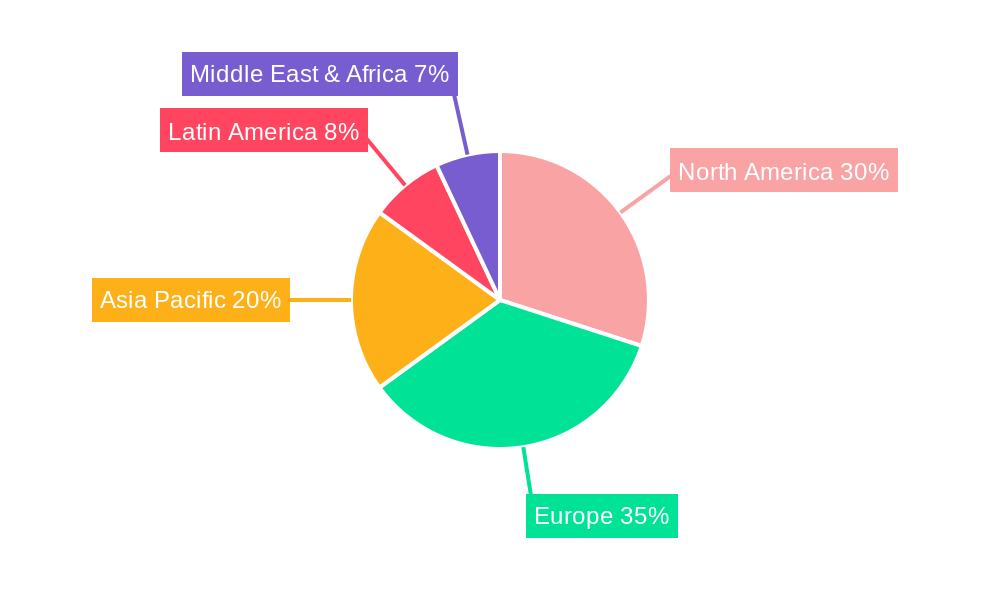
Wine Packaging Industry Regional Market Share
Geographic Coverage of Wine Packaging Industry
Wine Packaging Industry REPORT HIGHLIGHTS
| Aspects | Details |
|---|---|
| Study Period | 2020-2034 |
| Base Year | 2025 |
| Estimated Year | 2026 |
| Forecast Period | 2026-2034 |
| Historical Period | 2020-2025 |
| Growth Rate | CAGR of 5.48% from 2020-2034 |
| Segmentation |
|
Table of Contents
- 1. Introduction
- 1.1. Research Scope
- 1.2. Market Segmentation
- 1.3. Research Objective
- 1.4. Definitions and Assumptions
- 2. Executive Summary
- 2.1. Market Snapshot
- 3. Market Dynamics
- 3.1. Market Drivers
- 3.2. Market Restrains
- 3.3. Market Trends
- 3.4. Market Opportunities
- 4. Market Factor Analysis
- 4.1. Porters Five Forces
- 4.1.1. Bargaining Power of Suppliers
- 4.1.2. Bargaining Power of Buyers
- 4.1.3. Threat of New Entrants
- 4.1.4. Threat of Substitutes
- 4.1.5. Competitive Rivalry
- 4.2. PESTEL analysis
- 4.3. BCG Analysis
- 4.3.1. Stars (High Growth, High Market Share)
- 4.3.2. Cash Cows (Low Growth, High Market Share)
- 4.3.3. Question Mark (High Growth, Low Market Share)
- 4.3.4. Dogs (Low Growth, Low Market Share)
- 4.4. Ansoff Matrix Analysis
- 4.5. Supply Chain Analysis
- 4.6. Regulatory Landscape
- 4.7. Current Market Potential and Opportunity Assessment (TAM–SAM–SOM Framework)
- 4.8. NRP Analyst Note
- 4.1. Porters Five Forces
- 5. Market Analysis, Insights and Forecast 2021-2033
- 5.1. Market Analysis, Insights and Forecast - by Material Type
- 5.1.1. Glass
- 5.1.2. Plastic
- 5.1.3. Metal
- 5.1.4. Paper Board
- 5.2. Market Analysis, Insights and Forecast - by Product Type
- 5.2.1. Glass Bottles
- 5.2.2. Plastic Bottles
- 5.2.3. Bag in Box
- 5.2.4. Other Product Types
- 5.3. Market Analysis, Insights and Forecast - by Region
- 5.3.1. North America
- 5.3.2. Europe
- 5.3.3. Asia Pacific
- 5.3.4. Latin America
- 5.3.5. Middle East and Africa
- 5.1. Market Analysis, Insights and Forecast - by Material Type
- 6. Global Wine Packaging Industry Analysis, Insights and Forecast, 2021-2033
- 6.1. Market Analysis, Insights and Forecast - by Material Type
- 6.1.1. Glass
- 6.1.2. Plastic
- 6.1.3. Metal
- 6.1.4. Paper Board
- 6.2. Market Analysis, Insights and Forecast - by Product Type
- 6.2.1. Glass Bottles
- 6.2.2. Plastic Bottles
- 6.2.3. Bag in Box
- 6.2.4. Other Product Types
- 6.1. Market Analysis, Insights and Forecast - by Material Type
- 7. North America Wine Packaging Industry Analysis, Insights and Forecast, 2020-2032
- 7.1. Market Analysis, Insights and Forecast - by Material Type
- 7.1.1. Glass
- 7.1.2. Plastic
- 7.1.3. Metal
- 7.1.4. Paper Board
- 7.2. Market Analysis, Insights and Forecast - by Product Type
- 7.2.1. Glass Bottles
- 7.2.2. Plastic Bottles
- 7.2.3. Bag in Box
- 7.2.4. Other Product Types
- 7.1. Market Analysis, Insights and Forecast - by Material Type
- 8. Europe Wine Packaging Industry Analysis, Insights and Forecast, 2020-2032
- 8.1. Market Analysis, Insights and Forecast - by Material Type
- 8.1.1. Glass
- 8.1.2. Plastic
- 8.1.3. Metal
- 8.1.4. Paper Board
- 8.2. Market Analysis, Insights and Forecast - by Product Type
- 8.2.1. Glass Bottles
- 8.2.2. Plastic Bottles
- 8.2.3. Bag in Box
- 8.2.4. Other Product Types
- 8.1. Market Analysis, Insights and Forecast - by Material Type
- 9. Asia Pacific Wine Packaging Industry Analysis, Insights and Forecast, 2020-2032
- 9.1. Market Analysis, Insights and Forecast - by Material Type
- 9.1.1. Glass
- 9.1.2. Plastic
- 9.1.3. Metal
- 9.1.4. Paper Board
- 9.2. Market Analysis, Insights and Forecast - by Product Type
- 9.2.1. Glass Bottles
- 9.2.2. Plastic Bottles
- 9.2.3. Bag in Box
- 9.2.4. Other Product Types
- 9.1. Market Analysis, Insights and Forecast - by Material Type
- 10. Latin America Wine Packaging Industry Analysis, Insights and Forecast, 2020-2032
- 10.1. Market Analysis, Insights and Forecast - by Material Type
- 10.1.1. Glass
- 10.1.2. Plastic
- 10.1.3. Metal
- 10.1.4. Paper Board
- 10.2. Market Analysis, Insights and Forecast - by Product Type
- 10.2.1. Glass Bottles
- 10.2.2. Plastic Bottles
- 10.2.3. Bag in Box
- 10.2.4. Other Product Types
- 10.1. Market Analysis, Insights and Forecast - by Material Type
- 11. Middle East and Africa Wine Packaging Industry Analysis, Insights and Forecast, 2020-2032
- 11.1. Market Analysis, Insights and Forecast - by Material Type
- 11.1.1. Glass
- 11.1.2. Plastic
- 11.1.3. Metal
- 11.1.4. Paper Board
- 11.2. Market Analysis, Insights and Forecast - by Product Type
- 11.2.1. Glass Bottles
- 11.2.2. Plastic Bottles
- 11.2.3. Bag in Box
- 11.2.4. Other Product Types
- 11.1. Market Analysis, Insights and Forecast - by Material Type
- 12. Competitive Analysis
- 12.1. Company Profiles
- 12.1.1 Encore Glass
- 12.1.1.1. Company Overview
- 12.1.1.2. Products
- 12.1.1.3. Company Financials
- 12.1.1.4. SWOT Analysis
- 12.1.2 Ardagh Group
- 12.1.2.1. Company Overview
- 12.1.2.2. Products
- 12.1.2.3. Company Financials
- 12.1.2.4. SWOT Analysis
- 12.1.3 Tetra Laval International
- 12.1.3.1. Company Overview
- 12.1.3.2. Products
- 12.1.3.3. Company Financials
- 12.1.3.4. SWOT Analysis
- 12.1.4 Liqui-Box Corporation ( Dow Chemical Company)
- 12.1.4.1. Company Overview
- 12.1.4.2. Products
- 12.1.4.3. Company Financials
- 12.1.4.4. SWOT Analysis
- 12.1.5 Saverglass SAS
- 12.1.5.1. Company Overview
- 12.1.5.2. Products
- 12.1.5.3. Company Financials
- 12.1.5.4. SWOT Analysis
- 12.1.6 Scholle Corporation
- 12.1.6.1. Company Overview
- 12.1.6.2. Products
- 12.1.6.3. Company Financials
- 12.1.6.4. SWOT Analysis
- 12.1.7 TricorBraun Incorporate
- 12.1.7.1. Company Overview
- 12.1.7.2. Products
- 12.1.7.3. Company Financials
- 12.1.7.4. SWOT Analysis
- 12.1.8 Ball Corporation
- 12.1.8.1. Company Overview
- 12.1.8.2. Products
- 12.1.8.3. Company Financials
- 12.1.8.4. SWOT Analysis
- 12.1.9 G3 Enterprises
- 12.1.9.1. Company Overview
- 12.1.9.2. Products
- 12.1.9.3. Company Financials
- 12.1.9.4. SWOT Analysis
- 12.1.10 Maverick Enterprises
- 12.1.10.1. Company Overview
- 12.1.10.2. Products
- 12.1.10.3. Company Financials
- 12.1.10.4. SWOT Analysis
- 12.1.11 Guala Closures
- 12.1.11.1. Company Overview
- 12.1.11.2. Products
- 12.1.11.3. Company Financials
- 12.1.11.4. SWOT Analysis
- 12.1.12 Owens-Illinois Group
- 12.1.12.1. Company Overview
- 12.1.12.2. Products
- 12.1.12.3. Company Financials
- 12.1.12.4. SWOT Analysis
- 12.1.13 International Paper
- 12.1.13.1. Company Overview
- 12.1.13.2. Products
- 12.1.13.3. Company Financials
- 12.1.13.4. SWOT Analysis
- 12.1.1 Encore Glass
- 12.2. Market Entropy
- 12.2.1 Company's Key Areas Served
- 12.2.2 Recent Developments
- 12.3. Company Market Share Analysis 2025
- 12.3.1 Top 5 Companies Market Share Analysis
- 12.3.2 Top 3 Companies Market Share Analysis
- 12.4. List of Potential Customers
- 13. Research Methodology
List of Figures
- Figure 1: Global Wine Packaging Industry Revenue Breakdown (USD Billion, %) by Region 2025 & 2033
- Figure 2: Global Wine Packaging Industry Volume Breakdown (K Tons, %) by Region 2025 & 2033
- Figure 3: North America Wine Packaging Industry Revenue (USD Billion), by Material Type 2025 & 2033
- Figure 4: North America Wine Packaging Industry Volume (K Tons), by Material Type 2025 & 2033
- Figure 5: North America Wine Packaging Industry Revenue Share (%), by Material Type 2025 & 2033
- Figure 6: North America Wine Packaging Industry Volume Share (%), by Material Type 2025 & 2033
- Figure 7: North America Wine Packaging Industry Revenue (USD Billion), by Product Type 2025 & 2033
- Figure 8: North America Wine Packaging Industry Volume (K Tons), by Product Type 2025 & 2033
- Figure 9: North America Wine Packaging Industry Revenue Share (%), by Product Type 2025 & 2033
- Figure 10: North America Wine Packaging Industry Volume Share (%), by Product Type 2025 & 2033
- Figure 11: North America Wine Packaging Industry Revenue (USD Billion), by Country 2025 & 2033
- Figure 12: North America Wine Packaging Industry Volume (K Tons), by Country 2025 & 2033
- Figure 13: North America Wine Packaging Industry Revenue Share (%), by Country 2025 & 2033
- Figure 14: North America Wine Packaging Industry Volume Share (%), by Country 2025 & 2033
- Figure 15: Europe Wine Packaging Industry Revenue (USD Billion), by Material Type 2025 & 2033
- Figure 16: Europe Wine Packaging Industry Volume (K Tons), by Material Type 2025 & 2033
- Figure 17: Europe Wine Packaging Industry Revenue Share (%), by Material Type 2025 & 2033
- Figure 18: Europe Wine Packaging Industry Volume Share (%), by Material Type 2025 & 2033
- Figure 19: Europe Wine Packaging Industry Revenue (USD Billion), by Product Type 2025 & 2033
- Figure 20: Europe Wine Packaging Industry Volume (K Tons), by Product Type 2025 & 2033
- Figure 21: Europe Wine Packaging Industry Revenue Share (%), by Product Type 2025 & 2033
- Figure 22: Europe Wine Packaging Industry Volume Share (%), by Product Type 2025 & 2033
- Figure 23: Europe Wine Packaging Industry Revenue (USD Billion), by Country 2025 & 2033
- Figure 24: Europe Wine Packaging Industry Volume (K Tons), by Country 2025 & 2033
- Figure 25: Europe Wine Packaging Industry Revenue Share (%), by Country 2025 & 2033
- Figure 26: Europe Wine Packaging Industry Volume Share (%), by Country 2025 & 2033
- Figure 27: Asia Pacific Wine Packaging Industry Revenue (USD Billion), by Material Type 2025 & 2033
- Figure 28: Asia Pacific Wine Packaging Industry Volume (K Tons), by Material Type 2025 & 2033
- Figure 29: Asia Pacific Wine Packaging Industry Revenue Share (%), by Material Type 2025 & 2033
- Figure 30: Asia Pacific Wine Packaging Industry Volume Share (%), by Material Type 2025 & 2033
- Figure 31: Asia Pacific Wine Packaging Industry Revenue (USD Billion), by Product Type 2025 & 2033
- Figure 32: Asia Pacific Wine Packaging Industry Volume (K Tons), by Product Type 2025 & 2033
- Figure 33: Asia Pacific Wine Packaging Industry Revenue Share (%), by Product Type 2025 & 2033
- Figure 34: Asia Pacific Wine Packaging Industry Volume Share (%), by Product Type 2025 & 2033
- Figure 35: Asia Pacific Wine Packaging Industry Revenue (USD Billion), by Country 2025 & 2033
- Figure 36: Asia Pacific Wine Packaging Industry Volume (K Tons), by Country 2025 & 2033
- Figure 37: Asia Pacific Wine Packaging Industry Revenue Share (%), by Country 2025 & 2033
- Figure 38: Asia Pacific Wine Packaging Industry Volume Share (%), by Country 2025 & 2033
- Figure 39: Latin America Wine Packaging Industry Revenue (USD Billion), by Material Type 2025 & 2033
- Figure 40: Latin America Wine Packaging Industry Volume (K Tons), by Material Type 2025 & 2033
- Figure 41: Latin America Wine Packaging Industry Revenue Share (%), by Material Type 2025 & 2033
- Figure 42: Latin America Wine Packaging Industry Volume Share (%), by Material Type 2025 & 2033
- Figure 43: Latin America Wine Packaging Industry Revenue (USD Billion), by Product Type 2025 & 2033
- Figure 44: Latin America Wine Packaging Industry Volume (K Tons), by Product Type 2025 & 2033
- Figure 45: Latin America Wine Packaging Industry Revenue Share (%), by Product Type 2025 & 2033
- Figure 46: Latin America Wine Packaging Industry Volume Share (%), by Product Type 2025 & 2033
- Figure 47: Latin America Wine Packaging Industry Revenue (USD Billion), by Country 2025 & 2033
- Figure 48: Latin America Wine Packaging Industry Volume (K Tons), by Country 2025 & 2033
- Figure 49: Latin America Wine Packaging Industry Revenue Share (%), by Country 2025 & 2033
- Figure 50: Latin America Wine Packaging Industry Volume Share (%), by Country 2025 & 2033
- Figure 51: Middle East and Africa Wine Packaging Industry Revenue (USD Billion), by Material Type 2025 & 2033
- Figure 52: Middle East and Africa Wine Packaging Industry Volume (K Tons), by Material Type 2025 & 2033
- Figure 53: Middle East and Africa Wine Packaging Industry Revenue Share (%), by Material Type 2025 & 2033
- Figure 54: Middle East and Africa Wine Packaging Industry Volume Share (%), by Material Type 2025 & 2033
- Figure 55: Middle East and Africa Wine Packaging Industry Revenue (USD Billion), by Product Type 2025 & 2033
- Figure 56: Middle East and Africa Wine Packaging Industry Volume (K Tons), by Product Type 2025 & 2033
- Figure 57: Middle East and Africa Wine Packaging Industry Revenue Share (%), by Product Type 2025 & 2033
- Figure 58: Middle East and Africa Wine Packaging Industry Volume Share (%), by Product Type 2025 & 2033
- Figure 59: Middle East and Africa Wine Packaging Industry Revenue (USD Billion), by Country 2025 & 2033
- Figure 60: Middle East and Africa Wine Packaging Industry Volume (K Tons), by Country 2025 & 2033
- Figure 61: Middle East and Africa Wine Packaging Industry Revenue Share (%), by Country 2025 & 2033
- Figure 62: Middle East and Africa Wine Packaging Industry Volume Share (%), by Country 2025 & 2033
List of Tables
- Table 1: Global Wine Packaging Industry Revenue USD Billion Forecast, by Material Type 2020 & 2033
- Table 2: Global Wine Packaging Industry Volume K Tons Forecast, by Material Type 2020 & 2033
- Table 3: Global Wine Packaging Industry Revenue USD Billion Forecast, by Product Type 2020 & 2033
- Table 4: Global Wine Packaging Industry Volume K Tons Forecast, by Product Type 2020 & 2033
- Table 5: Global Wine Packaging Industry Revenue USD Billion Forecast, by Region 2020 & 2033
- Table 6: Global Wine Packaging Industry Volume K Tons Forecast, by Region 2020 & 2033
- Table 7: Global Wine Packaging Industry Revenue USD Billion Forecast, by Material Type 2020 & 2033
- Table 8: Global Wine Packaging Industry Volume K Tons Forecast, by Material Type 2020 & 2033
- Table 9: Global Wine Packaging Industry Revenue USD Billion Forecast, by Product Type 2020 & 2033
- Table 10: Global Wine Packaging Industry Volume K Tons Forecast, by Product Type 2020 & 2033
- Table 11: Global Wine Packaging Industry Revenue USD Billion Forecast, by Country 2020 & 2033
- Table 12: Global Wine Packaging Industry Volume K Tons Forecast, by Country 2020 & 2033
- Table 13: United States Wine Packaging Industry Revenue (USD Billion) Forecast, by Application 2020 & 2033
- Table 14: United States Wine Packaging Industry Volume (K Tons) Forecast, by Application 2020 & 2033
- Table 15: Canada Wine Packaging Industry Revenue (USD Billion) Forecast, by Application 2020 & 2033
- Table 16: Canada Wine Packaging Industry Volume (K Tons) Forecast, by Application 2020 & 2033
- Table 17: Global Wine Packaging Industry Revenue USD Billion Forecast, by Material Type 2020 & 2033
- Table 18: Global Wine Packaging Industry Volume K Tons Forecast, by Material Type 2020 & 2033
- Table 19: Global Wine Packaging Industry Revenue USD Billion Forecast, by Product Type 2020 & 2033
- Table 20: Global Wine Packaging Industry Volume K Tons Forecast, by Product Type 2020 & 2033
- Table 21: Global Wine Packaging Industry Revenue USD Billion Forecast, by Country 2020 & 2033
- Table 22: Global Wine Packaging Industry Volume K Tons Forecast, by Country 2020 & 2033
- Table 23: United Kingdom Wine Packaging Industry Revenue (USD Billion) Forecast, by Application 2020 & 2033
- Table 24: United Kingdom Wine Packaging Industry Volume (K Tons) Forecast, by Application 2020 & 2033
- Table 25: Germany Wine Packaging Industry Revenue (USD Billion) Forecast, by Application 2020 & 2033
- Table 26: Germany Wine Packaging Industry Volume (K Tons) Forecast, by Application 2020 & 2033
- Table 27: Italy Wine Packaging Industry Revenue (USD Billion) Forecast, by Application 2020 & 2033
- Table 28: Italy Wine Packaging Industry Volume (K Tons) Forecast, by Application 2020 & 2033
- Table 29: France Wine Packaging Industry Revenue (USD Billion) Forecast, by Application 2020 & 2033
- Table 30: France Wine Packaging Industry Volume (K Tons) Forecast, by Application 2020 & 2033
- Table 31: Spain Wine Packaging Industry Revenue (USD Billion) Forecast, by Application 2020 & 2033
- Table 32: Spain Wine Packaging Industry Volume (K Tons) Forecast, by Application 2020 & 2033
- Table 33: Rest of Europe Wine Packaging Industry Revenue (USD Billion) Forecast, by Application 2020 & 2033
- Table 34: Rest of Europe Wine Packaging Industry Volume (K Tons) Forecast, by Application 2020 & 2033
- Table 35: Global Wine Packaging Industry Revenue USD Billion Forecast, by Material Type 2020 & 2033
- Table 36: Global Wine Packaging Industry Volume K Tons Forecast, by Material Type 2020 & 2033
- Table 37: Global Wine Packaging Industry Revenue USD Billion Forecast, by Product Type 2020 & 2033
- Table 38: Global Wine Packaging Industry Volume K Tons Forecast, by Product Type 2020 & 2033
- Table 39: Global Wine Packaging Industry Revenue USD Billion Forecast, by Country 2020 & 2033
- Table 40: Global Wine Packaging Industry Volume K Tons Forecast, by Country 2020 & 2033
- Table 41: China Wine Packaging Industry Revenue (USD Billion) Forecast, by Application 2020 & 2033
- Table 42: China Wine Packaging Industry Volume (K Tons) Forecast, by Application 2020 & 2033
- Table 43: Japan Wine Packaging Industry Revenue (USD Billion) Forecast, by Application 2020 & 2033
- Table 44: Japan Wine Packaging Industry Volume (K Tons) Forecast, by Application 2020 & 2033
- Table 45: Australia and New Zealand Wine Packaging Industry Revenue (USD Billion) Forecast, by Application 2020 & 2033
- Table 46: Australia and New Zealand Wine Packaging Industry Volume (K Tons) Forecast, by Application 2020 & 2033
- Table 47: Rest of Asia Pacific Wine Packaging Industry Revenue (USD Billion) Forecast, by Application 2020 & 2033
- Table 48: Rest of Asia Pacific Wine Packaging Industry Volume (K Tons) Forecast, by Application 2020 & 2033
- Table 49: Global Wine Packaging Industry Revenue USD Billion Forecast, by Material Type 2020 & 2033
- Table 50: Global Wine Packaging Industry Volume K Tons Forecast, by Material Type 2020 & 2033
- Table 51: Global Wine Packaging Industry Revenue USD Billion Forecast, by Product Type 2020 & 2033
- Table 52: Global Wine Packaging Industry Volume K Tons Forecast, by Product Type 2020 & 2033
- Table 53: Global Wine Packaging Industry Revenue USD Billion Forecast, by Country 2020 & 2033
- Table 54: Global Wine Packaging Industry Volume K Tons Forecast, by Country 2020 & 2033
- Table 55: Global Wine Packaging Industry Revenue USD Billion Forecast, by Material Type 2020 & 2033
- Table 56: Global Wine Packaging Industry Volume K Tons Forecast, by Material Type 2020 & 2033
- Table 57: Global Wine Packaging Industry Revenue USD Billion Forecast, by Product Type 2020 & 2033
- Table 58: Global Wine Packaging Industry Volume K Tons Forecast, by Product Type 2020 & 2033
- Table 59: Global Wine Packaging Industry Revenue USD Billion Forecast, by Country 2020 & 2033
- Table 60: Global Wine Packaging Industry Volume K Tons Forecast, by Country 2020 & 2033
Frequently Asked Questions
1. What is the projected Compound Annual Growth Rate (CAGR) of the Wine Packaging Industry?
The projected CAGR is approximately 5.48%.
2. Which companies are prominent players in the Wine Packaging Industry?
Key companies in the market include Encore Glass, Ardagh Group, Tetra Laval International, Liqui-Box Corporation ( Dow Chemical Company), Saverglass SAS, Scholle Corporation, TricorBraun Incorporate, Ball Corporation, G3 Enterprises, Maverick Enterprises, Guala Closures, Owens-Illinois Group, International Paper.
3. What are the main segments of the Wine Packaging Industry?
The market segments include Material Type, Product Type.
4. Can you provide details about the market size?
The market size is estimated to be USD 5.69 USD Billion as of 2022.
5. What are some drivers contributing to market growth?
Innovative Packaging and Attractive Marketing.
6. What are the notable trends driving market growth?
Growing Consumption of Premium Wines.
7. Are there any restraints impacting market growth?
Stringent Government Regulations over Single-Use Plastic-based Packaging.
8. Can you provide examples of recent developments in the market?
December 2022: In the Wine Industry Impacts Awards (WIIA) announced in December 2022, presented by the Wine Industry Suppliers Association (WISA), Orora Glass took out the top prize in the Packaging & Design category for its lightweight sparkling wine bottle. It was described as a fantastic and sustainable packaging alternative for sparkling beverages, 100 grams lighter than the brand's standard sparkling bottle yet having the same diameter, height, and GV rating.
9. What pricing options are available for accessing the report?
Pricing options include single-user, multi-user, and enterprise licenses priced at USD 4750, USD 5250, and USD 8750 respectively.
10. Is the market size provided in terms of value or volume?
The market size is provided in terms of value, measured in USD Billion and volume, measured in K Tons.
11. Are there any specific market keywords associated with the report?
Yes, the market keyword associated with the report is "Wine Packaging Industry," which aids in identifying and referencing the specific market segment covered.
12. How do I determine which pricing option suits my needs best?
The pricing options vary based on user requirements and access needs. Individual users may opt for single-user licenses, while businesses requiring broader access may choose multi-user or enterprise licenses for cost-effective access to the report.
13. Are there any additional resources or data provided in the Wine Packaging Industry report?
While the report offers comprehensive insights, it's advisable to review the specific contents or supplementary materials provided to ascertain if additional resources or data are available.
14. How can I stay updated on further developments or reports in the Wine Packaging Industry?
To stay informed about further developments, trends, and reports in the Wine Packaging Industry, consider subscribing to industry newsletters, following relevant companies and organizations, or regularly checking reputable industry news sources and publications.
Methodology
Step 1 - Identification of Relevant Samples Size from Population Database


Step 2 - Approaches for Defining Global Market Size (Value, Volume* & Price*)

Note*: In applicable scenarios
Step 3 - Data Sources
Primary Research
- Web Analytics
- Survey Reports
- Research Institute
- Latest Research Reports
- Opinion Leaders
Secondary Research
- Annual Reports
- White Paper
- Latest Press Release
- Industry Association
- Paid Database
- Investor Presentations

Step 4 - Data Triangulation
Involves using different sources of information in order to increase the validity of a study
These sources are likely to be stakeholders in a program - participants, other researchers, program staff, other community members, and so on.
Then we put all data in single framework & apply various statistical tools to find out the dynamic on the market.
During the analysis stage, feedback from the stakeholder groups would be compared to determine areas of agreement as well as areas of divergence