

Key Insights
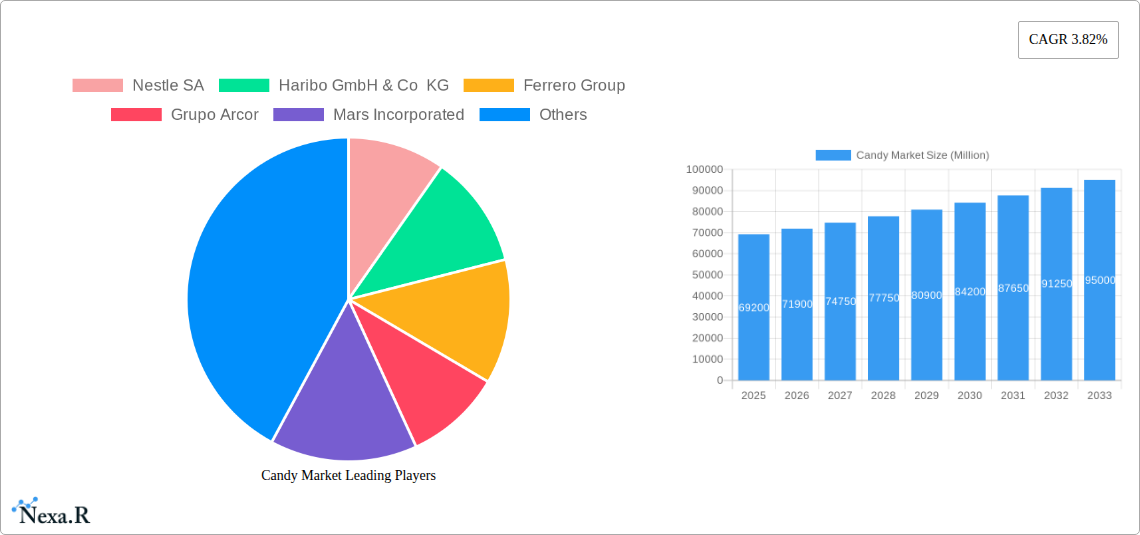
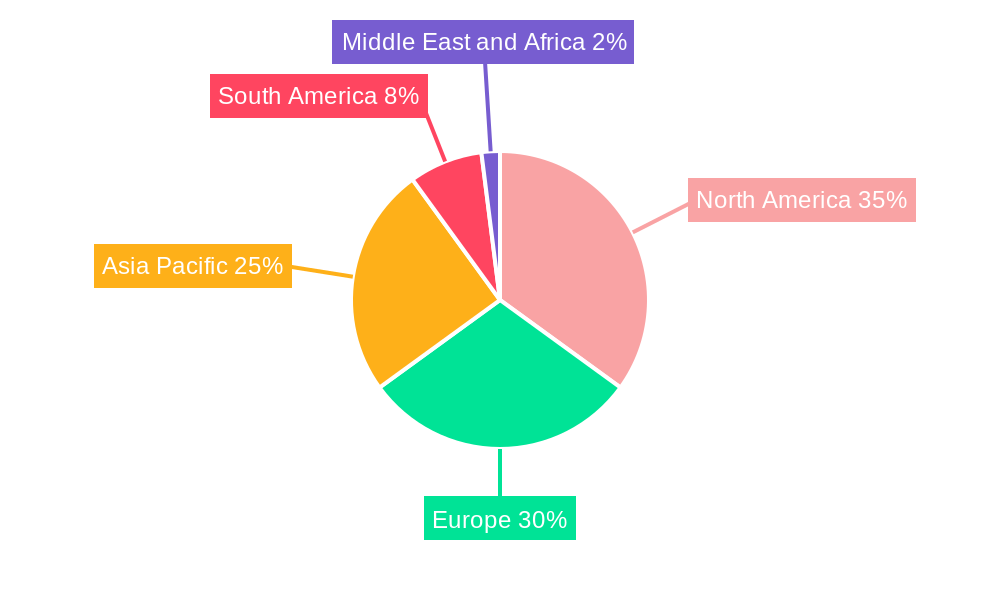
The global candy market, valued at $69.20 billion in 2025, is projected to experience steady growth, driven by several key factors. The rising disposable incomes in developing economies, coupled with increasing consumer preference for convenient and indulgent snacks, fuels market expansion. Innovation in product offerings, including healthier options like sugar-free and organic candies, caters to evolving consumer demands and contributes to market growth. Furthermore, strategic marketing campaigns and effective branding by major players like Nestlé, Mars, and Ferrero, targeting diverse age groups, are instrumental in driving sales. The market segmentation reveals a significant share held by chocolate candy, followed by non-chocolate varieties. Supermarkets and hypermarkets remain the dominant distribution channels, although online retail is experiencing rapid growth, driven by e-commerce penetration and convenience. While growth is expected, challenges remain, including fluctuating raw material prices (primarily sugar and cocoa) and increasing health concerns regarding sugar consumption, which may necessitate further product diversification and marketing strategies emphasizing moderation. The regional breakdown suggests North America and Europe hold substantial market shares, but Asia-Pacific is anticipated to witness considerable growth in the coming years, driven by its expanding middle class and rising consumer spending.
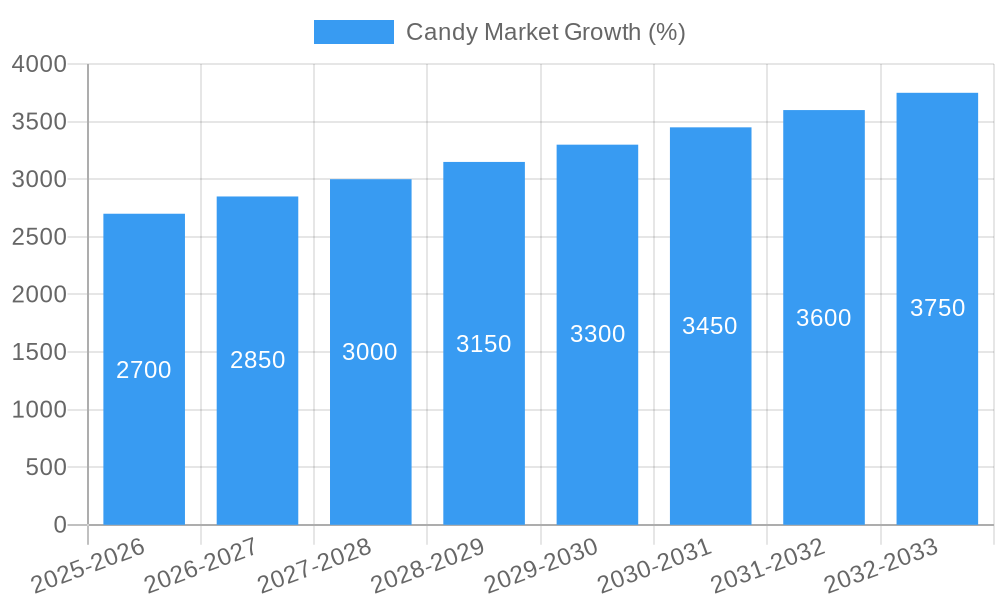
Growth is expected to be primarily driven by the Asia-Pacific region, which is expected to see increasing demand for candy due to rising disposable income and growing population. This, coupled with the continued popularity of chocolate and non-chocolate candies across the globe, will ensure continued growth in the sector. While regulatory hurdles concerning sugar content and health concerns may pose some challenges, manufacturers are successfully mitigating these by introducing healthier alternatives and promoting responsible consumption. The competitive landscape, dominated by established global players, remains intense, prompting ongoing innovation and strategic partnerships to maintain market share. The forecast period of 2025-2033 indicates a consistent, albeit moderate, expansion, with a projected Compound Annual Growth Rate (CAGR) of 3.82%. This moderate but sustained growth reflects a market that is mature yet dynamic, adapting to evolving consumer preferences and market dynamics.
Candy Market: A Comprehensive Market Report (2019-2033)
This comprehensive report provides a detailed analysis of the global candy market, encompassing market dynamics, growth trends, regional insights, competitive landscape, and future outlook. The study period spans from 2019 to 2033, with 2025 serving as the base and estimated year. The report caters to industry professionals, investors, and market researchers seeking in-depth knowledge of this dynamic sector.
Candy Market Dynamics & Structure
The global candy market, valued at xx Million units in 2024, is characterized by a moderately concentrated structure, with key players like Nestlé SA, Mars Incorporated, and Mondelez International Inc. holding significant market share. Technological innovations, particularly in flavor profiles, packaging, and ingredient sourcing, are key drivers. However, increasing health consciousness and stringent regulatory frameworks surrounding sugar content present challenges. The market experiences considerable M&A activity, with xx deals recorded between 2019 and 2024, primarily driven by consolidation and expansion strategies. Substitute products, such as healthier snacks and confectionery alternatives, pose a growing threat. The market is segmented by consumer demographics, with children and young adults representing significant consumer groups.
- Market Concentration: Moderately concentrated, with top 5 players holding approximately xx% market share.
- Technological Innovation: Focus on natural ingredients, unique flavors, and sustainable packaging.
- Regulatory Framework: Increasingly stringent regulations on sugar content and labeling.
- Competitive Substitutes: Growing market of healthier snack alternatives.
- M&A Activity: xx deals recorded between 2019 and 2024, indicating consolidation and expansion.
- End-User Demographics: Children and young adults represent the largest consumer segment.
Candy Market Growth Trends & Insights
The global candy market demonstrates a steady growth trajectory, with a projected CAGR of xx% during the forecast period (2025-2033). Market size is expected to reach xx Million units by 2033, driven by factors including rising disposable incomes in developing economies, increasing urbanization, and evolving consumer preferences towards premium and innovative products. Technological disruptions, such as personalized confectionery and smart packaging, are also influencing market dynamics. Consumer behavior shifts towards healthier options are presenting challenges, but the industry is adapting with healthier formulations and sugar reduction strategies. Market penetration in emerging markets remains relatively low, presenting significant growth potential.
Dominant Regions, Countries, or Segments in Candy Market
North America currently holds the largest market share in the candy market, followed by Europe and Asia-Pacific. Within the product segments, non-chocolate candy exhibits higher growth potential driven by increased demand for gummy candies and innovative product formats. Supermarkets/hypermarkets dominate the distribution channel landscape; however, online retail is gaining traction, with a projected xx% CAGR during the forecast period.
- Leading Region: North America
- Leading Segment (By Type): Non-chocolate Candy (Driven by innovation and new product launches)
- Leading Segment (By Distribution): Supermarkets/Hypermarkets
- Key Drivers (North America): Strong consumer spending, established distribution networks.
- Key Drivers (Asia-Pacific): Rising disposable incomes and urbanization.
Candy Market Product Landscape
The candy market showcases a diverse product landscape, featuring a wide array of flavors, textures, and formats. Innovations center on healthier formulations (reduced sugar), unique flavor combinations, and interactive packaging, like the recent introduction of Push Pop Gummy Pop-its. Technological advancements focus on improving production efficiency and sustainability. Unique selling propositions (USPs) often involve novelty, nostalgic appeal, and personalized experiences.
Key Drivers, Barriers & Challenges in Candy Market
Key Drivers: Rising disposable incomes, especially in emerging markets; increasing urbanization; strong consumer demand for innovative products; and the development of novel product forms and flavors.
Challenges: Growing health consciousness leading to reduced consumption; stringent regulations on sugar content and labeling; intense competition; and supply chain disruptions impacting production costs and availability. For example, the impact of fluctuating sugar prices is estimated to affect margins by xx% in the next five years.
Emerging Opportunities in Candy Market
Untapped markets in developing regions present significant opportunities. The growing demand for healthier options opens avenues for product innovation, with reduced sugar content and functional ingredients. Personalized candy experiences, through customized flavors or packaging, offer further growth potential. E-commerce expansion and direct-to-consumer models also provide new avenues for market penetration.
Growth Accelerators in the Candy Market Industry
Technological advancements in flavor creation, packaging, and production efficiency drive long-term growth. Strategic partnerships between confectionery companies and ingredient suppliers foster innovation. Expansion into emerging markets, particularly in Asia and Africa, presents significant untapped potential.
Key Players Shaping the Candy Market Market
- Nestle SA
- Haribo GmbH & Co KG
- Ferrero Group
- Grupo Arcor
- Mars Incorporated
- Cloetta Ab
- Mondelez International Inc
- The Topps Company Inc
- Perfetti Van Melle Group BV
- The Hershey Company
Notable Milestones in Candy Market Sector
- May 2022: Bazooka Candy Brands launched Push Pop Gummy Pop-its in various flavors.
- March 2022: HARIBO unveiled a new lineup of Easter treats, including Jelly Bunnies and Chick 'n' Mix.
- 2023: Sweet & Snacks Expo in Chicago highlights the latest gummy innovations.
In-Depth Candy Market Market Outlook
The candy market is poised for sustained growth, driven by innovation, market expansion, and evolving consumer preferences. Strategic investments in R&D, coupled with agile adaptation to changing health trends, are crucial for long-term success. Companies focusing on personalized experiences and sustainable practices will be best positioned to capitalize on emerging opportunities within this dynamic sector.
Candy Market Segmentation
-
1. Type
- 1.1. Chocolate Candy
-
1.2. Non-chocolate Candy
- 1.2.1. Hard Boiled Candies
- 1.2.2. Pastilles, Gums, Jellies, and Chews
- 1.2.3. Toffees, Caramels, and Nougat
- 1.2.4. Mints
- 1.2.5. Other Non-chocolate Candies
-
2. Distribution Channel
- 2.1. Supermarkets/Hypermarkets
- 2.2. Convenience Stores
- 2.3. Specalist Retailers
- 2.4. Online Retail
- 2.5. Other Distribution Channels
Candy Market Segmentation By Geography
-
1. North America
- 1.1. United States
- 1.2. Canada
- 1.3. Mexico
- 1.4. Rest of North America
-
2. Europe
- 2.1. Germany
- 2.2. United Kingdom
- 2.3. France
- 2.4. Russia
- 2.5. Italy
- 2.6. Spain
- 2.7. Rest of Europe
-
3. Asia Pacific
- 3.1. India
- 3.2. China
- 3.3. Australia
- 3.4. Japan
- 3.5. Rest of Asia Pacific
-
4. South America
- 4.1. Brazil
- 4.2. Argentina
- 4.3. Rest of South America
-
5. Middle East and Africa
- 5.1. United Arab Emirates
- 5.2. South Africa
- 5.3. Rest of Middle East and Africa
Candy Market REPORT HIGHLIGHTS
| Aspects | Details |
|---|---|
| Study Period | 2019-2033 |
| Base Year | 2024 |
| Estimated Year | 2025 |
| Forecast Period | 2025-2033 |
| Historical Period | 2019-2024 |
| Growth Rate | CAGR of 3.82% from 2019-2033 |
| Segmentation |
|
Table of Contents
- 1. Introduction
- 1.1. Research Scope
- 1.2. Market Segmentation
- 1.3. Research Methodology
- 1.4. Definitions and Assumptions
- 2. Executive Summary
- 2.1. Introduction
- 3. Market Dynamics
- 3.1. Introduction
- 3.2. Market Drivers
- 3.2.1. Iced Tea as a Healthy Alternative for Daily Intake; Introduction of Innovative and Flavorful Iced Tea Options
- 3.3. Market Restrains
- 3.3.1. Competiton From Substitutes
- 3.4. Market Trends
- 3.4.1. Rising Demand for Sugar-free Candies
- 4. Market Factor Analysis
- 4.1. Porters Five Forces
- 4.2. Supply/Value Chain
- 4.3. PESTEL analysis
- 4.4. Market Entropy
- 4.5. Patent/Trademark Analysis
- 5. Global Candy Market Analysis, Insights and Forecast, 2019-2031
- 5.1. Market Analysis, Insights and Forecast - by Type
- 5.1.1. Chocolate Candy
- 5.1.2. Non-chocolate Candy
- 5.1.2.1. Hard Boiled Candies
- 5.1.2.2. Pastilles, Gums, Jellies, and Chews
- 5.1.2.3. Toffees, Caramels, and Nougat
- 5.1.2.4. Mints
- 5.1.2.5. Other Non-chocolate Candies
- 5.2. Market Analysis, Insights and Forecast - by Distribution Channel
- 5.2.1. Supermarkets/Hypermarkets
- 5.2.2. Convenience Stores
- 5.2.3. Specalist Retailers
- 5.2.4. Online Retail
- 5.2.5. Other Distribution Channels
- 5.3. Market Analysis, Insights and Forecast - by Region
- 5.3.1. North America
- 5.3.2. Europe
- 5.3.3. Asia Pacific
- 5.3.4. South America
- 5.3.5. Middle East and Africa
- 5.1. Market Analysis, Insights and Forecast - by Type
- 6. North America Candy Market Analysis, Insights and Forecast, 2019-2031
- 6.1. Market Analysis, Insights and Forecast - by Type
- 6.1.1. Chocolate Candy
- 6.1.2. Non-chocolate Candy
- 6.1.2.1. Hard Boiled Candies
- 6.1.2.2. Pastilles, Gums, Jellies, and Chews
- 6.1.2.3. Toffees, Caramels, and Nougat
- 6.1.2.4. Mints
- 6.1.2.5. Other Non-chocolate Candies
- 6.2. Market Analysis, Insights and Forecast - by Distribution Channel
- 6.2.1. Supermarkets/Hypermarkets
- 6.2.2. Convenience Stores
- 6.2.3. Specalist Retailers
- 6.2.4. Online Retail
- 6.2.5. Other Distribution Channels
- 6.1. Market Analysis, Insights and Forecast - by Type
- 7. Europe Candy Market Analysis, Insights and Forecast, 2019-2031
- 7.1. Market Analysis, Insights and Forecast - by Type
- 7.1.1. Chocolate Candy
- 7.1.2. Non-chocolate Candy
- 7.1.2.1. Hard Boiled Candies
- 7.1.2.2. Pastilles, Gums, Jellies, and Chews
- 7.1.2.3. Toffees, Caramels, and Nougat
- 7.1.2.4. Mints
- 7.1.2.5. Other Non-chocolate Candies
- 7.2. Market Analysis, Insights and Forecast - by Distribution Channel
- 7.2.1. Supermarkets/Hypermarkets
- 7.2.2. Convenience Stores
- 7.2.3. Specalist Retailers
- 7.2.4. Online Retail
- 7.2.5. Other Distribution Channels
- 7.1. Market Analysis, Insights and Forecast - by Type
- 8. Asia Pacific Candy Market Analysis, Insights and Forecast, 2019-2031
- 8.1. Market Analysis, Insights and Forecast - by Type
- 8.1.1. Chocolate Candy
- 8.1.2. Non-chocolate Candy
- 8.1.2.1. Hard Boiled Candies
- 8.1.2.2. Pastilles, Gums, Jellies, and Chews
- 8.1.2.3. Toffees, Caramels, and Nougat
- 8.1.2.4. Mints
- 8.1.2.5. Other Non-chocolate Candies
- 8.2. Market Analysis, Insights and Forecast - by Distribution Channel
- 8.2.1. Supermarkets/Hypermarkets
- 8.2.2. Convenience Stores
- 8.2.3. Specalist Retailers
- 8.2.4. Online Retail
- 8.2.5. Other Distribution Channels
- 8.1. Market Analysis, Insights and Forecast - by Type
- 9. South America Candy Market Analysis, Insights and Forecast, 2019-2031
- 9.1. Market Analysis, Insights and Forecast - by Type
- 9.1.1. Chocolate Candy
- 9.1.2. Non-chocolate Candy
- 9.1.2.1. Hard Boiled Candies
- 9.1.2.2. Pastilles, Gums, Jellies, and Chews
- 9.1.2.3. Toffees, Caramels, and Nougat
- 9.1.2.4. Mints
- 9.1.2.5. Other Non-chocolate Candies
- 9.2. Market Analysis, Insights and Forecast - by Distribution Channel
- 9.2.1. Supermarkets/Hypermarkets
- 9.2.2. Convenience Stores
- 9.2.3. Specalist Retailers
- 9.2.4. Online Retail
- 9.2.5. Other Distribution Channels
- 9.1. Market Analysis, Insights and Forecast - by Type
- 10. Middle East and Africa Candy Market Analysis, Insights and Forecast, 2019-2031
- 10.1. Market Analysis, Insights and Forecast - by Type
- 10.1.1. Chocolate Candy
- 10.1.2. Non-chocolate Candy
- 10.1.2.1. Hard Boiled Candies
- 10.1.2.2. Pastilles, Gums, Jellies, and Chews
- 10.1.2.3. Toffees, Caramels, and Nougat
- 10.1.2.4. Mints
- 10.1.2.5. Other Non-chocolate Candies
- 10.2. Market Analysis, Insights and Forecast - by Distribution Channel
- 10.2.1. Supermarkets/Hypermarkets
- 10.2.2. Convenience Stores
- 10.2.3. Specalist Retailers
- 10.2.4. Online Retail
- 10.2.5. Other Distribution Channels
- 10.1. Market Analysis, Insights and Forecast - by Type
- 11. North America Candy Market Analysis, Insights and Forecast, 2019-2031
- 11.1. Market Analysis, Insights and Forecast - By Country/Sub-region
- 11.1.1 United States
- 11.1.2 Canada
- 11.1.3 Mexico
- 11.1.4 Rest of North America
- 12. Europe Candy Market Analysis, Insights and Forecast, 2019-2031
- 12.1. Market Analysis, Insights and Forecast - By Country/Sub-region
- 12.1.1 Germany
- 12.1.2 United Kingdom
- 12.1.3 France
- 12.1.4 Russia
- 12.1.5 Italy
- 12.1.6 Spain
- 12.1.7 Rest of Europe
- 13. Asia Pacific Candy Market Analysis, Insights and Forecast, 2019-2031
- 13.1. Market Analysis, Insights and Forecast - By Country/Sub-region
- 13.1.1 India
- 13.1.2 China
- 13.1.3 Australia
- 13.1.4 Japan
- 13.1.5 Rest of Asia Pacific
- 14. South America Candy Market Analysis, Insights and Forecast, 2019-2031
- 14.1. Market Analysis, Insights and Forecast - By Country/Sub-region
- 14.1.1 Brazil
- 14.1.2 Argentina
- 14.1.3 Rest of South America
- 15. Middle East and Africa Candy Market Analysis, Insights and Forecast, 2019-2031
- 15.1. Market Analysis, Insights and Forecast - By Country/Sub-region
- 15.1.1 United Arab Emirates
- 15.1.2 South Africa
- 15.1.3 Rest of Middle East and Africa
- 16. Competitive Analysis
- 16.1. Global Market Share Analysis 2024
- 16.2. Company Profiles
- 16.2.1 Nestle SA
- 16.2.1.1. Overview
- 16.2.1.2. Products
- 16.2.1.3. SWOT Analysis
- 16.2.1.4. Recent Developments
- 16.2.1.5. Financials (Based on Availability)
- 16.2.2 Haribo GmbH & Co KG
- 16.2.2.1. Overview
- 16.2.2.2. Products
- 16.2.2.3. SWOT Analysis
- 16.2.2.4. Recent Developments
- 16.2.2.5. Financials (Based on Availability)
- 16.2.3 Ferrero Group
- 16.2.3.1. Overview
- 16.2.3.2. Products
- 16.2.3.3. SWOT Analysis
- 16.2.3.4. Recent Developments
- 16.2.3.5. Financials (Based on Availability)
- 16.2.4 Grupo Arcor
- 16.2.4.1. Overview
- 16.2.4.2. Products
- 16.2.4.3. SWOT Analysis
- 16.2.4.4. Recent Developments
- 16.2.4.5. Financials (Based on Availability)
- 16.2.5 Mars Incorporated
- 16.2.5.1. Overview
- 16.2.5.2. Products
- 16.2.5.3. SWOT Analysis
- 16.2.5.4. Recent Developments
- 16.2.5.5. Financials (Based on Availability)
- 16.2.6 Cloetta Ab
- 16.2.6.1. Overview
- 16.2.6.2. Products
- 16.2.6.3. SWOT Analysis
- 16.2.6.4. Recent Developments
- 16.2.6.5. Financials (Based on Availability)
- 16.2.7 Mondelez International Inc
- 16.2.7.1. Overview
- 16.2.7.2. Products
- 16.2.7.3. SWOT Analysis
- 16.2.7.4. Recent Developments
- 16.2.7.5. Financials (Based on Availability)
- 16.2.8 The Topps Company Inc *List Not Exhaustive
- 16.2.8.1. Overview
- 16.2.8.2. Products
- 16.2.8.3. SWOT Analysis
- 16.2.8.4. Recent Developments
- 16.2.8.5. Financials (Based on Availability)
- 16.2.9 Perfetti Van Melle Group BV
- 16.2.9.1. Overview
- 16.2.9.2. Products
- 16.2.9.3. SWOT Analysis
- 16.2.9.4. Recent Developments
- 16.2.9.5. Financials (Based on Availability)
- 16.2.10 The Hershey Company
- 16.2.10.1. Overview
- 16.2.10.2. Products
- 16.2.10.3. SWOT Analysis
- 16.2.10.4. Recent Developments
- 16.2.10.5. Financials (Based on Availability)
- 16.2.1 Nestle SA
List of Figures
- Figure 1: Global Candy Market Revenue Breakdown (Million, %) by Region 2024 & 2032
- Figure 2: North America Candy Market Revenue (Million), by Country 2024 & 2032
- Figure 3: North America Candy Market Revenue Share (%), by Country 2024 & 2032
- Figure 4: Europe Candy Market Revenue (Million), by Country 2024 & 2032
- Figure 5: Europe Candy Market Revenue Share (%), by Country 2024 & 2032
- Figure 6: Asia Pacific Candy Market Revenue (Million), by Country 2024 & 2032
- Figure 7: Asia Pacific Candy Market Revenue Share (%), by Country 2024 & 2032
- Figure 8: South America Candy Market Revenue (Million), by Country 2024 & 2032
- Figure 9: South America Candy Market Revenue Share (%), by Country 2024 & 2032
- Figure 10: Middle East and Africa Candy Market Revenue (Million), by Country 2024 & 2032
- Figure 11: Middle East and Africa Candy Market Revenue Share (%), by Country 2024 & 2032
- Figure 12: North America Candy Market Revenue (Million), by Type 2024 & 2032
- Figure 13: North America Candy Market Revenue Share (%), by Type 2024 & 2032
- Figure 14: North America Candy Market Revenue (Million), by Distribution Channel 2024 & 2032
- Figure 15: North America Candy Market Revenue Share (%), by Distribution Channel 2024 & 2032
- Figure 16: North America Candy Market Revenue (Million), by Country 2024 & 2032
- Figure 17: North America Candy Market Revenue Share (%), by Country 2024 & 2032
- Figure 18: Europe Candy Market Revenue (Million), by Type 2024 & 2032
- Figure 19: Europe Candy Market Revenue Share (%), by Type 2024 & 2032
- Figure 20: Europe Candy Market Revenue (Million), by Distribution Channel 2024 & 2032
- Figure 21: Europe Candy Market Revenue Share (%), by Distribution Channel 2024 & 2032
- Figure 22: Europe Candy Market Revenue (Million), by Country 2024 & 2032
- Figure 23: Europe Candy Market Revenue Share (%), by Country 2024 & 2032
- Figure 24: Asia Pacific Candy Market Revenue (Million), by Type 2024 & 2032
- Figure 25: Asia Pacific Candy Market Revenue Share (%), by Type 2024 & 2032
- Figure 26: Asia Pacific Candy Market Revenue (Million), by Distribution Channel 2024 & 2032
- Figure 27: Asia Pacific Candy Market Revenue Share (%), by Distribution Channel 2024 & 2032
- Figure 28: Asia Pacific Candy Market Revenue (Million), by Country 2024 & 2032
- Figure 29: Asia Pacific Candy Market Revenue Share (%), by Country 2024 & 2032
- Figure 30: South America Candy Market Revenue (Million), by Type 2024 & 2032
- Figure 31: South America Candy Market Revenue Share (%), by Type 2024 & 2032
- Figure 32: South America Candy Market Revenue (Million), by Distribution Channel 2024 & 2032
- Figure 33: South America Candy Market Revenue Share (%), by Distribution Channel 2024 & 2032
- Figure 34: South America Candy Market Revenue (Million), by Country 2024 & 2032
- Figure 35: South America Candy Market Revenue Share (%), by Country 2024 & 2032
- Figure 36: Middle East and Africa Candy Market Revenue (Million), by Type 2024 & 2032
- Figure 37: Middle East and Africa Candy Market Revenue Share (%), by Type 2024 & 2032
- Figure 38: Middle East and Africa Candy Market Revenue (Million), by Distribution Channel 2024 & 2032
- Figure 39: Middle East and Africa Candy Market Revenue Share (%), by Distribution Channel 2024 & 2032
- Figure 40: Middle East and Africa Candy Market Revenue (Million), by Country 2024 & 2032
- Figure 41: Middle East and Africa Candy Market Revenue Share (%), by Country 2024 & 2032
List of Tables
- Table 1: Global Candy Market Revenue Million Forecast, by Region 2019 & 2032
- Table 2: Global Candy Market Revenue Million Forecast, by Type 2019 & 2032
- Table 3: Global Candy Market Revenue Million Forecast, by Distribution Channel 2019 & 2032
- Table 4: Global Candy Market Revenue Million Forecast, by Region 2019 & 2032
- Table 5: Global Candy Market Revenue Million Forecast, by Country 2019 & 2032
- Table 6: United States Candy Market Revenue (Million) Forecast, by Application 2019 & 2032
- Table 7: Canada Candy Market Revenue (Million) Forecast, by Application 2019 & 2032
- Table 8: Mexico Candy Market Revenue (Million) Forecast, by Application 2019 & 2032
- Table 9: Rest of North America Candy Market Revenue (Million) Forecast, by Application 2019 & 2032
- Table 10: Global Candy Market Revenue Million Forecast, by Country 2019 & 2032
- Table 11: Germany Candy Market Revenue (Million) Forecast, by Application 2019 & 2032
- Table 12: United Kingdom Candy Market Revenue (Million) Forecast, by Application 2019 & 2032
- Table 13: France Candy Market Revenue (Million) Forecast, by Application 2019 & 2032
- Table 14: Russia Candy Market Revenue (Million) Forecast, by Application 2019 & 2032
- Table 15: Italy Candy Market Revenue (Million) Forecast, by Application 2019 & 2032
- Table 16: Spain Candy Market Revenue (Million) Forecast, by Application 2019 & 2032
- Table 17: Rest of Europe Candy Market Revenue (Million) Forecast, by Application 2019 & 2032
- Table 18: Global Candy Market Revenue Million Forecast, by Country 2019 & 2032
- Table 19: India Candy Market Revenue (Million) Forecast, by Application 2019 & 2032
- Table 20: China Candy Market Revenue (Million) Forecast, by Application 2019 & 2032
- Table 21: Australia Candy Market Revenue (Million) Forecast, by Application 2019 & 2032
- Table 22: Japan Candy Market Revenue (Million) Forecast, by Application 2019 & 2032
- Table 23: Rest of Asia Pacific Candy Market Revenue (Million) Forecast, by Application 2019 & 2032
- Table 24: Global Candy Market Revenue Million Forecast, by Country 2019 & 2032
- Table 25: Brazil Candy Market Revenue (Million) Forecast, by Application 2019 & 2032
- Table 26: Argentina Candy Market Revenue (Million) Forecast, by Application 2019 & 2032
- Table 27: Rest of South America Candy Market Revenue (Million) Forecast, by Application 2019 & 2032
- Table 28: Global Candy Market Revenue Million Forecast, by Country 2019 & 2032
- Table 29: United Arab Emirates Candy Market Revenue (Million) Forecast, by Application 2019 & 2032
- Table 30: South Africa Candy Market Revenue (Million) Forecast, by Application 2019 & 2032
- Table 31: Rest of Middle East and Africa Candy Market Revenue (Million) Forecast, by Application 2019 & 2032
- Table 32: Global Candy Market Revenue Million Forecast, by Type 2019 & 2032
- Table 33: Global Candy Market Revenue Million Forecast, by Distribution Channel 2019 & 2032
- Table 34: Global Candy Market Revenue Million Forecast, by Country 2019 & 2032
- Table 35: United States Candy Market Revenue (Million) Forecast, by Application 2019 & 2032
- Table 36: Canada Candy Market Revenue (Million) Forecast, by Application 2019 & 2032
- Table 37: Mexico Candy Market Revenue (Million) Forecast, by Application 2019 & 2032
- Table 38: Rest of North America Candy Market Revenue (Million) Forecast, by Application 2019 & 2032
- Table 39: Global Candy Market Revenue Million Forecast, by Type 2019 & 2032
- Table 40: Global Candy Market Revenue Million Forecast, by Distribution Channel 2019 & 2032
- Table 41: Global Candy Market Revenue Million Forecast, by Country 2019 & 2032
- Table 42: Germany Candy Market Revenue (Million) Forecast, by Application 2019 & 2032
- Table 43: United Kingdom Candy Market Revenue (Million) Forecast, by Application 2019 & 2032
- Table 44: France Candy Market Revenue (Million) Forecast, by Application 2019 & 2032
- Table 45: Russia Candy Market Revenue (Million) Forecast, by Application 2019 & 2032
- Table 46: Italy Candy Market Revenue (Million) Forecast, by Application 2019 & 2032
- Table 47: Spain Candy Market Revenue (Million) Forecast, by Application 2019 & 2032
- Table 48: Rest of Europe Candy Market Revenue (Million) Forecast, by Application 2019 & 2032
- Table 49: Global Candy Market Revenue Million Forecast, by Type 2019 & 2032
- Table 50: Global Candy Market Revenue Million Forecast, by Distribution Channel 2019 & 2032
- Table 51: Global Candy Market Revenue Million Forecast, by Country 2019 & 2032
- Table 52: India Candy Market Revenue (Million) Forecast, by Application 2019 & 2032
- Table 53: China Candy Market Revenue (Million) Forecast, by Application 2019 & 2032
- Table 54: Australia Candy Market Revenue (Million) Forecast, by Application 2019 & 2032
- Table 55: Japan Candy Market Revenue (Million) Forecast, by Application 2019 & 2032
- Table 56: Rest of Asia Pacific Candy Market Revenue (Million) Forecast, by Application 2019 & 2032
- Table 57: Global Candy Market Revenue Million Forecast, by Type 2019 & 2032
- Table 58: Global Candy Market Revenue Million Forecast, by Distribution Channel 2019 & 2032
- Table 59: Global Candy Market Revenue Million Forecast, by Country 2019 & 2032
- Table 60: Brazil Candy Market Revenue (Million) Forecast, by Application 2019 & 2032
- Table 61: Argentina Candy Market Revenue (Million) Forecast, by Application 2019 & 2032
- Table 62: Rest of South America Candy Market Revenue (Million) Forecast, by Application 2019 & 2032
- Table 63: Global Candy Market Revenue Million Forecast, by Type 2019 & 2032
- Table 64: Global Candy Market Revenue Million Forecast, by Distribution Channel 2019 & 2032
- Table 65: Global Candy Market Revenue Million Forecast, by Country 2019 & 2032
- Table 66: United Arab Emirates Candy Market Revenue (Million) Forecast, by Application 2019 & 2032
- Table 67: South Africa Candy Market Revenue (Million) Forecast, by Application 2019 & 2032
- Table 68: Rest of Middle East and Africa Candy Market Revenue (Million) Forecast, by Application 2019 & 2032
Frequently Asked Questions
1. What is the projected Compound Annual Growth Rate (CAGR) of the Candy Market?
The projected CAGR is approximately 3.82%.
2. Which companies are prominent players in the Candy Market?
Key companies in the market include Nestle SA, Haribo GmbH & Co KG, Ferrero Group, Grupo Arcor, Mars Incorporated, Cloetta Ab, Mondelez International Inc, The Topps Company Inc *List Not Exhaustive, Perfetti Van Melle Group BV, The Hershey Company.
3. What are the main segments of the Candy Market?
The market segments include Type, Distribution Channel.
4. Can you provide details about the market size?
The market size is estimated to be USD 69.20 Million as of 2022.
5. What are some drivers contributing to market growth?
Iced Tea as a Healthy Alternative for Daily Intake; Introduction of Innovative and Flavorful Iced Tea Options.
6. What are the notable trends driving market growth?
Rising Demand for Sugar-free Candies.
7. Are there any restraints impacting market growth?
Competiton From Substitutes.
8. Can you provide examples of recent developments in the market?
In May 2022, Push Pop Gummy Pop-its were introduced by Bazooka Candy Brands. This year's Sweet & Snacks Expo in Chicago will feature the newest gummy innovation. Push Pop Gummy Pop-its, which debuted under the Push Pop brand, combine gummies with an interactive, refillable container.
9. What pricing options are available for accessing the report?
Pricing options include single-user, multi-user, and enterprise licenses priced at USD 4750, USD 5250, and USD 8750 respectively.
10. Is the market size provided in terms of value or volume?
The market size is provided in terms of value, measured in Million.
11. Are there any specific market keywords associated with the report?
Yes, the market keyword associated with the report is "Candy Market," which aids in identifying and referencing the specific market segment covered.
12. How do I determine which pricing option suits my needs best?
The pricing options vary based on user requirements and access needs. Individual users may opt for single-user licenses, while businesses requiring broader access may choose multi-user or enterprise licenses for cost-effective access to the report.
13. Are there any additional resources or data provided in the Candy Market report?
While the report offers comprehensive insights, it's advisable to review the specific contents or supplementary materials provided to ascertain if additional resources or data are available.
14. How can I stay updated on further developments or reports in the Candy Market?
To stay informed about further developments, trends, and reports in the Candy Market, consider subscribing to industry newsletters, following relevant companies and organizations, or regularly checking reputable industry news sources and publications.
Methodology
Step 1 - Identification of Relevant Samples Size from Population Database


Step 2 - Approaches for Defining Global Market Size (Value, Volume* & Price*)

Note*: In applicable scenarios
Step 3 - Data Sources
Primary Research
- Web Analytics
- Survey Reports
- Research Institute
- Latest Research Reports
- Opinion Leaders
Secondary Research
- Annual Reports
- White Paper
- Latest Press Release
- Industry Association
- Paid Database
- Investor Presentations

Step 4 - Data Triangulation
Involves using different sources of information in order to increase the validity of a study
These sources are likely to be stakeholders in a program - participants, other researchers, program staff, other community members, and so on.
Then we put all data in single framework & apply various statistical tools to find out the dynamic on the market.
During the analysis stage, feedback from the stakeholder groups would be compared to determine areas of agreement as well as areas of divergence
