

Key Insights
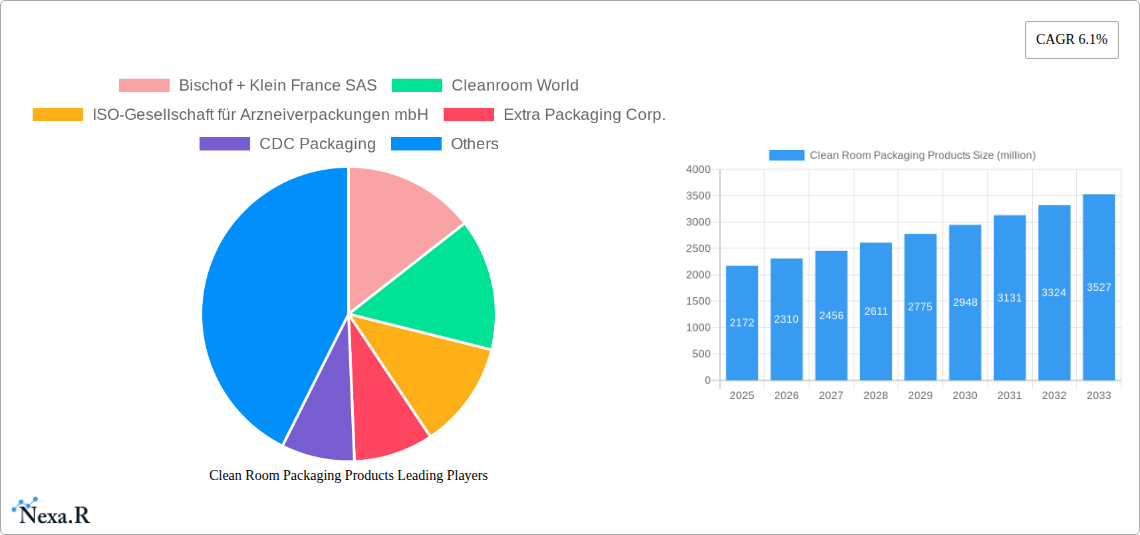
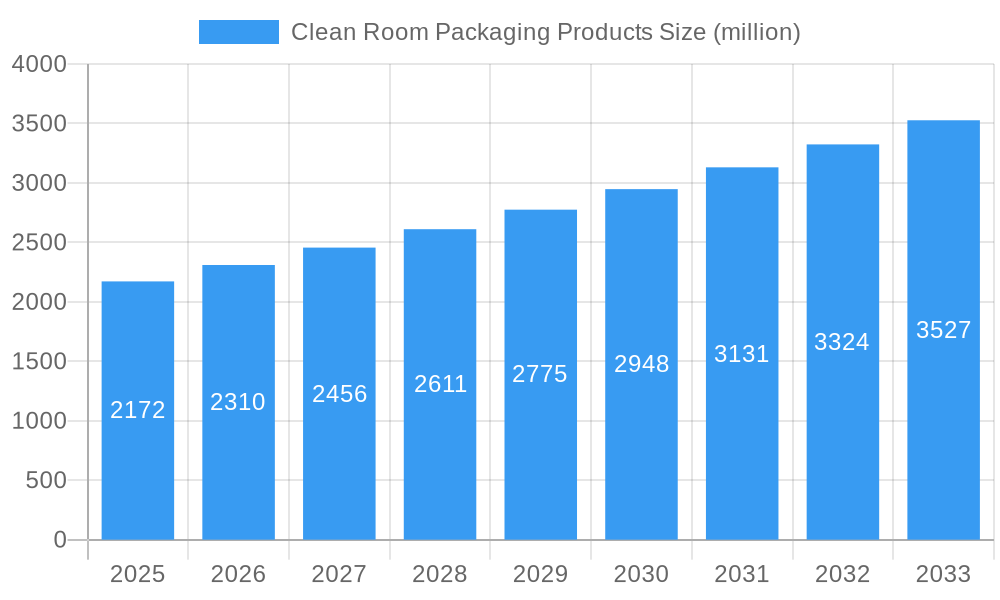
The cleanroom packaging market, valued at $2172 million in 2025, is projected to experience robust growth, driven by the increasing demand for contamination-free environments across various industries. The pharmaceutical and healthcare sectors are major contributors, necessitating stringent packaging solutions to maintain product sterility and integrity. Technological advancements in barrier materials, such as specialized films and pouches offering enhanced protection against moisture, oxygen, and microbial contamination, are fueling market expansion. Furthermore, rising regulatory standards regarding product safety and traceability are compelling manufacturers to adopt sophisticated cleanroom packaging solutions. The market's growth is also influenced by the expanding adoption of aseptic processing techniques and the growing prevalence of single-use technologies in pharmaceutical manufacturing. This shift reduces the risk of cross-contamination and improves efficiency, creating a substantial demand for specialized packaging.
Clean Room Packaging Products Market Size (In Billion)
The projected Compound Annual Growth Rate (CAGR) of 6.1% from 2025 to 2033 indicates a substantial increase in market size. This growth will be fueled by factors such as the rising adoption of advanced cleanroom technologies across various sectors including medical devices, electronics, and biotechnology. Increased focus on supply chain integrity, including enhanced traceability and anti-counterfeiting measures incorporated into packaging, will further drive market expansion. While some challenges exist, such as fluctuations in raw material prices and increasing competition, the overall market outlook remains positive due to the persistent need for contamination-free environments and the continuous development of innovative packaging solutions. The competitive landscape comprises a mix of established players and emerging companies, with ongoing mergers and acquisitions further shaping the market dynamics.
Clean Room Packaging Products Company Market Share
Clean Room Packaging Products Market Report: 2019-2033
This comprehensive report provides a detailed analysis of the Clean Room Packaging Products market, encompassing market dynamics, growth trends, regional dominance, product landscape, key players, and future outlook. The study period spans from 2019 to 2033, with 2025 serving as the base and estimated year. The report leverages extensive primary and secondary research to deliver actionable insights for industry professionals and strategic decision-makers. The market is segmented by product type and end-use industry, providing a granular understanding of various market niches. The parent market is the packaging industry, and the child market is specialized cleanroom packaging solutions. The total market value in 2025 is estimated to be xx million units.
Clean Room Packaging Products Market Dynamics & Structure
This section analyzes the competitive landscape, technological advancements, regulatory influences, and market trends within the Clean Room Packaging Products market. The market is moderately consolidated, with several key players holding significant market share. Technological innovation, particularly in barrier materials and automation, is a key driver. Stringent regulatory requirements, particularly in healthcare and pharmaceuticals, shape product development and manufacturing processes. The market experiences moderate M&A activity, with consolidation expected to continue.
- Market Concentration: Moderately concentrated, with top 5 players holding approximately xx% market share in 2025.
- Technological Innovation: Focus on sustainable materials, automated packaging solutions, and improved barrier properties.
- Regulatory Framework: Stringent regulations in pharmaceuticals and healthcare drive demand for compliant packaging.
- Competitive Substitutes: Limited direct substitutes, but pressure from generic packaging materials exists.
- End-User Demographics: Primarily pharmaceutical, biotechnology, medical device, and electronics industries.
- M&A Trends: Moderate activity, driven by consolidation and expansion into new markets (approximately xx deals in the last 5 years).
Clean Room Packaging Products Growth Trends & Insights
The Clean Room Packaging Products market experienced steady growth from 2019 to 2024, with a projected Compound Annual Growth Rate (CAGR) of xx% during the forecast period (2025-2033). This growth is primarily fueled by increasing demand from the pharmaceutical and healthcare sectors, driven by stringent regulatory compliance and rising healthcare expenditure. Technological advancements in packaging materials and automation are further accelerating market expansion. Market penetration is expected to increase significantly across various end-use industries. The market size is projected to reach xx million units by 2033.
Dominant Regions, Countries, or Segments in Clean Room Packaging Products
North America and Europe currently dominate the Clean Room Packaging Products market, driven by robust healthcare infrastructure and stringent regulatory environments. However, Asia-Pacific is projected to exhibit the highest growth rate during the forecast period, fueled by rising healthcare spending and expanding pharmaceutical manufacturing capabilities. The pharmaceutical segment holds the largest market share, followed by the medical device segment.
- North America: Strong regulatory framework and high healthcare expenditure contribute to market dominance.
- Europe: Similar to North America, high regulatory compliance and developed healthcare infrastructure drive demand.
- Asia-Pacific: Rapid growth driven by increasing healthcare spending and expanding pharmaceutical manufacturing.
- Market Share: North America (xx%), Europe (xx%), Asia-Pacific (xx%), Rest of World (xx%) in 2025.
Clean Room Packaging Products Product Landscape
The Clean Room Packaging Products market offers a diverse range of solutions, including pouches, bags, blister packs, and trays made from various materials like Tyvek, PET, and other barrier films. Innovations focus on enhanced barrier properties, improved sterility assurance, and sustainable materials. Unique selling propositions include specialized coatings for enhanced protection and traceability features. Technological advancements include automation for faster and more efficient packaging processes.
Key Drivers, Barriers & Challenges in Clean Room Packaging Products
Key Drivers:
- Growing demand from pharmaceutical and healthcare industries.
- Stringent regulatory compliance requirements.
- Technological advancements in materials and automation.
- Increasing focus on sterile and contamination-free packaging.
Challenges & Restraints:
- Fluctuations in raw material prices.
- Stringent regulatory compliance requirements (adding to costs).
- Intense competition among existing players.
- Supply chain disruptions due to geopolitical factors impacting approx. xx% of production in 2024.
Emerging Opportunities in Clean Room Packaging Products
Emerging opportunities lie in sustainable packaging solutions, customized packaging designs, and the integration of smart packaging technologies. Untapped markets in developing economies offer significant potential. The increasing demand for personalized medicine creates opportunities for specialized packaging solutions. Growth within the diagnostics and personalized medicine segments is expected to contribute to market expansion.
Growth Accelerators in the Clean Room Packaging Products Industry
Technological breakthroughs in barrier materials, automation, and traceability are key drivers of long-term growth. Strategic partnerships between packaging manufacturers and pharmaceutical companies will foster innovation and market expansion. Expanding into emerging markets and developing tailored packaging solutions for specific end-user needs will further accelerate market growth.
Key Players Shaping the Clean Room Packaging Products Market
- Bischof + Klein France SAS
- Cleanroom World
- ISO-Gesellschaft für Arzneiverpackungen mbH
- Extra Packaging Corp.
- CDC Packaging
- BIG VALLEY PACKAGING
- CleanPro® Cleanroom Products
- Correct Products
- Dwparts
- Strubl GmbH & Co. KG
- Cleanroom Film & Bags
- Cardinal UHP
- NEFAB GROUP
- Audion Elektro B.V.
- Merck KGaA
- Nabeya Bi-tech
- Diversified Manufacturing Corporation
Notable Milestones in Clean Room Packaging Products Sector
- 2020: Introduction of a new sustainable packaging material by a major player.
- 2022: Merger between two significant companies in the sector, increasing market concentration.
- 2023: Launch of automated packaging line by a key player increasing efficiency by xx%.
- 2024: Implementation of new regulatory standards impacting packaging design and material selection.
In-Depth Clean Room Packaging Products Market Outlook
The Clean Room Packaging Products market is poised for sustained growth driven by technological advancements, increasing regulatory compliance needs, and the expansion of the pharmaceutical and healthcare industries. Strategic partnerships and investment in innovative packaging solutions will shape future market dynamics. The market presents significant opportunities for companies focusing on sustainability, automation, and personalized packaging solutions. The long-term outlook is positive, with consistent growth projected throughout the forecast period.
Clean Room Packaging Products Segmentation
-
1. Application
- 1.1. Semiconductor Wafers
- 1.2. Medical Devices
- 1.3. Industrial Manufacturing
- 1.4. Others
-
2. Type
- 2.1. Bags
- 2.2. Films
- 2.3. Tubings
- 2.4. Others
Clean Room Packaging Products Segmentation By Geography
-
1. North America
- 1.1. United States
- 1.2. Canada
- 1.3. Mexico
-
2. South America
- 2.1. Brazil
- 2.2. Argentina
- 2.3. Rest of South America
-
3. Europe
- 3.1. United Kingdom
- 3.2. Germany
- 3.3. France
- 3.4. Italy
- 3.5. Spain
- 3.6. Russia
- 3.7. Benelux
- 3.8. Nordics
- 3.9. Rest of Europe
-
4. Middle East & Africa
- 4.1. Turkey
- 4.2. Israel
- 4.3. GCC
- 4.4. North Africa
- 4.5. South Africa
- 4.6. Rest of Middle East & Africa
-
5. Asia Pacific
- 5.1. China
- 5.2. India
- 5.3. Japan
- 5.4. South Korea
- 5.5. ASEAN
- 5.6. Oceania
- 5.7. Rest of Asia Pacific

Clean Room Packaging Products Regional Market Share
Geographic Coverage of Clean Room Packaging Products
Clean Room Packaging Products REPORT HIGHLIGHTS
| Aspects | Details |
|---|---|
| Study Period | 2020-2034 |
| Base Year | 2025 |
| Estimated Year | 2026 |
| Forecast Period | 2026-2034 |
| Historical Period | 2020-2025 |
| Growth Rate | CAGR of 7.2% from 2020-2034 |
| Segmentation |
|
Table of Contents
- 1. Introduction
- 1.1. Research Scope
- 1.2. Market Segmentation
- 1.3. Research Methodology
- 1.4. Definitions and Assumptions
- 2. Executive Summary
- 2.1. Introduction
- 3. Market Dynamics
- 3.1. Introduction
- 3.2. Market Drivers
- 3.3. Market Restrains
- 3.4. Market Trends
- 4. Market Factor Analysis
- 4.1. Porters Five Forces
- 4.2. Supply/Value Chain
- 4.3. PESTEL analysis
- 4.4. Market Entropy
- 4.5. Patent/Trademark Analysis
- 5. Global Clean Room Packaging Products Analysis, Insights and Forecast, 2020-2032
- 5.1. Market Analysis, Insights and Forecast - by Application
- 5.1.1. Semiconductor Wafers
- 5.1.2. Medical Devices
- 5.1.3. Industrial Manufacturing
- 5.1.4. Others
- 5.2. Market Analysis, Insights and Forecast - by Type
- 5.2.1. Bags
- 5.2.2. Films
- 5.2.3. Tubings
- 5.2.4. Others
- 5.3. Market Analysis, Insights and Forecast - by Region
- 5.3.1. North America
- 5.3.2. South America
- 5.3.3. Europe
- 5.3.4. Middle East & Africa
- 5.3.5. Asia Pacific
- 5.1. Market Analysis, Insights and Forecast - by Application
- 6. North America Clean Room Packaging Products Analysis, Insights and Forecast, 2020-2032
- 6.1. Market Analysis, Insights and Forecast - by Application
- 6.1.1. Semiconductor Wafers
- 6.1.2. Medical Devices
- 6.1.3. Industrial Manufacturing
- 6.1.4. Others
- 6.2. Market Analysis, Insights and Forecast - by Type
- 6.2.1. Bags
- 6.2.2. Films
- 6.2.3. Tubings
- 6.2.4. Others
- 6.1. Market Analysis, Insights and Forecast - by Application
- 7. South America Clean Room Packaging Products Analysis, Insights and Forecast, 2020-2032
- 7.1. Market Analysis, Insights and Forecast - by Application
- 7.1.1. Semiconductor Wafers
- 7.1.2. Medical Devices
- 7.1.3. Industrial Manufacturing
- 7.1.4. Others
- 7.2. Market Analysis, Insights and Forecast - by Type
- 7.2.1. Bags
- 7.2.2. Films
- 7.2.3. Tubings
- 7.2.4. Others
- 7.1. Market Analysis, Insights and Forecast - by Application
- 8. Europe Clean Room Packaging Products Analysis, Insights and Forecast, 2020-2032
- 8.1. Market Analysis, Insights and Forecast - by Application
- 8.1.1. Semiconductor Wafers
- 8.1.2. Medical Devices
- 8.1.3. Industrial Manufacturing
- 8.1.4. Others
- 8.2. Market Analysis, Insights and Forecast - by Type
- 8.2.1. Bags
- 8.2.2. Films
- 8.2.3. Tubings
- 8.2.4. Others
- 8.1. Market Analysis, Insights and Forecast - by Application
- 9. Middle East & Africa Clean Room Packaging Products Analysis, Insights and Forecast, 2020-2032
- 9.1. Market Analysis, Insights and Forecast - by Application
- 9.1.1. Semiconductor Wafers
- 9.1.2. Medical Devices
- 9.1.3. Industrial Manufacturing
- 9.1.4. Others
- 9.2. Market Analysis, Insights and Forecast - by Type
- 9.2.1. Bags
- 9.2.2. Films
- 9.2.3. Tubings
- 9.2.4. Others
- 9.1. Market Analysis, Insights and Forecast - by Application
- 10. Asia Pacific Clean Room Packaging Products Analysis, Insights and Forecast, 2020-2032
- 10.1. Market Analysis, Insights and Forecast - by Application
- 10.1.1. Semiconductor Wafers
- 10.1.2. Medical Devices
- 10.1.3. Industrial Manufacturing
- 10.1.4. Others
- 10.2. Market Analysis, Insights and Forecast - by Type
- 10.2.1. Bags
- 10.2.2. Films
- 10.2.3. Tubings
- 10.2.4. Others
- 10.1. Market Analysis, Insights and Forecast - by Application
- 11. Competitive Analysis
- 11.1. Global Market Share Analysis 2025
- 11.2. Company Profiles
- 11.2.1 Bischof + Klein France SAS
- 11.2.1.1. Overview
- 11.2.1.2. Products
- 11.2.1.3. SWOT Analysis
- 11.2.1.4. Recent Developments
- 11.2.1.5. Financials (Based on Availability)
- 11.2.2 Cleanroom World
- 11.2.2.1. Overview
- 11.2.2.2. Products
- 11.2.2.3. SWOT Analysis
- 11.2.2.4. Recent Developments
- 11.2.2.5. Financials (Based on Availability)
- 11.2.3 ISO-Gesellschaft für Arzneiverpackungen mbH
- 11.2.3.1. Overview
- 11.2.3.2. Products
- 11.2.3.3. SWOT Analysis
- 11.2.3.4. Recent Developments
- 11.2.3.5. Financials (Based on Availability)
- 11.2.4 Extra Packaging Corp.
- 11.2.4.1. Overview
- 11.2.4.2. Products
- 11.2.4.3. SWOT Analysis
- 11.2.4.4. Recent Developments
- 11.2.4.5. Financials (Based on Availability)
- 11.2.5 CDC Packaging
- 11.2.5.1. Overview
- 11.2.5.2. Products
- 11.2.5.3. SWOT Analysis
- 11.2.5.4. Recent Developments
- 11.2.5.5. Financials (Based on Availability)
- 11.2.6 BIG VALLEY PACKAGING
- 11.2.6.1. Overview
- 11.2.6.2. Products
- 11.2.6.3. SWOT Analysis
- 11.2.6.4. Recent Developments
- 11.2.6.5. Financials (Based on Availability)
- 11.2.7 CleanPro® Cleanroom Products
- 11.2.7.1. Overview
- 11.2.7.2. Products
- 11.2.7.3. SWOT Analysis
- 11.2.7.4. Recent Developments
- 11.2.7.5. Financials (Based on Availability)
- 11.2.8 Correct Products
- 11.2.8.1. Overview
- 11.2.8.2. Products
- 11.2.8.3. SWOT Analysis
- 11.2.8.4. Recent Developments
- 11.2.8.5. Financials (Based on Availability)
- 11.2.9 Dwparts
- 11.2.9.1. Overview
- 11.2.9.2. Products
- 11.2.9.3. SWOT Analysis
- 11.2.9.4. Recent Developments
- 11.2.9.5. Financials (Based on Availability)
- 11.2.10 Strubl GmbH & Co. KG
- 11.2.10.1. Overview
- 11.2.10.2. Products
- 11.2.10.3. SWOT Analysis
- 11.2.10.4. Recent Developments
- 11.2.10.5. Financials (Based on Availability)
- 11.2.11 Cleanroom Film & Bags
- 11.2.11.1. Overview
- 11.2.11.2. Products
- 11.2.11.3. SWOT Analysis
- 11.2.11.4. Recent Developments
- 11.2.11.5. Financials (Based on Availability)
- 11.2.12 Cardinal UHP
- 11.2.12.1. Overview
- 11.2.12.2. Products
- 11.2.12.3. SWOT Analysis
- 11.2.12.4. Recent Developments
- 11.2.12.5. Financials (Based on Availability)
- 11.2.13 NEFAB GROUP
- 11.2.13.1. Overview
- 11.2.13.2. Products
- 11.2.13.3. SWOT Analysis
- 11.2.13.4. Recent Developments
- 11.2.13.5. Financials (Based on Availability)
- 11.2.14 Audion Elektro B.V.
- 11.2.14.1. Overview
- 11.2.14.2. Products
- 11.2.14.3. SWOT Analysis
- 11.2.14.4. Recent Developments
- 11.2.14.5. Financials (Based on Availability)
- 11.2.15 Merck KGaA
- 11.2.15.1. Overview
- 11.2.15.2. Products
- 11.2.15.3. SWOT Analysis
- 11.2.15.4. Recent Developments
- 11.2.15.5. Financials (Based on Availability)
- 11.2.16 Nabeya Bi-tech
- 11.2.16.1. Overview
- 11.2.16.2. Products
- 11.2.16.3. SWOT Analysis
- 11.2.16.4. Recent Developments
- 11.2.16.5. Financials (Based on Availability)
- 11.2.17 Diversified Manufacturing Corporation
- 11.2.17.1. Overview
- 11.2.17.2. Products
- 11.2.17.3. SWOT Analysis
- 11.2.17.4. Recent Developments
- 11.2.17.5. Financials (Based on Availability)
- 11.2.1 Bischof + Klein France SAS
List of Figures
- Figure 1: Global Clean Room Packaging Products Revenue Breakdown (undefined, %) by Region 2025 & 2033
- Figure 2: Global Clean Room Packaging Products Volume Breakdown (K, %) by Region 2025 & 2033
- Figure 3: North America Clean Room Packaging Products Revenue (undefined), by Application 2025 & 2033
- Figure 4: North America Clean Room Packaging Products Volume (K), by Application 2025 & 2033
- Figure 5: North America Clean Room Packaging Products Revenue Share (%), by Application 2025 & 2033
- Figure 6: North America Clean Room Packaging Products Volume Share (%), by Application 2025 & 2033
- Figure 7: North America Clean Room Packaging Products Revenue (undefined), by Type 2025 & 2033
- Figure 8: North America Clean Room Packaging Products Volume (K), by Type 2025 & 2033
- Figure 9: North America Clean Room Packaging Products Revenue Share (%), by Type 2025 & 2033
- Figure 10: North America Clean Room Packaging Products Volume Share (%), by Type 2025 & 2033
- Figure 11: North America Clean Room Packaging Products Revenue (undefined), by Country 2025 & 2033
- Figure 12: North America Clean Room Packaging Products Volume (K), by Country 2025 & 2033
- Figure 13: North America Clean Room Packaging Products Revenue Share (%), by Country 2025 & 2033
- Figure 14: North America Clean Room Packaging Products Volume Share (%), by Country 2025 & 2033
- Figure 15: South America Clean Room Packaging Products Revenue (undefined), by Application 2025 & 2033
- Figure 16: South America Clean Room Packaging Products Volume (K), by Application 2025 & 2033
- Figure 17: South America Clean Room Packaging Products Revenue Share (%), by Application 2025 & 2033
- Figure 18: South America Clean Room Packaging Products Volume Share (%), by Application 2025 & 2033
- Figure 19: South America Clean Room Packaging Products Revenue (undefined), by Type 2025 & 2033
- Figure 20: South America Clean Room Packaging Products Volume (K), by Type 2025 & 2033
- Figure 21: South America Clean Room Packaging Products Revenue Share (%), by Type 2025 & 2033
- Figure 22: South America Clean Room Packaging Products Volume Share (%), by Type 2025 & 2033
- Figure 23: South America Clean Room Packaging Products Revenue (undefined), by Country 2025 & 2033
- Figure 24: South America Clean Room Packaging Products Volume (K), by Country 2025 & 2033
- Figure 25: South America Clean Room Packaging Products Revenue Share (%), by Country 2025 & 2033
- Figure 26: South America Clean Room Packaging Products Volume Share (%), by Country 2025 & 2033
- Figure 27: Europe Clean Room Packaging Products Revenue (undefined), by Application 2025 & 2033
- Figure 28: Europe Clean Room Packaging Products Volume (K), by Application 2025 & 2033
- Figure 29: Europe Clean Room Packaging Products Revenue Share (%), by Application 2025 & 2033
- Figure 30: Europe Clean Room Packaging Products Volume Share (%), by Application 2025 & 2033
- Figure 31: Europe Clean Room Packaging Products Revenue (undefined), by Type 2025 & 2033
- Figure 32: Europe Clean Room Packaging Products Volume (K), by Type 2025 & 2033
- Figure 33: Europe Clean Room Packaging Products Revenue Share (%), by Type 2025 & 2033
- Figure 34: Europe Clean Room Packaging Products Volume Share (%), by Type 2025 & 2033
- Figure 35: Europe Clean Room Packaging Products Revenue (undefined), by Country 2025 & 2033
- Figure 36: Europe Clean Room Packaging Products Volume (K), by Country 2025 & 2033
- Figure 37: Europe Clean Room Packaging Products Revenue Share (%), by Country 2025 & 2033
- Figure 38: Europe Clean Room Packaging Products Volume Share (%), by Country 2025 & 2033
- Figure 39: Middle East & Africa Clean Room Packaging Products Revenue (undefined), by Application 2025 & 2033
- Figure 40: Middle East & Africa Clean Room Packaging Products Volume (K), by Application 2025 & 2033
- Figure 41: Middle East & Africa Clean Room Packaging Products Revenue Share (%), by Application 2025 & 2033
- Figure 42: Middle East & Africa Clean Room Packaging Products Volume Share (%), by Application 2025 & 2033
- Figure 43: Middle East & Africa Clean Room Packaging Products Revenue (undefined), by Type 2025 & 2033
- Figure 44: Middle East & Africa Clean Room Packaging Products Volume (K), by Type 2025 & 2033
- Figure 45: Middle East & Africa Clean Room Packaging Products Revenue Share (%), by Type 2025 & 2033
- Figure 46: Middle East & Africa Clean Room Packaging Products Volume Share (%), by Type 2025 & 2033
- Figure 47: Middle East & Africa Clean Room Packaging Products Revenue (undefined), by Country 2025 & 2033
- Figure 48: Middle East & Africa Clean Room Packaging Products Volume (K), by Country 2025 & 2033
- Figure 49: Middle East & Africa Clean Room Packaging Products Revenue Share (%), by Country 2025 & 2033
- Figure 50: Middle East & Africa Clean Room Packaging Products Volume Share (%), by Country 2025 & 2033
- Figure 51: Asia Pacific Clean Room Packaging Products Revenue (undefined), by Application 2025 & 2033
- Figure 52: Asia Pacific Clean Room Packaging Products Volume (K), by Application 2025 & 2033
- Figure 53: Asia Pacific Clean Room Packaging Products Revenue Share (%), by Application 2025 & 2033
- Figure 54: Asia Pacific Clean Room Packaging Products Volume Share (%), by Application 2025 & 2033
- Figure 55: Asia Pacific Clean Room Packaging Products Revenue (undefined), by Type 2025 & 2033
- Figure 56: Asia Pacific Clean Room Packaging Products Volume (K), by Type 2025 & 2033
- Figure 57: Asia Pacific Clean Room Packaging Products Revenue Share (%), by Type 2025 & 2033
- Figure 58: Asia Pacific Clean Room Packaging Products Volume Share (%), by Type 2025 & 2033
- Figure 59: Asia Pacific Clean Room Packaging Products Revenue (undefined), by Country 2025 & 2033
- Figure 60: Asia Pacific Clean Room Packaging Products Volume (K), by Country 2025 & 2033
- Figure 61: Asia Pacific Clean Room Packaging Products Revenue Share (%), by Country 2025 & 2033
- Figure 62: Asia Pacific Clean Room Packaging Products Volume Share (%), by Country 2025 & 2033
List of Tables
- Table 1: Global Clean Room Packaging Products Revenue undefined Forecast, by Application 2020 & 2033
- Table 2: Global Clean Room Packaging Products Volume K Forecast, by Application 2020 & 2033
- Table 3: Global Clean Room Packaging Products Revenue undefined Forecast, by Type 2020 & 2033
- Table 4: Global Clean Room Packaging Products Volume K Forecast, by Type 2020 & 2033
- Table 5: Global Clean Room Packaging Products Revenue undefined Forecast, by Region 2020 & 2033
- Table 6: Global Clean Room Packaging Products Volume K Forecast, by Region 2020 & 2033
- Table 7: Global Clean Room Packaging Products Revenue undefined Forecast, by Application 2020 & 2033
- Table 8: Global Clean Room Packaging Products Volume K Forecast, by Application 2020 & 2033
- Table 9: Global Clean Room Packaging Products Revenue undefined Forecast, by Type 2020 & 2033
- Table 10: Global Clean Room Packaging Products Volume K Forecast, by Type 2020 & 2033
- Table 11: Global Clean Room Packaging Products Revenue undefined Forecast, by Country 2020 & 2033
- Table 12: Global Clean Room Packaging Products Volume K Forecast, by Country 2020 & 2033
- Table 13: United States Clean Room Packaging Products Revenue (undefined) Forecast, by Application 2020 & 2033
- Table 14: United States Clean Room Packaging Products Volume (K) Forecast, by Application 2020 & 2033
- Table 15: Canada Clean Room Packaging Products Revenue (undefined) Forecast, by Application 2020 & 2033
- Table 16: Canada Clean Room Packaging Products Volume (K) Forecast, by Application 2020 & 2033
- Table 17: Mexico Clean Room Packaging Products Revenue (undefined) Forecast, by Application 2020 & 2033
- Table 18: Mexico Clean Room Packaging Products Volume (K) Forecast, by Application 2020 & 2033
- Table 19: Global Clean Room Packaging Products Revenue undefined Forecast, by Application 2020 & 2033
- Table 20: Global Clean Room Packaging Products Volume K Forecast, by Application 2020 & 2033
- Table 21: Global Clean Room Packaging Products Revenue undefined Forecast, by Type 2020 & 2033
- Table 22: Global Clean Room Packaging Products Volume K Forecast, by Type 2020 & 2033
- Table 23: Global Clean Room Packaging Products Revenue undefined Forecast, by Country 2020 & 2033
- Table 24: Global Clean Room Packaging Products Volume K Forecast, by Country 2020 & 2033
- Table 25: Brazil Clean Room Packaging Products Revenue (undefined) Forecast, by Application 2020 & 2033
- Table 26: Brazil Clean Room Packaging Products Volume (K) Forecast, by Application 2020 & 2033
- Table 27: Argentina Clean Room Packaging Products Revenue (undefined) Forecast, by Application 2020 & 2033
- Table 28: Argentina Clean Room Packaging Products Volume (K) Forecast, by Application 2020 & 2033
- Table 29: Rest of South America Clean Room Packaging Products Revenue (undefined) Forecast, by Application 2020 & 2033
- Table 30: Rest of South America Clean Room Packaging Products Volume (K) Forecast, by Application 2020 & 2033
- Table 31: Global Clean Room Packaging Products Revenue undefined Forecast, by Application 2020 & 2033
- Table 32: Global Clean Room Packaging Products Volume K Forecast, by Application 2020 & 2033
- Table 33: Global Clean Room Packaging Products Revenue undefined Forecast, by Type 2020 & 2033
- Table 34: Global Clean Room Packaging Products Volume K Forecast, by Type 2020 & 2033
- Table 35: Global Clean Room Packaging Products Revenue undefined Forecast, by Country 2020 & 2033
- Table 36: Global Clean Room Packaging Products Volume K Forecast, by Country 2020 & 2033
- Table 37: United Kingdom Clean Room Packaging Products Revenue (undefined) Forecast, by Application 2020 & 2033
- Table 38: United Kingdom Clean Room Packaging Products Volume (K) Forecast, by Application 2020 & 2033
- Table 39: Germany Clean Room Packaging Products Revenue (undefined) Forecast, by Application 2020 & 2033
- Table 40: Germany Clean Room Packaging Products Volume (K) Forecast, by Application 2020 & 2033
- Table 41: France Clean Room Packaging Products Revenue (undefined) Forecast, by Application 2020 & 2033
- Table 42: France Clean Room Packaging Products Volume (K) Forecast, by Application 2020 & 2033
- Table 43: Italy Clean Room Packaging Products Revenue (undefined) Forecast, by Application 2020 & 2033
- Table 44: Italy Clean Room Packaging Products Volume (K) Forecast, by Application 2020 & 2033
- Table 45: Spain Clean Room Packaging Products Revenue (undefined) Forecast, by Application 2020 & 2033
- Table 46: Spain Clean Room Packaging Products Volume (K) Forecast, by Application 2020 & 2033
- Table 47: Russia Clean Room Packaging Products Revenue (undefined) Forecast, by Application 2020 & 2033
- Table 48: Russia Clean Room Packaging Products Volume (K) Forecast, by Application 2020 & 2033
- Table 49: Benelux Clean Room Packaging Products Revenue (undefined) Forecast, by Application 2020 & 2033
- Table 50: Benelux Clean Room Packaging Products Volume (K) Forecast, by Application 2020 & 2033
- Table 51: Nordics Clean Room Packaging Products Revenue (undefined) Forecast, by Application 2020 & 2033
- Table 52: Nordics Clean Room Packaging Products Volume (K) Forecast, by Application 2020 & 2033
- Table 53: Rest of Europe Clean Room Packaging Products Revenue (undefined) Forecast, by Application 2020 & 2033
- Table 54: Rest of Europe Clean Room Packaging Products Volume (K) Forecast, by Application 2020 & 2033
- Table 55: Global Clean Room Packaging Products Revenue undefined Forecast, by Application 2020 & 2033
- Table 56: Global Clean Room Packaging Products Volume K Forecast, by Application 2020 & 2033
- Table 57: Global Clean Room Packaging Products Revenue undefined Forecast, by Type 2020 & 2033
- Table 58: Global Clean Room Packaging Products Volume K Forecast, by Type 2020 & 2033
- Table 59: Global Clean Room Packaging Products Revenue undefined Forecast, by Country 2020 & 2033
- Table 60: Global Clean Room Packaging Products Volume K Forecast, by Country 2020 & 2033
- Table 61: Turkey Clean Room Packaging Products Revenue (undefined) Forecast, by Application 2020 & 2033
- Table 62: Turkey Clean Room Packaging Products Volume (K) Forecast, by Application 2020 & 2033
- Table 63: Israel Clean Room Packaging Products Revenue (undefined) Forecast, by Application 2020 & 2033
- Table 64: Israel Clean Room Packaging Products Volume (K) Forecast, by Application 2020 & 2033
- Table 65: GCC Clean Room Packaging Products Revenue (undefined) Forecast, by Application 2020 & 2033
- Table 66: GCC Clean Room Packaging Products Volume (K) Forecast, by Application 2020 & 2033
- Table 67: North Africa Clean Room Packaging Products Revenue (undefined) Forecast, by Application 2020 & 2033
- Table 68: North Africa Clean Room Packaging Products Volume (K) Forecast, by Application 2020 & 2033
- Table 69: South Africa Clean Room Packaging Products Revenue (undefined) Forecast, by Application 2020 & 2033
- Table 70: South Africa Clean Room Packaging Products Volume (K) Forecast, by Application 2020 & 2033
- Table 71: Rest of Middle East & Africa Clean Room Packaging Products Revenue (undefined) Forecast, by Application 2020 & 2033
- Table 72: Rest of Middle East & Africa Clean Room Packaging Products Volume (K) Forecast, by Application 2020 & 2033
- Table 73: Global Clean Room Packaging Products Revenue undefined Forecast, by Application 2020 & 2033
- Table 74: Global Clean Room Packaging Products Volume K Forecast, by Application 2020 & 2033
- Table 75: Global Clean Room Packaging Products Revenue undefined Forecast, by Type 2020 & 2033
- Table 76: Global Clean Room Packaging Products Volume K Forecast, by Type 2020 & 2033
- Table 77: Global Clean Room Packaging Products Revenue undefined Forecast, by Country 2020 & 2033
- Table 78: Global Clean Room Packaging Products Volume K Forecast, by Country 2020 & 2033
- Table 79: China Clean Room Packaging Products Revenue (undefined) Forecast, by Application 2020 & 2033
- Table 80: China Clean Room Packaging Products Volume (K) Forecast, by Application 2020 & 2033
- Table 81: India Clean Room Packaging Products Revenue (undefined) Forecast, by Application 2020 & 2033
- Table 82: India Clean Room Packaging Products Volume (K) Forecast, by Application 2020 & 2033
- Table 83: Japan Clean Room Packaging Products Revenue (undefined) Forecast, by Application 2020 & 2033
- Table 84: Japan Clean Room Packaging Products Volume (K) Forecast, by Application 2020 & 2033
- Table 85: South Korea Clean Room Packaging Products Revenue (undefined) Forecast, by Application 2020 & 2033
- Table 86: South Korea Clean Room Packaging Products Volume (K) Forecast, by Application 2020 & 2033
- Table 87: ASEAN Clean Room Packaging Products Revenue (undefined) Forecast, by Application 2020 & 2033
- Table 88: ASEAN Clean Room Packaging Products Volume (K) Forecast, by Application 2020 & 2033
- Table 89: Oceania Clean Room Packaging Products Revenue (undefined) Forecast, by Application 2020 & 2033
- Table 90: Oceania Clean Room Packaging Products Volume (K) Forecast, by Application 2020 & 2033
- Table 91: Rest of Asia Pacific Clean Room Packaging Products Revenue (undefined) Forecast, by Application 2020 & 2033
- Table 92: Rest of Asia Pacific Clean Room Packaging Products Volume (K) Forecast, by Application 2020 & 2033
Frequently Asked Questions
1. What is the projected Compound Annual Growth Rate (CAGR) of the Clean Room Packaging Products?
The projected CAGR is approximately 7.2%.
2. Which companies are prominent players in the Clean Room Packaging Products?
Key companies in the market include Bischof + Klein France SAS, Cleanroom World, ISO-Gesellschaft für Arzneiverpackungen mbH, Extra Packaging Corp., CDC Packaging, BIG VALLEY PACKAGING, CleanPro® Cleanroom Products, Correct Products, Dwparts, Strubl GmbH & Co. KG, Cleanroom Film & Bags, Cardinal UHP, NEFAB GROUP, Audion Elektro B.V., Merck KGaA, Nabeya Bi-tech, Diversified Manufacturing Corporation.
3. What are the main segments of the Clean Room Packaging Products?
The market segments include Application, Type.
4. Can you provide details about the market size?
The market size is estimated to be USD XXX N/A as of 2022.
5. What are some drivers contributing to market growth?
N/A
6. What are the notable trends driving market growth?
N/A
7. Are there any restraints impacting market growth?
N/A
8. Can you provide examples of recent developments in the market?
N/A
9. What pricing options are available for accessing the report?
Pricing options include single-user, multi-user, and enterprise licenses priced at USD 3950.00, USD 5925.00, and USD 7900.00 respectively.
10. Is the market size provided in terms of value or volume?
The market size is provided in terms of value, measured in N/A and volume, measured in K.
11. Are there any specific market keywords associated with the report?
Yes, the market keyword associated with the report is "Clean Room Packaging Products," which aids in identifying and referencing the specific market segment covered.
12. How do I determine which pricing option suits my needs best?
The pricing options vary based on user requirements and access needs. Individual users may opt for single-user licenses, while businesses requiring broader access may choose multi-user or enterprise licenses for cost-effective access to the report.
13. Are there any additional resources or data provided in the Clean Room Packaging Products report?
While the report offers comprehensive insights, it's advisable to review the specific contents or supplementary materials provided to ascertain if additional resources or data are available.
14. How can I stay updated on further developments or reports in the Clean Room Packaging Products?
To stay informed about further developments, trends, and reports in the Clean Room Packaging Products, consider subscribing to industry newsletters, following relevant companies and organizations, or regularly checking reputable industry news sources and publications.
Methodology
Step 1 - Identification of Relevant Samples Size from Population Database


Step 2 - Approaches for Defining Global Market Size (Value, Volume* & Price*)

Note*: In applicable scenarios
Step 3 - Data Sources
Primary Research
- Web Analytics
- Survey Reports
- Research Institute
- Latest Research Reports
- Opinion Leaders
Secondary Research
- Annual Reports
- White Paper
- Latest Press Release
- Industry Association
- Paid Database
- Investor Presentations

Step 4 - Data Triangulation
Involves using different sources of information in order to increase the validity of a study
These sources are likely to be stakeholders in a program - participants, other researchers, program staff, other community members, and so on.
Then we put all data in single framework & apply various statistical tools to find out the dynamic on the market.
During the analysis stage, feedback from the stakeholder groups would be compared to determine areas of agreement as well as areas of divergence