

Key Insights
The global Cooking Oils and Fats market is projected for significant growth, estimated at USD 237.87 billion by 2025, with a Compound Annual Growth Rate (CAGR) of 6.47% from the base year 2025 to 2033. This expansion highlights the essential role of cooking oils and fats in global household and industrial sectors. Key drivers include shifting consumer demand towards healthier, natural food choices and escalating requirements from the processed food and foodservice industries. Rising disposable incomes in developing economies are also boosting per capita consumption of cooking oils and fats, especially premium and specialty types. Innovations in production and extraction technologies are enhancing product quality and availability, further fueling market expansion. The market is shaped by intricate dynamics across production, consumption, trade, and pricing, offering diverse opportunities and challenges.
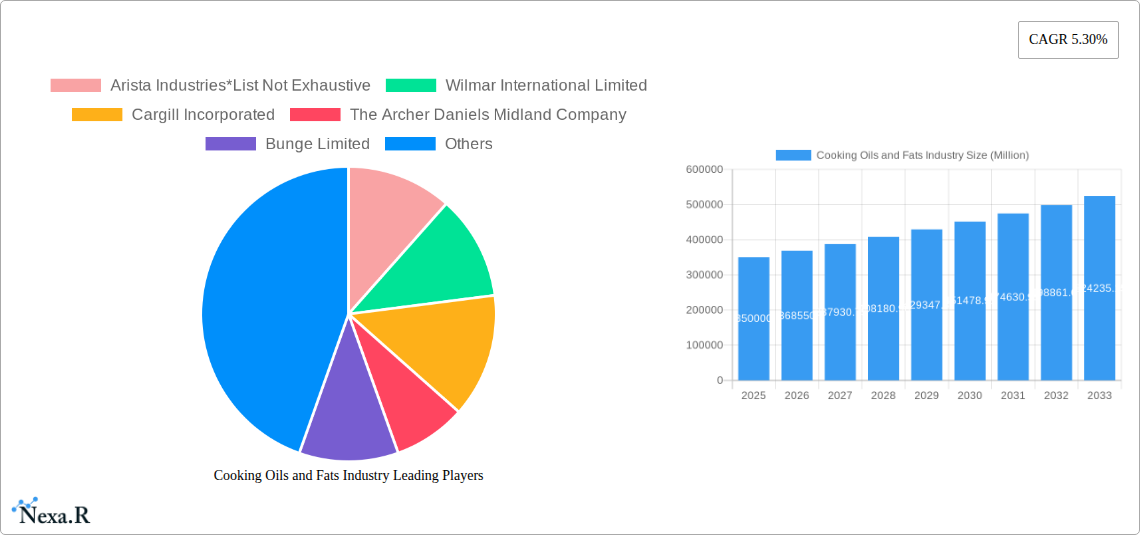
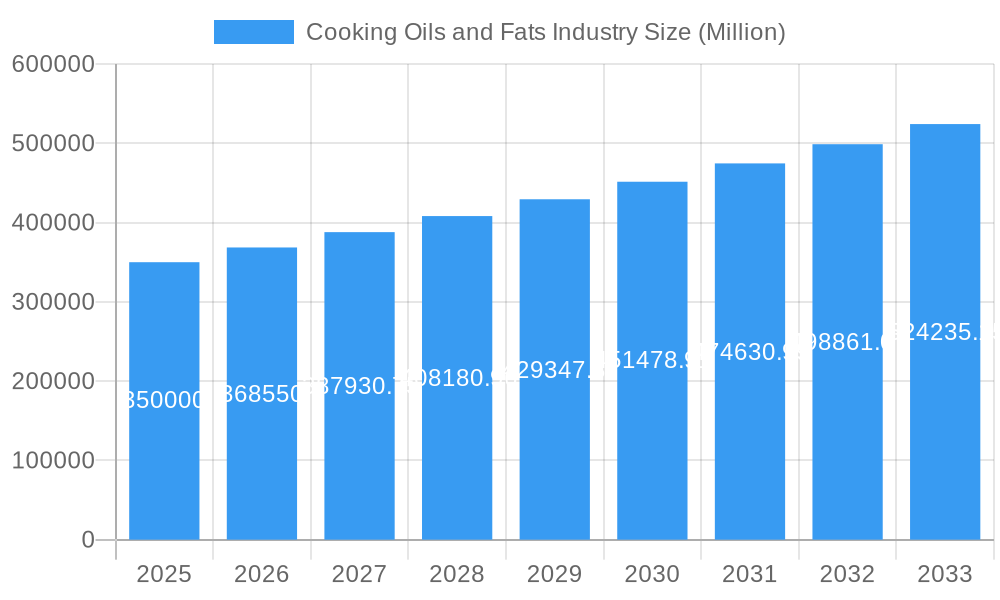
Cooking Oils and Fats Industry Market Size (In Billion)
The competitive arena comprises major global entities such as Wilmar International Limited, Cargill Incorporated, and The Archer Daniels Midland Company, alongside specialized firms like Arista Industries and Fuji Oil Holding Inc. These key players pursue strategic partnerships, mergers, and acquisitions to broaden their product offerings and market presence. Growth is further propelled by a rising global population, increased urbanization driving demand for convenient foods, and growing awareness of health benefits from specific oils like olive and canola. Market challenges include fluctuating raw material prices, stringent food safety regulations, and some consumer trends favoring home cooking and reduced fat intake. Despite these factors, the persistent demand for versatile and fundamental food ingredients forecasts a positive trajectory for the cooking oils and fats industry.
Cooking Oils and Fats Industry Company Market Share
Cooking Oils and Fats Industry Market Dynamics & Structure
The global cooking oils and fats industry is characterized by a moderately concentrated market structure, driven by significant investments in technology and evolving consumer preferences. Major players like Wilmar International Limited, Cargill Incorporated, and The Archer Daniels Midland Company hold substantial market shares, influencing production capacities and pricing strategies. Technological innovation is a key differentiator, with advancements in extraction, refining, and fractionation processes enhancing product quality and efficiency. Regulatory frameworks, particularly concerning food safety, labeling, and sustainability, play a crucial role in shaping market operations and product development. While a wide array of cooking oils and fats are available, competitive product substitutes, such as alternative healthy oils and plant-based fats, are increasingly challenging established product categories. End-user demographics, including rising health consciousness and a growing demand for plant-based and functional food ingredients, are significantly influencing consumption patterns. Mergers and acquisitions (M&A) trends are prevalent, with companies seeking to expand their product portfolios, geographical reach, and vertical integration capabilities. For instance, strategic acquisitions of smaller specialty oil producers by larger entities are common. Innovation barriers include high capital expenditure for new processing facilities and stringent R&D requirements for developing novel products with enhanced nutritional profiles.
- Market Concentration: Moderate to High due to dominance of large multinational corporations.
- Technological Drivers: Advancements in refining, expeller pressing, and enzymatic modification.
- Regulatory Landscape: Stringent food safety (e.g., HACCP, ISO), labeling (e.g., GMO status, nutritional information), and sustainability (e.g., RSPO certification for palm oil) standards.
- Product Substitutes: Olive oil, avocado oil, coconut oil, specialty fats, and hydrogenated vegetable oils.
- End-User Demographics: Health-conscious consumers, vegan/vegetarian populations, food service industry, and baked goods manufacturers.
- M&A Trends: Consolidation, vertical integration, and acquisitions for market access and technology acquisition.
Cooking Oils and Fats Industry Growth Trends & Insights
The global cooking oils and fats market is poised for robust growth, projected to expand significantly driven by a confluence of factors that are reshaping consumption patterns and industrial applications. Market size evolution is marked by a consistent upward trajectory, fueled by an increasing global population, rising disposable incomes, and a growing awareness of the link between diet and health. Adoption rates of specific cooking oils are influenced by regional culinary traditions and the perceived health benefits of different fat profiles. For example, the demand for extra virgin olive oil continues to rise in developed economies, while palm oil remains a staple in many Asian cuisines, albeit with increasing scrutiny on sustainability. Technological disruptions, such as the development of novel extraction techniques that preserve nutritional integrity and the creation of specialty fats with tailored melting and crystallization properties, are opening new avenues for growth. These include applications in confectionery, bakery, and dairy alternatives.
Consumer behavior shifts are profoundly impacting the market. There's a discernible trend towards healthier oil choices, with consumers actively seeking oils rich in monounsaturated and polyunsaturated fats, such as canola, sunflower, and olive oils, while reducing intake of saturated and trans fats. The "clean label" movement also influences purchasing decisions, with a preference for minimally processed oils and those free from artificial additives. Furthermore, the increasing popularity of plant-based diets has amplified the demand for vegetable-based cooking oils and fats, creating opportunities for innovation in this segment. The market penetration of specialty fats for specific food applications, like confectionery coatings and dairy replacers, is also on the rise, indicating a maturation of demand beyond basic cooking applications. The estimated market value for the base year 2025 stands at approximately USD 190,000 million, with an anticipated Compound Annual Growth Rate (CAGR) of 4.5% projected from 2025 to 2033. This growth is underpinned by a growing global appetite for processed foods and convenience, where fats and oils are indispensable ingredients. The persistent demand from the food service sector, coupled with expanding retail availability, further solidifies the growth outlook.
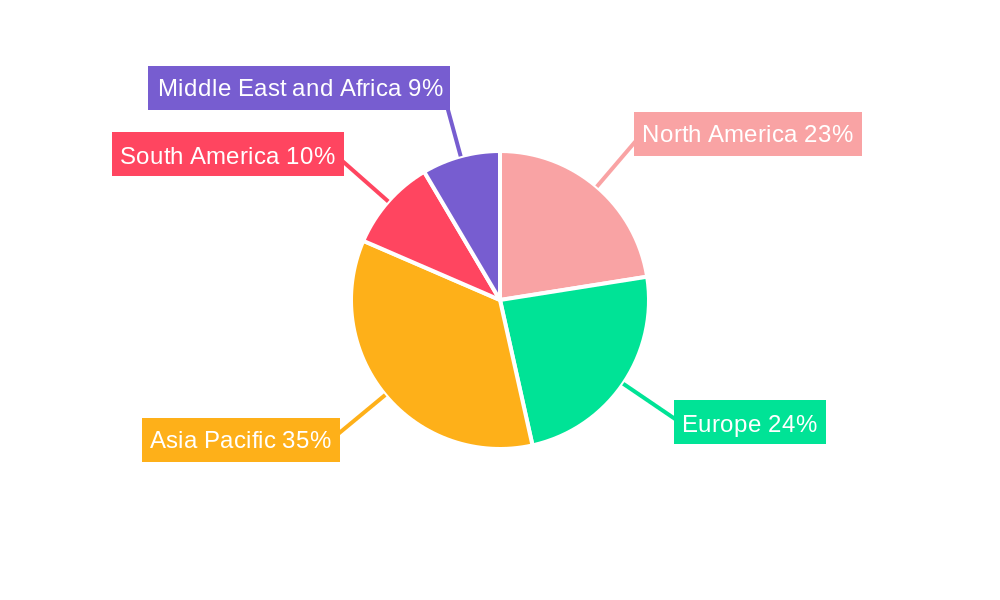
Dominant Regions, Countries, or Segments in Cooking Oils and Fats Industry
The Asia Pacific region stands as a dominant force in the global cooking oils and fats industry, exhibiting significant influence across production, consumption, import, and export markets. This regional dominance is propelled by a confluence of factors including a vast population, deeply ingrained culinary traditions that heavily rely on various cooking oils, and a rapidly growing middle class with increasing disposable incomes.
Production Analysis: Asia Pacific, particularly countries like Indonesia and Malaysia, leads in the production of edible oils, especially palm oil. The region's favorable climate and extensive agricultural land contribute to high output volumes. Production volumes are estimated to reach approximately 120,000 million units by 2025.
Consumption Analysis: The sheer population size of countries like China and India drives unparalleled consumption volumes. Staple cooking oils such as soybean oil, palm oil, and rapeseed oil are consumed in massive quantities for daily culinary needs and as ingredients in processed foods. Consumption is projected to hit around 115,000 million units by 2025.
Import Market Analysis (Value & Volume): While being a major producer, the region also experiences substantial import volumes of specialty oils and fats to cater to diverse food processing needs and evolving consumer preferences. The import market value is anticipated to reach USD 25,000 million by 2025, with volumes in the range of 15,000 million units.
Export Market Analysis (Value & Volume): Asia Pacific is a significant exporter of edible oils and fats, with processed palm oil products and refined vegetable oils being key export commodities. Export value is expected to be around USD 30,000 million, with volumes reaching 18,000 million units by 2025.
Price Trend Analysis: The price of cooking oils and fats in this region is largely influenced by global commodity prices, government policies related to agricultural support, and the supply-demand dynamics of key oils like palm and soybean. Regional price volatility can also be impacted by weather patterns and trade agreements.
Key Drivers of Dominance:
- Population Size: Largest consumer base in the world.
- Culinary Heritage: Extensive use of oils in traditional cuisines.
- Agricultural Output: Significant production of key oilseeds and fruits.
- Economic Growth: Rising disposable incomes driving demand for processed foods and premium oils.
- Infrastructure Development: Improving logistics and processing capabilities.
Cooking Oils and Fats Industry Product Landscape
The product landscape of the cooking oils and fats industry is dynamic, driven by innovation in processing and a growing demand for specialized applications. Beyond traditional cooking oils like soybean, canola, and olive oil, there's a burgeoning market for functional oils enriched with omega-3 fatty acids and antioxidants. Specialty fats, such as cocoa butter equivalents (CBEs) and palm kernel oil derivatives, are crucial for the confectionery and bakery sectors, offering tailored melting points and textures. Performance metrics like smoke point, fatty acid profile, and oxidative stability are key differentiators for industrial applications. Technological advancements in fractionation and interesterification allow for the creation of fats with specific functionalities, leading to unique selling propositions such as improved mouthfeel in dairy alternatives or extended shelf life in baked goods.
Key Drivers, Barriers & Challenges in Cooking Oils and Fats Industry
The cooking oils and fats industry is propelled by several key drivers. A primary force is the growing global population and the increasing demand for food products, which necessitates higher production volumes of edible oils. Rising health consciousness among consumers globally is also a significant driver, leading to increased demand for healthier oil options such as olive oil, avocado oil, and those fortified with omega-3 fatty acids. The expansion of the processed food industry is another crucial driver, as fats and oils are indispensable ingredients in a wide range of food products, from baked goods to snacks and ready-to-eat meals. Furthermore, technological advancements in extraction and refining processes contribute to improved product quality and efficiency, driving market growth.
However, the industry faces several barriers and challenges. Volatility in raw material prices, driven by factors like weather conditions, geopolitical events, and agricultural policies, poses a significant challenge to price stability and profitability. Supply chain disruptions, as highlighted by recent global events, can impact the availability and cost of raw materials and finished products. Stringent regulatory frameworks related to food safety, labeling, and environmental sustainability (particularly for palm oil) can increase operational costs and necessitate significant compliance efforts. Intense competition from both established players and emerging brands, along with the availability of diverse product substitutes, creates pricing pressures and demands continuous innovation. For example, the increasing popularity of plant-based alternatives is reshaping demand patterns and requiring adaptation from traditional oil producers.
Emerging Opportunities in Cooking Oils and Fats Industry
Emerging opportunities within the cooking oils and fats industry are largely centered around health-conscious product development and sustainable sourcing. The escalating demand for plant-based diets is creating significant opportunities for specialized vegetable oils and fats that mimic the functional properties of animal fats, particularly in the confectionery and dairy alternative sectors. Innovations in high-oleic oils, offering enhanced oxidative stability and longer shelf life, are gaining traction for both industrial and household consumption. Furthermore, the growing consumer focus on traceability and sustainability presents a lucrative avenue for companies that can demonstrate ethical sourcing and environmentally friendly production practices, such as certifications for sustainable palm oil (RSPO) or organic oils. Untapped markets in developing economies, where urbanization and changing dietary habits are driving demand for packaged foods and diverse cooking ingredients, also represent substantial growth potential.
Growth Accelerators in the Cooking Oils and Fats Industry Industry
Several catalysts are accelerating long-term growth in the cooking oils and fats industry. Technological breakthroughs in genetic modification of oilseed crops to enhance yields and nutritional content are a significant factor. Strategic partnerships and mergers, such as joint ventures for market expansion or acquisitions of specialized processing units, are crucial for expanding product portfolios and geographical reach. For instance, collaborations to develop and commercialize novel plant-based fats for specific food applications are gaining momentum. Market expansion strategies, including penetration into emerging economies with growing food processing sectors and increasing consumer spending power, are vital growth accelerators. The development of functional oils with added health benefits, supported by scientific research and consumer awareness campaigns, also acts as a powerful growth catalyst.
Key Players Shaping the Cooking Oils and Fats Industry Market
- Arista Industries
- Wilmar International Limited
- Cargill Incorporated
- The Archer Daniels Midland Company
- Bunge Limited
- Kuala Lumpur Kepong Berhad
- Olam International
- Alami Commodities Sdn Bhd
- Fuji Oil Holding Inc
- Musim Mas Group
Notable Milestones in Cooking Oils and Fats Industry Sector
- May 2021: ADM invested about USD 350 million to build a soybean crushing facility in North Dakota, United States. The plant is expected to finish and start processing by 2023. The plant functionaries include soy crushing, oil refining, and processing of soy-related products.
- November 2021: Cargill invested about USD 35 million to expand the Malaysian vegetable oil production facility. The facility features dry palm fractionation capacity, enabling the production of specialty fats for chocolates, coatings, and spreads.
- December 2021: Fuji Oil launched a joint venture with one of its subsidiaries, Fuji Specialities Inc., and ITOCHU International Inc., forming FII. The prime reason behind this collaboration is to expand the vegetable oil business in North America. The joint venture shares the raw material, manufacturing, and sales of fats and oils across North America.
In-Depth Cooking Oils and Fats Industry Market Outlook
The outlook for the cooking oils and fats industry is exceptionally bright, driven by sustained global demand for food ingredients and a dynamic shift towards healthier, more sustainable options. Growth accelerators will continue to be fueled by ongoing innovations in food technology, particularly in creating specialty fats that cater to the burgeoning plant-based food sector and provide improved functionality in bakery and confectionery applications. Strategic alliances and market expansion into rapidly developing economies will further solidify the industry's growth trajectory. The focus on traceable and ethically sourced ingredients will also drive investments in sustainable agricultural practices and processing technologies. This evolving landscape promises significant opportunities for companies that can adapt to consumer preferences and leverage technological advancements to deliver innovative and high-quality edible oils and fats, ensuring continued market expansion and profitability.
Cooking Oils and Fats Industry Segmentation
- 1. Production Analysis
- 2. Consumption Analysis
- 3. Import Market Analysis (Value & Volume)
- 4. Export Market Analysis (Value & Volume)
- 5. Price Trend Analysis
Cooking Oils and Fats Industry Segmentation By Geography
-
1. North America
- 1.1. United States
- 1.2. Canada
- 1.3. Mexico
- 1.4. Rest of North America
-
2. Europe
- 2.1. Germany
- 2.2. United Kingdom
- 2.3. France
- 2.4. Russia
- 2.5. Italy
- 2.6. Rest of Europe
-
3. Asia Pacific
- 3.1. China
- 3.2. Japan
- 3.3. India
- 3.4. Australia
- 3.5. Rest of Asia Pacific
-
4. South America
- 4.1. Brazil
- 4.2. Argentina
- 4.3. Rest of South America
-
5. Middle East and Africa
- 5.1. South Africa
- 5.2. Saudi Arabia
- 5.3. Rest of Middle East and Africa
Cooking Oils and Fats Industry Regional Market Share
Geographic Coverage of Cooking Oils and Fats Industry
Cooking Oils and Fats Industry REPORT HIGHLIGHTS
| Aspects | Details |
|---|---|
| Study Period | 2020-2034 |
| Base Year | 2025 |
| Estimated Year | 2026 |
| Forecast Period | 2026-2034 |
| Historical Period | 2020-2025 |
| Growth Rate | CAGR of 6.47% from 2020-2034 |
| Segmentation |
|
Table of Contents
- 1. Introduction
- 1.1. Research Scope
- 1.2. Market Segmentation
- 1.3. Research Methodology
- 1.4. Definitions and Assumptions
- 2. Executive Summary
- 2.1. Introduction
- 3. Market Dynamics
- 3.1. Introduction
- 3.2. Market Drivers
- 3.2.1. Increasing Demand for Low-Fat and Low-Calorie Food; Increasing Product Innovation
- 3.3. Market Restrains
- 3.3.1. ; Threat of New Entrants; Bargaining Power of Buyers/Consumers; Bargaining Power of Suppliers; Threat of Substitute Products; Degree Of Competition
- 3.4. Market Trends
- 3.4.1. Increasing Demand for Vegetable Oil in Energy and Cosmetic Industry
- 4. Market Factor Analysis
- 4.1. Porters Five Forces
- 4.2. Supply/Value Chain
- 4.3. PESTEL analysis
- 4.4. Market Entropy
- 4.5. Patent/Trademark Analysis
- 5. Global Cooking Oils and Fats Industry Analysis, Insights and Forecast, 2020-2032
- 5.1. Market Analysis, Insights and Forecast - by Production Analysis
- 5.2. Market Analysis, Insights and Forecast - by Consumption Analysis
- 5.3. Market Analysis, Insights and Forecast - by Import Market Analysis (Value & Volume)
- 5.4. Market Analysis, Insights and Forecast - by Export Market Analysis (Value & Volume)
- 5.5. Market Analysis, Insights and Forecast - by Price Trend Analysis
- 5.6. Market Analysis, Insights and Forecast - by Region
- 5.6.1. North America
- 5.6.2. Europe
- 5.6.3. Asia Pacific
- 5.6.4. South America
- 5.6.5. Middle East and Africa
- 5.1. Market Analysis, Insights and Forecast - by Production Analysis
- 6. North America Cooking Oils and Fats Industry Analysis, Insights and Forecast, 2020-2032
- 6.1. Market Analysis, Insights and Forecast - by Production Analysis
- 6.2. Market Analysis, Insights and Forecast - by Consumption Analysis
- 6.3. Market Analysis, Insights and Forecast - by Import Market Analysis (Value & Volume)
- 6.4. Market Analysis, Insights and Forecast - by Export Market Analysis (Value & Volume)
- 6.5. Market Analysis, Insights and Forecast - by Price Trend Analysis
- 6.1. Market Analysis, Insights and Forecast - by Production Analysis
- 7. Europe Cooking Oils and Fats Industry Analysis, Insights and Forecast, 2020-2032
- 7.1. Market Analysis, Insights and Forecast - by Production Analysis
- 7.2. Market Analysis, Insights and Forecast - by Consumption Analysis
- 7.3. Market Analysis, Insights and Forecast - by Import Market Analysis (Value & Volume)
- 7.4. Market Analysis, Insights and Forecast - by Export Market Analysis (Value & Volume)
- 7.5. Market Analysis, Insights and Forecast - by Price Trend Analysis
- 7.1. Market Analysis, Insights and Forecast - by Production Analysis
- 8. Asia Pacific Cooking Oils and Fats Industry Analysis, Insights and Forecast, 2020-2032
- 8.1. Market Analysis, Insights and Forecast - by Production Analysis
- 8.2. Market Analysis, Insights and Forecast - by Consumption Analysis
- 8.3. Market Analysis, Insights and Forecast - by Import Market Analysis (Value & Volume)
- 8.4. Market Analysis, Insights and Forecast - by Export Market Analysis (Value & Volume)
- 8.5. Market Analysis, Insights and Forecast - by Price Trend Analysis
- 8.1. Market Analysis, Insights and Forecast - by Production Analysis
- 9. South America Cooking Oils and Fats Industry Analysis, Insights and Forecast, 2020-2032
- 9.1. Market Analysis, Insights and Forecast - by Production Analysis
- 9.2. Market Analysis, Insights and Forecast - by Consumption Analysis
- 9.3. Market Analysis, Insights and Forecast - by Import Market Analysis (Value & Volume)
- 9.4. Market Analysis, Insights and Forecast - by Export Market Analysis (Value & Volume)
- 9.5. Market Analysis, Insights and Forecast - by Price Trend Analysis
- 9.1. Market Analysis, Insights and Forecast - by Production Analysis
- 10. Middle East and Africa Cooking Oils and Fats Industry Analysis, Insights and Forecast, 2020-2032
- 10.1. Market Analysis, Insights and Forecast - by Production Analysis
- 10.2. Market Analysis, Insights and Forecast - by Consumption Analysis
- 10.3. Market Analysis, Insights and Forecast - by Import Market Analysis (Value & Volume)
- 10.4. Market Analysis, Insights and Forecast - by Export Market Analysis (Value & Volume)
- 10.5. Market Analysis, Insights and Forecast - by Price Trend Analysis
- 10.1. Market Analysis, Insights and Forecast - by Production Analysis
- 11. Competitive Analysis
- 11.1. Global Market Share Analysis 2025
- 11.2. Company Profiles
- 11.2.1 Arista Industries*List Not Exhaustive
- 11.2.1.1. Overview
- 11.2.1.2. Products
- 11.2.1.3. SWOT Analysis
- 11.2.1.4. Recent Developments
- 11.2.1.5. Financials (Based on Availability)
- 11.2.2 Wilmar International Limited
- 11.2.2.1. Overview
- 11.2.2.2. Products
- 11.2.2.3. SWOT Analysis
- 11.2.2.4. Recent Developments
- 11.2.2.5. Financials (Based on Availability)
- 11.2.3 Cargill Incorporated
- 11.2.3.1. Overview
- 11.2.3.2. Products
- 11.2.3.3. SWOT Analysis
- 11.2.3.4. Recent Developments
- 11.2.3.5. Financials (Based on Availability)
- 11.2.4 The Archer Daniels Midland Company
- 11.2.4.1. Overview
- 11.2.4.2. Products
- 11.2.4.3. SWOT Analysis
- 11.2.4.4. Recent Developments
- 11.2.4.5. Financials (Based on Availability)
- 11.2.5 Bunge Limited
- 11.2.5.1. Overview
- 11.2.5.2. Products
- 11.2.5.3. SWOT Analysis
- 11.2.5.4. Recent Developments
- 11.2.5.5. Financials (Based on Availability)
- 11.2.6 Kuala Lumpur Kepong Berhad
- 11.2.6.1. Overview
- 11.2.6.2. Products
- 11.2.6.3. SWOT Analysis
- 11.2.6.4. Recent Developments
- 11.2.6.5. Financials (Based on Availability)
- 11.2.7 Olam International
- 11.2.7.1. Overview
- 11.2.7.2. Products
- 11.2.7.3. SWOT Analysis
- 11.2.7.4. Recent Developments
- 11.2.7.5. Financials (Based on Availability)
- 11.2.8 Alami Commodities Sdn Bhd
- 11.2.8.1. Overview
- 11.2.8.2. Products
- 11.2.8.3. SWOT Analysis
- 11.2.8.4. Recent Developments
- 11.2.8.5. Financials (Based on Availability)
- 11.2.9 Fuji Oil Holding Inc
- 11.2.9.1. Overview
- 11.2.9.2. Products
- 11.2.9.3. SWOT Analysis
- 11.2.9.4. Recent Developments
- 11.2.9.5. Financials (Based on Availability)
- 11.2.10 Musim Mas Group
- 11.2.10.1. Overview
- 11.2.10.2. Products
- 11.2.10.3. SWOT Analysis
- 11.2.10.4. Recent Developments
- 11.2.10.5. Financials (Based on Availability)
- 11.2.1 Arista Industries*List Not Exhaustive
List of Figures
- Figure 1: Global Cooking Oils and Fats Industry Revenue Breakdown (billion, %) by Region 2025 & 2033
- Figure 2: North America Cooking Oils and Fats Industry Revenue (billion), by Production Analysis 2025 & 2033
- Figure 3: North America Cooking Oils and Fats Industry Revenue Share (%), by Production Analysis 2025 & 2033
- Figure 4: North America Cooking Oils and Fats Industry Revenue (billion), by Consumption Analysis 2025 & 2033
- Figure 5: North America Cooking Oils and Fats Industry Revenue Share (%), by Consumption Analysis 2025 & 2033
- Figure 6: North America Cooking Oils and Fats Industry Revenue (billion), by Import Market Analysis (Value & Volume) 2025 & 2033
- Figure 7: North America Cooking Oils and Fats Industry Revenue Share (%), by Import Market Analysis (Value & Volume) 2025 & 2033
- Figure 8: North America Cooking Oils and Fats Industry Revenue (billion), by Export Market Analysis (Value & Volume) 2025 & 2033
- Figure 9: North America Cooking Oils and Fats Industry Revenue Share (%), by Export Market Analysis (Value & Volume) 2025 & 2033
- Figure 10: North America Cooking Oils and Fats Industry Revenue (billion), by Price Trend Analysis 2025 & 2033
- Figure 11: North America Cooking Oils and Fats Industry Revenue Share (%), by Price Trend Analysis 2025 & 2033
- Figure 12: North America Cooking Oils and Fats Industry Revenue (billion), by Country 2025 & 2033
- Figure 13: North America Cooking Oils and Fats Industry Revenue Share (%), by Country 2025 & 2033
- Figure 14: Europe Cooking Oils and Fats Industry Revenue (billion), by Production Analysis 2025 & 2033
- Figure 15: Europe Cooking Oils and Fats Industry Revenue Share (%), by Production Analysis 2025 & 2033
- Figure 16: Europe Cooking Oils and Fats Industry Revenue (billion), by Consumption Analysis 2025 & 2033
- Figure 17: Europe Cooking Oils and Fats Industry Revenue Share (%), by Consumption Analysis 2025 & 2033
- Figure 18: Europe Cooking Oils and Fats Industry Revenue (billion), by Import Market Analysis (Value & Volume) 2025 & 2033
- Figure 19: Europe Cooking Oils and Fats Industry Revenue Share (%), by Import Market Analysis (Value & Volume) 2025 & 2033
- Figure 20: Europe Cooking Oils and Fats Industry Revenue (billion), by Export Market Analysis (Value & Volume) 2025 & 2033
- Figure 21: Europe Cooking Oils and Fats Industry Revenue Share (%), by Export Market Analysis (Value & Volume) 2025 & 2033
- Figure 22: Europe Cooking Oils and Fats Industry Revenue (billion), by Price Trend Analysis 2025 & 2033
- Figure 23: Europe Cooking Oils and Fats Industry Revenue Share (%), by Price Trend Analysis 2025 & 2033
- Figure 24: Europe Cooking Oils and Fats Industry Revenue (billion), by Country 2025 & 2033
- Figure 25: Europe Cooking Oils and Fats Industry Revenue Share (%), by Country 2025 & 2033
- Figure 26: Asia Pacific Cooking Oils and Fats Industry Revenue (billion), by Production Analysis 2025 & 2033
- Figure 27: Asia Pacific Cooking Oils and Fats Industry Revenue Share (%), by Production Analysis 2025 & 2033
- Figure 28: Asia Pacific Cooking Oils and Fats Industry Revenue (billion), by Consumption Analysis 2025 & 2033
- Figure 29: Asia Pacific Cooking Oils and Fats Industry Revenue Share (%), by Consumption Analysis 2025 & 2033
- Figure 30: Asia Pacific Cooking Oils and Fats Industry Revenue (billion), by Import Market Analysis (Value & Volume) 2025 & 2033
- Figure 31: Asia Pacific Cooking Oils and Fats Industry Revenue Share (%), by Import Market Analysis (Value & Volume) 2025 & 2033
- Figure 32: Asia Pacific Cooking Oils and Fats Industry Revenue (billion), by Export Market Analysis (Value & Volume) 2025 & 2033
- Figure 33: Asia Pacific Cooking Oils and Fats Industry Revenue Share (%), by Export Market Analysis (Value & Volume) 2025 & 2033
- Figure 34: Asia Pacific Cooking Oils and Fats Industry Revenue (billion), by Price Trend Analysis 2025 & 2033
- Figure 35: Asia Pacific Cooking Oils and Fats Industry Revenue Share (%), by Price Trend Analysis 2025 & 2033
- Figure 36: Asia Pacific Cooking Oils and Fats Industry Revenue (billion), by Country 2025 & 2033
- Figure 37: Asia Pacific Cooking Oils and Fats Industry Revenue Share (%), by Country 2025 & 2033
- Figure 38: South America Cooking Oils and Fats Industry Revenue (billion), by Production Analysis 2025 & 2033
- Figure 39: South America Cooking Oils and Fats Industry Revenue Share (%), by Production Analysis 2025 & 2033
- Figure 40: South America Cooking Oils and Fats Industry Revenue (billion), by Consumption Analysis 2025 & 2033
- Figure 41: South America Cooking Oils and Fats Industry Revenue Share (%), by Consumption Analysis 2025 & 2033
- Figure 42: South America Cooking Oils and Fats Industry Revenue (billion), by Import Market Analysis (Value & Volume) 2025 & 2033
- Figure 43: South America Cooking Oils and Fats Industry Revenue Share (%), by Import Market Analysis (Value & Volume) 2025 & 2033
- Figure 44: South America Cooking Oils and Fats Industry Revenue (billion), by Export Market Analysis (Value & Volume) 2025 & 2033
- Figure 45: South America Cooking Oils and Fats Industry Revenue Share (%), by Export Market Analysis (Value & Volume) 2025 & 2033
- Figure 46: South America Cooking Oils and Fats Industry Revenue (billion), by Price Trend Analysis 2025 & 2033
- Figure 47: South America Cooking Oils and Fats Industry Revenue Share (%), by Price Trend Analysis 2025 & 2033
- Figure 48: South America Cooking Oils and Fats Industry Revenue (billion), by Country 2025 & 2033
- Figure 49: South America Cooking Oils and Fats Industry Revenue Share (%), by Country 2025 & 2033
- Figure 50: Middle East and Africa Cooking Oils and Fats Industry Revenue (billion), by Production Analysis 2025 & 2033
- Figure 51: Middle East and Africa Cooking Oils and Fats Industry Revenue Share (%), by Production Analysis 2025 & 2033
- Figure 52: Middle East and Africa Cooking Oils and Fats Industry Revenue (billion), by Consumption Analysis 2025 & 2033
- Figure 53: Middle East and Africa Cooking Oils and Fats Industry Revenue Share (%), by Consumption Analysis 2025 & 2033
- Figure 54: Middle East and Africa Cooking Oils and Fats Industry Revenue (billion), by Import Market Analysis (Value & Volume) 2025 & 2033
- Figure 55: Middle East and Africa Cooking Oils and Fats Industry Revenue Share (%), by Import Market Analysis (Value & Volume) 2025 & 2033
- Figure 56: Middle East and Africa Cooking Oils and Fats Industry Revenue (billion), by Export Market Analysis (Value & Volume) 2025 & 2033
- Figure 57: Middle East and Africa Cooking Oils and Fats Industry Revenue Share (%), by Export Market Analysis (Value & Volume) 2025 & 2033
- Figure 58: Middle East and Africa Cooking Oils and Fats Industry Revenue (billion), by Price Trend Analysis 2025 & 2033
- Figure 59: Middle East and Africa Cooking Oils and Fats Industry Revenue Share (%), by Price Trend Analysis 2025 & 2033
- Figure 60: Middle East and Africa Cooking Oils and Fats Industry Revenue (billion), by Country 2025 & 2033
- Figure 61: Middle East and Africa Cooking Oils and Fats Industry Revenue Share (%), by Country 2025 & 2033
List of Tables
- Table 1: Global Cooking Oils and Fats Industry Revenue billion Forecast, by Production Analysis 2020 & 2033
- Table 2: Global Cooking Oils and Fats Industry Revenue billion Forecast, by Consumption Analysis 2020 & 2033
- Table 3: Global Cooking Oils and Fats Industry Revenue billion Forecast, by Import Market Analysis (Value & Volume) 2020 & 2033
- Table 4: Global Cooking Oils and Fats Industry Revenue billion Forecast, by Export Market Analysis (Value & Volume) 2020 & 2033
- Table 5: Global Cooking Oils and Fats Industry Revenue billion Forecast, by Price Trend Analysis 2020 & 2033
- Table 6: Global Cooking Oils and Fats Industry Revenue billion Forecast, by Region 2020 & 2033
- Table 7: Global Cooking Oils and Fats Industry Revenue billion Forecast, by Production Analysis 2020 & 2033
- Table 8: Global Cooking Oils and Fats Industry Revenue billion Forecast, by Consumption Analysis 2020 & 2033
- Table 9: Global Cooking Oils and Fats Industry Revenue billion Forecast, by Import Market Analysis (Value & Volume) 2020 & 2033
- Table 10: Global Cooking Oils and Fats Industry Revenue billion Forecast, by Export Market Analysis (Value & Volume) 2020 & 2033
- Table 11: Global Cooking Oils and Fats Industry Revenue billion Forecast, by Price Trend Analysis 2020 & 2033
- Table 12: Global Cooking Oils and Fats Industry Revenue billion Forecast, by Country 2020 & 2033
- Table 13: United States Cooking Oils and Fats Industry Revenue (billion) Forecast, by Application 2020 & 2033
- Table 14: Canada Cooking Oils and Fats Industry Revenue (billion) Forecast, by Application 2020 & 2033
- Table 15: Mexico Cooking Oils and Fats Industry Revenue (billion) Forecast, by Application 2020 & 2033
- Table 16: Rest of North America Cooking Oils and Fats Industry Revenue (billion) Forecast, by Application 2020 & 2033
- Table 17: Global Cooking Oils and Fats Industry Revenue billion Forecast, by Production Analysis 2020 & 2033
- Table 18: Global Cooking Oils and Fats Industry Revenue billion Forecast, by Consumption Analysis 2020 & 2033
- Table 19: Global Cooking Oils and Fats Industry Revenue billion Forecast, by Import Market Analysis (Value & Volume) 2020 & 2033
- Table 20: Global Cooking Oils and Fats Industry Revenue billion Forecast, by Export Market Analysis (Value & Volume) 2020 & 2033
- Table 21: Global Cooking Oils and Fats Industry Revenue billion Forecast, by Price Trend Analysis 2020 & 2033
- Table 22: Global Cooking Oils and Fats Industry Revenue billion Forecast, by Country 2020 & 2033
- Table 23: Germany Cooking Oils and Fats Industry Revenue (billion) Forecast, by Application 2020 & 2033
- Table 24: United Kingdom Cooking Oils and Fats Industry Revenue (billion) Forecast, by Application 2020 & 2033
- Table 25: France Cooking Oils and Fats Industry Revenue (billion) Forecast, by Application 2020 & 2033
- Table 26: Russia Cooking Oils and Fats Industry Revenue (billion) Forecast, by Application 2020 & 2033
- Table 27: Italy Cooking Oils and Fats Industry Revenue (billion) Forecast, by Application 2020 & 2033
- Table 28: Rest of Europe Cooking Oils and Fats Industry Revenue (billion) Forecast, by Application 2020 & 2033
- Table 29: Global Cooking Oils and Fats Industry Revenue billion Forecast, by Production Analysis 2020 & 2033
- Table 30: Global Cooking Oils and Fats Industry Revenue billion Forecast, by Consumption Analysis 2020 & 2033
- Table 31: Global Cooking Oils and Fats Industry Revenue billion Forecast, by Import Market Analysis (Value & Volume) 2020 & 2033
- Table 32: Global Cooking Oils and Fats Industry Revenue billion Forecast, by Export Market Analysis (Value & Volume) 2020 & 2033
- Table 33: Global Cooking Oils and Fats Industry Revenue billion Forecast, by Price Trend Analysis 2020 & 2033
- Table 34: Global Cooking Oils and Fats Industry Revenue billion Forecast, by Country 2020 & 2033
- Table 35: China Cooking Oils and Fats Industry Revenue (billion) Forecast, by Application 2020 & 2033
- Table 36: Japan Cooking Oils and Fats Industry Revenue (billion) Forecast, by Application 2020 & 2033
- Table 37: India Cooking Oils and Fats Industry Revenue (billion) Forecast, by Application 2020 & 2033
- Table 38: Australia Cooking Oils and Fats Industry Revenue (billion) Forecast, by Application 2020 & 2033
- Table 39: Rest of Asia Pacific Cooking Oils and Fats Industry Revenue (billion) Forecast, by Application 2020 & 2033
- Table 40: Global Cooking Oils and Fats Industry Revenue billion Forecast, by Production Analysis 2020 & 2033
- Table 41: Global Cooking Oils and Fats Industry Revenue billion Forecast, by Consumption Analysis 2020 & 2033
- Table 42: Global Cooking Oils and Fats Industry Revenue billion Forecast, by Import Market Analysis (Value & Volume) 2020 & 2033
- Table 43: Global Cooking Oils and Fats Industry Revenue billion Forecast, by Export Market Analysis (Value & Volume) 2020 & 2033
- Table 44: Global Cooking Oils and Fats Industry Revenue billion Forecast, by Price Trend Analysis 2020 & 2033
- Table 45: Global Cooking Oils and Fats Industry Revenue billion Forecast, by Country 2020 & 2033
- Table 46: Brazil Cooking Oils and Fats Industry Revenue (billion) Forecast, by Application 2020 & 2033
- Table 47: Argentina Cooking Oils and Fats Industry Revenue (billion) Forecast, by Application 2020 & 2033
- Table 48: Rest of South America Cooking Oils and Fats Industry Revenue (billion) Forecast, by Application 2020 & 2033
- Table 49: Global Cooking Oils and Fats Industry Revenue billion Forecast, by Production Analysis 2020 & 2033
- Table 50: Global Cooking Oils and Fats Industry Revenue billion Forecast, by Consumption Analysis 2020 & 2033
- Table 51: Global Cooking Oils and Fats Industry Revenue billion Forecast, by Import Market Analysis (Value & Volume) 2020 & 2033
- Table 52: Global Cooking Oils and Fats Industry Revenue billion Forecast, by Export Market Analysis (Value & Volume) 2020 & 2033
- Table 53: Global Cooking Oils and Fats Industry Revenue billion Forecast, by Price Trend Analysis 2020 & 2033
- Table 54: Global Cooking Oils and Fats Industry Revenue billion Forecast, by Country 2020 & 2033
- Table 55: South Africa Cooking Oils and Fats Industry Revenue (billion) Forecast, by Application 2020 & 2033
- Table 56: Saudi Arabia Cooking Oils and Fats Industry Revenue (billion) Forecast, by Application 2020 & 2033
- Table 57: Rest of Middle East and Africa Cooking Oils and Fats Industry Revenue (billion) Forecast, by Application 2020 & 2033
Frequently Asked Questions
1. What is the projected Compound Annual Growth Rate (CAGR) of the Cooking Oils and Fats Industry?
The projected CAGR is approximately 6.47%.
2. Which companies are prominent players in the Cooking Oils and Fats Industry?
Key companies in the market include Arista Industries*List Not Exhaustive, Wilmar International Limited, Cargill Incorporated, The Archer Daniels Midland Company, Bunge Limited, Kuala Lumpur Kepong Berhad, Olam International, Alami Commodities Sdn Bhd, Fuji Oil Holding Inc, Musim Mas Group.
3. What are the main segments of the Cooking Oils and Fats Industry?
The market segments include Production Analysis, Consumption Analysis, Import Market Analysis (Value & Volume), Export Market Analysis (Value & Volume), Price Trend Analysis.
4. Can you provide details about the market size?
The market size is estimated to be USD 237.87 billion as of 2022.
5. What are some drivers contributing to market growth?
Increasing Demand for Low-Fat and Low-Calorie Food; Increasing Product Innovation.
6. What are the notable trends driving market growth?
Increasing Demand for Vegetable Oil in Energy and Cosmetic Industry.
7. Are there any restraints impacting market growth?
; Threat of New Entrants; Bargaining Power of Buyers/Consumers; Bargaining Power of Suppliers; Threat of Substitute Products; Degree Of Competition.
8. Can you provide examples of recent developments in the market?
May 2021: ADM invested about USD 350 million to build a soybean crushing facility in North Dakota, United States. The plant is expected to finish and start processing by 2023. The plant functionaries include soy crushing, oil refining, and processing of soy-related products.
9. What pricing options are available for accessing the report?
Pricing options include single-user, multi-user, and enterprise licenses priced at USD 4750, USD 5250, and USD 8750 respectively.
10. Is the market size provided in terms of value or volume?
The market size is provided in terms of value, measured in billion.
11. Are there any specific market keywords associated with the report?
Yes, the market keyword associated with the report is "Cooking Oils and Fats Industry," which aids in identifying and referencing the specific market segment covered.
12. How do I determine which pricing option suits my needs best?
The pricing options vary based on user requirements and access needs. Individual users may opt for single-user licenses, while businesses requiring broader access may choose multi-user or enterprise licenses for cost-effective access to the report.
13. Are there any additional resources or data provided in the Cooking Oils and Fats Industry report?
While the report offers comprehensive insights, it's advisable to review the specific contents or supplementary materials provided to ascertain if additional resources or data are available.
14. How can I stay updated on further developments or reports in the Cooking Oils and Fats Industry?
To stay informed about further developments, trends, and reports in the Cooking Oils and Fats Industry, consider subscribing to industry newsletters, following relevant companies and organizations, or regularly checking reputable industry news sources and publications.
Methodology
Step 1 - Identification of Relevant Samples Size from Population Database


Step 2 - Approaches for Defining Global Market Size (Value, Volume* & Price*)

Note*: In applicable scenarios
Step 3 - Data Sources
Primary Research
- Web Analytics
- Survey Reports
- Research Institute
- Latest Research Reports
- Opinion Leaders
Secondary Research
- Annual Reports
- White Paper
- Latest Press Release
- Industry Association
- Paid Database
- Investor Presentations

Step 4 - Data Triangulation
Involves using different sources of information in order to increase the validity of a study
These sources are likely to be stakeholders in a program - participants, other researchers, program staff, other community members, and so on.
Then we put all data in single framework & apply various statistical tools to find out the dynamic on the market.
During the analysis stage, feedback from the stakeholder groups would be compared to determine areas of agreement as well as areas of divergence