

Key Insights
The global fiberboard barrel market is poised for significant expansion, driven by escalating demand across key industries. Projections indicate a market size of $1.47 billion by 2025, with a Compound Annual Growth Rate (CAGR) of 6.3% throughout the forecast period (2025-2033). This growth trajectory is underpinned by the increasing adoption of sustainable packaging, the demand for lightweight and durable barrels in sectors such as chemicals, food, and pharmaceuticals, and the inherent cost-effectiveness of fiberboard compared to conventional alternatives. Advances in manufacturing technology, enhancing barrel strength, water resistance, and customization, are further stimulating market development.
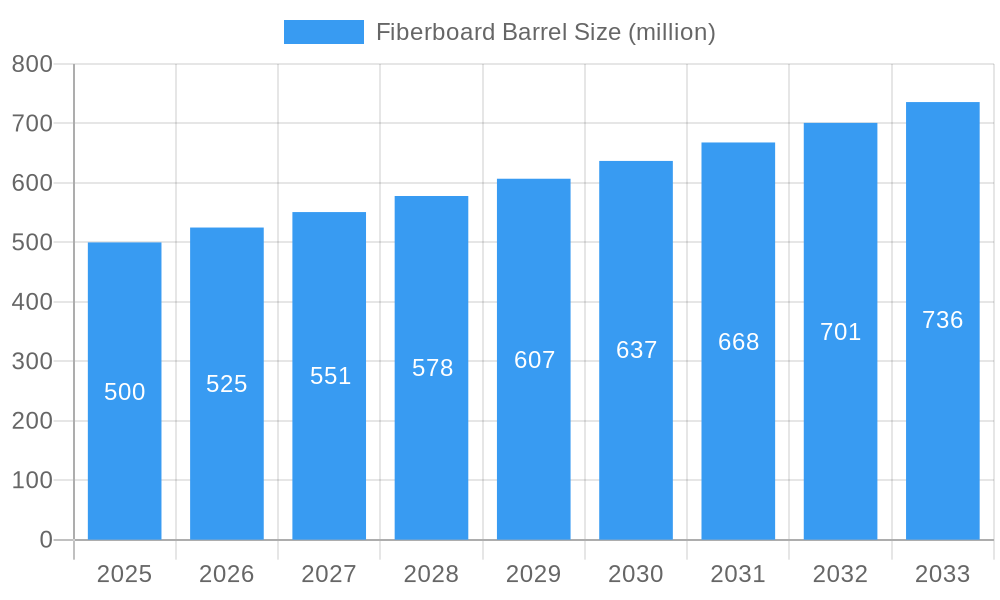
Fiberboard Barrel Market Size (In Billion)
Despite a positive outlook, the market confronts challenges including raw material price volatility, impacting production costs and profitability. Competition from plastic and metal packaging necessitates continuous innovation and value-added services to maintain market share. The market is segmented by barrel size, end-use industry (food & beverage, chemicals, pharmaceuticals), and geographic region. Leading players such as Greif, Mauser Group, and Sonoco Products are actively influencing the market through strategic initiatives. Regions undergoing rapid industrialization and prioritizing eco-friendly packaging are expected to exhibit the most robust growth. The market's future success hinges on sustained innovation, adaptability to evolving sustainability regulations, and effective mitigation of raw material cost fluctuations and competitive pressures.
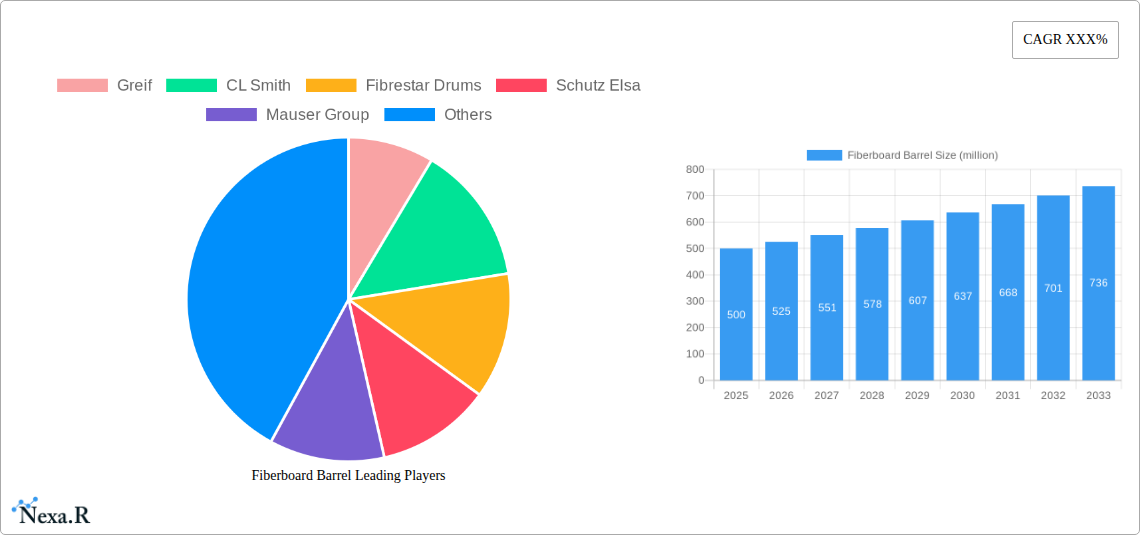
Fiberboard Barrel Company Market Share
Fiberboard Barrel Market Report: 2019-2033
This comprehensive report provides an in-depth analysis of the global fiberboard barrel market, offering invaluable insights for industry professionals, investors, and strategic decision-makers. Covering the period from 2019 to 2033, with a focus on 2025, this report meticulously examines market dynamics, growth trends, key players, and future opportunities within the packaging and container industries (parent market) and specifically the industrial packaging segment (child market).
Fiberboard Barrel Market Dynamics & Structure
The global fiberboard barrel market, valued at xx million units in 2025, exhibits a moderately concentrated structure. Key players such as Greif, Mauser Group, and Sonoco Products hold significant market share, while numerous smaller regional players compete for niche segments. Technological innovation, primarily focused on improved durability, recyclability, and customization options, is a key driver. Regulatory frameworks concerning sustainable packaging and material sourcing are increasingly influencing market dynamics. Competitive substitutes include plastic drums and metal containers, though fiberboard barrels maintain an edge in cost-effectiveness and recyclability for certain applications. M&A activity within the industry has been relatively modest in recent years, with approximately xx deals recorded between 2019 and 2024, primarily focused on consolidating regional players.
- Market Concentration: Moderately concentrated, with top 5 players holding approximately xx% market share in 2025.
- Technological Innovation: Focus on improved strength, water resistance, and eco-friendly materials.
- Regulatory Landscape: Growing emphasis on sustainable packaging influencing material choices and production processes.
- Competitive Substitutes: Plastic and metal containers pose competition, primarily in high-performance applications.
- End-User Demographics: Diverse across industries, including chemicals, food, and industrial goods.
- M&A Trends: Relatively low deal volume (xx deals from 2019-2024), with consolidation being a primary motivator.
Fiberboard Barrel Growth Trends & Insights
The fiberboard barrel market witnessed a CAGR of xx% during the historical period (2019-2024), driven by increasing demand across diverse end-use sectors. Adoption rates have been particularly strong in regions with robust industrial growth and a focus on cost-effective packaging solutions. Technological advancements, such as the development of higher-strength fiberboard and improved coatings, have contributed to market expansion. Shifting consumer preferences towards sustainable and eco-friendly packaging are further fueling demand. The market is expected to maintain a steady growth trajectory throughout the forecast period (2025-2033), with a projected CAGR of xx%, reaching xx million units by 2033. Market penetration is expected to increase significantly in developing economies, while mature markets will experience growth driven by product innovation and sustainability concerns.
Dominant Regions, Countries, or Segments in Fiberboard Barrel
North America currently holds the largest market share, driven by a strong industrial base and high adoption rates in sectors such as chemicals and food processing. However, Asia-Pacific is projected to experience the fastest growth rate throughout the forecast period, fueled by rapid industrialization and expanding manufacturing sectors. Specific countries like China and India are key contributors to this growth, benefiting from favorable economic policies and expanding infrastructure.
North America: High market share due to established industries and high adoption rates.
Asia-Pacific: Fastest growth region, driven by rapid industrialization and expanding manufacturing sectors (China and India as key drivers).
Europe: Stable market growth, influenced by stringent environmental regulations and a focus on sustainability.
Key Drivers: Strong industrial growth, expanding manufacturing sectors, favorable government policies, and increasing demand for sustainable packaging.
Fiberboard Barrel Product Landscape
Fiberboard barrels are manufactured using various grades of fiberboard, with advancements focusing on enhanced durability, water resistance, and customization options. These barrels find applications across a wide range of industries, including chemical, food, and industrial goods packaging. Unique selling propositions include cost-effectiveness, recyclability, and ease of handling. Recent technological advancements include the incorporation of bio-based resins and improved coatings to enhance performance characteristics.
Key Drivers, Barriers & Challenges in Fiberboard Barrel
Key Drivers:
- Growing demand from various end-use industries.
- Increasing preference for sustainable and eco-friendly packaging.
- Cost-effectiveness compared to alternative packaging materials.
- Technological advancements enhancing product performance and durability.
Key Challenges & Restraints:
- Competition from alternative packaging materials like plastic and metal.
- Fluctuations in raw material prices (pulp and paper).
- Transportation and logistics costs.
- Stringent environmental regulations impacting production processes. The estimated impact of these challenges on market growth is xx% reduction in the CAGR over the forecast period.
Emerging Opportunities in Fiberboard Barrel
Emerging opportunities lie in the development of customized fiberboard barrels for niche applications, the exploration of innovative materials to enhance sustainability, and the expansion into untapped markets in developing economies. The increasing focus on e-commerce and the need for efficient packaging solutions present significant growth potential.
Growth Accelerators in the Fiberboard Barrel Industry
Long-term growth will be accelerated by technological breakthroughs in fiberboard production, strategic partnerships between manufacturers and end-users to develop tailored solutions, and market expansion into emerging economies. Investments in research and development focused on improving the sustainability and performance of fiberboard barrels will play a crucial role.
Key Players Shaping the Fiberboard Barrel Market
- Greif
- CL Smith
- Fibrestar Drums
- Schutz Elsa
- Mauser Group
- TPL Plastech
- Industrial Container Services (ICS)
- Fibre Drum Company
- Sonoco Products
- Orlando Drum & Container
- Gaurav Composite Containers
- Lianyungang Longteng Packing Limited Company
- Guangzhou Hongye Packaging Products
- Jining Rencheng Xinhua Packaging Factory
- Yangxin Jindaxiang Packaging Products
- Shenyang Meika Paper Products Packaging
- Shanghai Central Asia Packing
Notable Milestones in Fiberboard Barrel Sector
- 2020: Introduction of a new bio-based resin by Greif, improving barrel sustainability.
- 2022: Mauser Group acquired a smaller regional player, expanding its market reach.
- 2023: Sonoco launched a new line of customizable fiberboard barrels. (Further milestones need to be added based on available data).
In-Depth Fiberboard Barrel Market Outlook
The fiberboard barrel market is poised for continued growth, driven by increasing demand from diverse industries, technological advancements, and a growing focus on sustainable packaging. Strategic opportunities exist for companies that can innovate in materials, manufacturing processes, and supply chain management to meet the evolving needs of customers. The market's long-term outlook remains positive, with significant potential for expansion in both mature and developing economies.
Fiberboard Barrel Segmentation
-
1. Application
- 1.1. Chemical Industry
- 1.2. Medical
- 1.3. Others
-
2. Type
- 2.1. Level One
- 2.2. Level Two
- 2.3. Level Three
Fiberboard Barrel Segmentation By Geography
-
1. North America
- 1.1. United States
- 1.2. Canada
- 1.3. Mexico
-
2. South America
- 2.1. Brazil
- 2.2. Argentina
- 2.3. Rest of South America
-
3. Europe
- 3.1. United Kingdom
- 3.2. Germany
- 3.3. France
- 3.4. Italy
- 3.5. Spain
- 3.6. Russia
- 3.7. Benelux
- 3.8. Nordics
- 3.9. Rest of Europe
-
4. Middle East & Africa
- 4.1. Turkey
- 4.2. Israel
- 4.3. GCC
- 4.4. North Africa
- 4.5. South Africa
- 4.6. Rest of Middle East & Africa
-
5. Asia Pacific
- 5.1. China
- 5.2. India
- 5.3. Japan
- 5.4. South Korea
- 5.5. ASEAN
- 5.6. Oceania
- 5.7. Rest of Asia Pacific
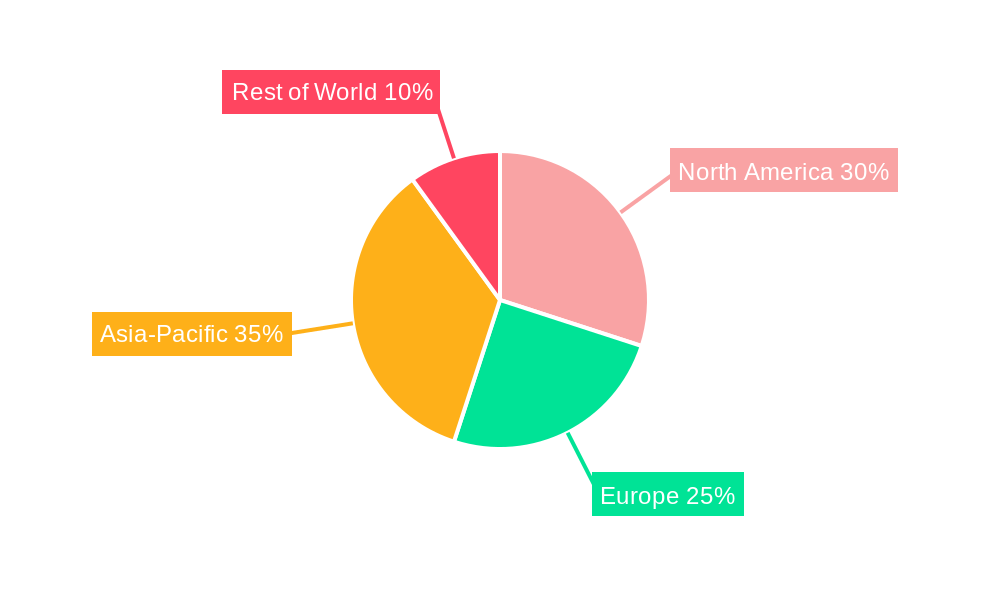
Fiberboard Barrel Regional Market Share
Geographic Coverage of Fiberboard Barrel
Fiberboard Barrel REPORT HIGHLIGHTS
| Aspects | Details |
|---|---|
| Study Period | 2020-2034 |
| Base Year | 2025 |
| Estimated Year | 2026 |
| Forecast Period | 2026-2034 |
| Historical Period | 2020-2025 |
| Growth Rate | CAGR of 6.3% from 2020-2034 |
| Segmentation |
|
Table of Contents
- 1. Introduction
- 1.1. Research Scope
- 1.2. Market Segmentation
- 1.3. Research Methodology
- 1.4. Definitions and Assumptions
- 2. Executive Summary
- 2.1. Introduction
- 3. Market Dynamics
- 3.1. Introduction
- 3.2. Market Drivers
- 3.3. Market Restrains
- 3.4. Market Trends
- 4. Market Factor Analysis
- 4.1. Porters Five Forces
- 4.2. Supply/Value Chain
- 4.3. PESTEL analysis
- 4.4. Market Entropy
- 4.5. Patent/Trademark Analysis
- 5. Global Fiberboard Barrel Analysis, Insights and Forecast, 2020-2032
- 5.1. Market Analysis, Insights and Forecast - by Application
- 5.1.1. Chemical Industry
- 5.1.2. Medical
- 5.1.3. Others
- 5.2. Market Analysis, Insights and Forecast - by Type
- 5.2.1. Level One
- 5.2.2. Level Two
- 5.2.3. Level Three
- 5.3. Market Analysis, Insights and Forecast - by Region
- 5.3.1. North America
- 5.3.2. South America
- 5.3.3. Europe
- 5.3.4. Middle East & Africa
- 5.3.5. Asia Pacific
- 5.1. Market Analysis, Insights and Forecast - by Application
- 6. North America Fiberboard Barrel Analysis, Insights and Forecast, 2020-2032
- 6.1. Market Analysis, Insights and Forecast - by Application
- 6.1.1. Chemical Industry
- 6.1.2. Medical
- 6.1.3. Others
- 6.2. Market Analysis, Insights and Forecast - by Type
- 6.2.1. Level One
- 6.2.2. Level Two
- 6.2.3. Level Three
- 6.1. Market Analysis, Insights and Forecast - by Application
- 7. South America Fiberboard Barrel Analysis, Insights and Forecast, 2020-2032
- 7.1. Market Analysis, Insights and Forecast - by Application
- 7.1.1. Chemical Industry
- 7.1.2. Medical
- 7.1.3. Others
- 7.2. Market Analysis, Insights and Forecast - by Type
- 7.2.1. Level One
- 7.2.2. Level Two
- 7.2.3. Level Three
- 7.1. Market Analysis, Insights and Forecast - by Application
- 8. Europe Fiberboard Barrel Analysis, Insights and Forecast, 2020-2032
- 8.1. Market Analysis, Insights and Forecast - by Application
- 8.1.1. Chemical Industry
- 8.1.2. Medical
- 8.1.3. Others
- 8.2. Market Analysis, Insights and Forecast - by Type
- 8.2.1. Level One
- 8.2.2. Level Two
- 8.2.3. Level Three
- 8.1. Market Analysis, Insights and Forecast - by Application
- 9. Middle East & Africa Fiberboard Barrel Analysis, Insights and Forecast, 2020-2032
- 9.1. Market Analysis, Insights and Forecast - by Application
- 9.1.1. Chemical Industry
- 9.1.2. Medical
- 9.1.3. Others
- 9.2. Market Analysis, Insights and Forecast - by Type
- 9.2.1. Level One
- 9.2.2. Level Two
- 9.2.3. Level Three
- 9.1. Market Analysis, Insights and Forecast - by Application
- 10. Asia Pacific Fiberboard Barrel Analysis, Insights and Forecast, 2020-2032
- 10.1. Market Analysis, Insights and Forecast - by Application
- 10.1.1. Chemical Industry
- 10.1.2. Medical
- 10.1.3. Others
- 10.2. Market Analysis, Insights and Forecast - by Type
- 10.2.1. Level One
- 10.2.2. Level Two
- 10.2.3. Level Three
- 10.1. Market Analysis, Insights and Forecast - by Application
- 11. Competitive Analysis
- 11.1. Global Market Share Analysis 2025
- 11.2. Company Profiles
- 11.2.1 Greif
- 11.2.1.1. Overview
- 11.2.1.2. Products
- 11.2.1.3. SWOT Analysis
- 11.2.1.4. Recent Developments
- 11.2.1.5. Financials (Based on Availability)
- 11.2.2 CL Smith
- 11.2.2.1. Overview
- 11.2.2.2. Products
- 11.2.2.3. SWOT Analysis
- 11.2.2.4. Recent Developments
- 11.2.2.5. Financials (Based on Availability)
- 11.2.3 Fibrestar Drums
- 11.2.3.1. Overview
- 11.2.3.2. Products
- 11.2.3.3. SWOT Analysis
- 11.2.3.4. Recent Developments
- 11.2.3.5. Financials (Based on Availability)
- 11.2.4 Schutz Elsa
- 11.2.4.1. Overview
- 11.2.4.2. Products
- 11.2.4.3. SWOT Analysis
- 11.2.4.4. Recent Developments
- 11.2.4.5. Financials (Based on Availability)
- 11.2.5 Mauser Group
- 11.2.5.1. Overview
- 11.2.5.2. Products
- 11.2.5.3. SWOT Analysis
- 11.2.5.4. Recent Developments
- 11.2.5.5. Financials (Based on Availability)
- 11.2.6 TPL Plastech
- 11.2.6.1. Overview
- 11.2.6.2. Products
- 11.2.6.3. SWOT Analysis
- 11.2.6.4. Recent Developments
- 11.2.6.5. Financials (Based on Availability)
- 11.2.7 Industrial Container Services (ICS)
- 11.2.7.1. Overview
- 11.2.7.2. Products
- 11.2.7.3. SWOT Analysis
- 11.2.7.4. Recent Developments
- 11.2.7.5. Financials (Based on Availability)
- 11.2.8 Fibre Drum Company
- 11.2.8.1. Overview
- 11.2.8.2. Products
- 11.2.8.3. SWOT Analysis
- 11.2.8.4. Recent Developments
- 11.2.8.5. Financials (Based on Availability)
- 11.2.9 Sonoco Product
- 11.2.9.1. Overview
- 11.2.9.2. Products
- 11.2.9.3. SWOT Analysis
- 11.2.9.4. Recent Developments
- 11.2.9.5. Financials (Based on Availability)
- 11.2.10 Orlando Drum & Container
- 11.2.10.1. Overview
- 11.2.10.2. Products
- 11.2.10.3. SWOT Analysis
- 11.2.10.4. Recent Developments
- 11.2.10.5. Financials (Based on Availability)
- 11.2.11 Gaurav Composite Containers
- 11.2.11.1. Overview
- 11.2.11.2. Products
- 11.2.11.3. SWOT Analysis
- 11.2.11.4. Recent Developments
- 11.2.11.5. Financials (Based on Availability)
- 11.2.12 Lianyungang Longteng Pccking Limited Company
- 11.2.12.1. Overview
- 11.2.12.2. Products
- 11.2.12.3. SWOT Analysis
- 11.2.12.4. Recent Developments
- 11.2.12.5. Financials (Based on Availability)
- 11.2.13 Guangzhou Hongye Packaging Products
- 11.2.13.1. Overview
- 11.2.13.2. Products
- 11.2.13.3. SWOT Analysis
- 11.2.13.4. Recent Developments
- 11.2.13.5. Financials (Based on Availability)
- 11.2.14 Jining Rencheng Xinhua Packaging Factory
- 11.2.14.1. Overview
- 11.2.14.2. Products
- 11.2.14.3. SWOT Analysis
- 11.2.14.4. Recent Developments
- 11.2.14.5. Financials (Based on Availability)
- 11.2.15 Yangxin Jindaxiang Packaging Products
- 11.2.15.1. Overview
- 11.2.15.2. Products
- 11.2.15.3. SWOT Analysis
- 11.2.15.4. Recent Developments
- 11.2.15.5. Financials (Based on Availability)
- 11.2.16 Shenyang Meika Paper Products Packaging
- 11.2.16.1. Overview
- 11.2.16.2. Products
- 11.2.16.3. SWOT Analysis
- 11.2.16.4. Recent Developments
- 11.2.16.5. Financials (Based on Availability)
- 11.2.17 Shanghai Central Asia Packing
- 11.2.17.1. Overview
- 11.2.17.2. Products
- 11.2.17.3. SWOT Analysis
- 11.2.17.4. Recent Developments
- 11.2.17.5. Financials (Based on Availability)
- 11.2.1 Greif
List of Figures
- Figure 1: Global Fiberboard Barrel Revenue Breakdown (billion, %) by Region 2025 & 2033
- Figure 2: Global Fiberboard Barrel Volume Breakdown (K, %) by Region 2025 & 2033
- Figure 3: North America Fiberboard Barrel Revenue (billion), by Application 2025 & 2033
- Figure 4: North America Fiberboard Barrel Volume (K), by Application 2025 & 2033
- Figure 5: North America Fiberboard Barrel Revenue Share (%), by Application 2025 & 2033
- Figure 6: North America Fiberboard Barrel Volume Share (%), by Application 2025 & 2033
- Figure 7: North America Fiberboard Barrel Revenue (billion), by Type 2025 & 2033
- Figure 8: North America Fiberboard Barrel Volume (K), by Type 2025 & 2033
- Figure 9: North America Fiberboard Barrel Revenue Share (%), by Type 2025 & 2033
- Figure 10: North America Fiberboard Barrel Volume Share (%), by Type 2025 & 2033
- Figure 11: North America Fiberboard Barrel Revenue (billion), by Country 2025 & 2033
- Figure 12: North America Fiberboard Barrel Volume (K), by Country 2025 & 2033
- Figure 13: North America Fiberboard Barrel Revenue Share (%), by Country 2025 & 2033
- Figure 14: North America Fiberboard Barrel Volume Share (%), by Country 2025 & 2033
- Figure 15: South America Fiberboard Barrel Revenue (billion), by Application 2025 & 2033
- Figure 16: South America Fiberboard Barrel Volume (K), by Application 2025 & 2033
- Figure 17: South America Fiberboard Barrel Revenue Share (%), by Application 2025 & 2033
- Figure 18: South America Fiberboard Barrel Volume Share (%), by Application 2025 & 2033
- Figure 19: South America Fiberboard Barrel Revenue (billion), by Type 2025 & 2033
- Figure 20: South America Fiberboard Barrel Volume (K), by Type 2025 & 2033
- Figure 21: South America Fiberboard Barrel Revenue Share (%), by Type 2025 & 2033
- Figure 22: South America Fiberboard Barrel Volume Share (%), by Type 2025 & 2033
- Figure 23: South America Fiberboard Barrel Revenue (billion), by Country 2025 & 2033
- Figure 24: South America Fiberboard Barrel Volume (K), by Country 2025 & 2033
- Figure 25: South America Fiberboard Barrel Revenue Share (%), by Country 2025 & 2033
- Figure 26: South America Fiberboard Barrel Volume Share (%), by Country 2025 & 2033
- Figure 27: Europe Fiberboard Barrel Revenue (billion), by Application 2025 & 2033
- Figure 28: Europe Fiberboard Barrel Volume (K), by Application 2025 & 2033
- Figure 29: Europe Fiberboard Barrel Revenue Share (%), by Application 2025 & 2033
- Figure 30: Europe Fiberboard Barrel Volume Share (%), by Application 2025 & 2033
- Figure 31: Europe Fiberboard Barrel Revenue (billion), by Type 2025 & 2033
- Figure 32: Europe Fiberboard Barrel Volume (K), by Type 2025 & 2033
- Figure 33: Europe Fiberboard Barrel Revenue Share (%), by Type 2025 & 2033
- Figure 34: Europe Fiberboard Barrel Volume Share (%), by Type 2025 & 2033
- Figure 35: Europe Fiberboard Barrel Revenue (billion), by Country 2025 & 2033
- Figure 36: Europe Fiberboard Barrel Volume (K), by Country 2025 & 2033
- Figure 37: Europe Fiberboard Barrel Revenue Share (%), by Country 2025 & 2033
- Figure 38: Europe Fiberboard Barrel Volume Share (%), by Country 2025 & 2033
- Figure 39: Middle East & Africa Fiberboard Barrel Revenue (billion), by Application 2025 & 2033
- Figure 40: Middle East & Africa Fiberboard Barrel Volume (K), by Application 2025 & 2033
- Figure 41: Middle East & Africa Fiberboard Barrel Revenue Share (%), by Application 2025 & 2033
- Figure 42: Middle East & Africa Fiberboard Barrel Volume Share (%), by Application 2025 & 2033
- Figure 43: Middle East & Africa Fiberboard Barrel Revenue (billion), by Type 2025 & 2033
- Figure 44: Middle East & Africa Fiberboard Barrel Volume (K), by Type 2025 & 2033
- Figure 45: Middle East & Africa Fiberboard Barrel Revenue Share (%), by Type 2025 & 2033
- Figure 46: Middle East & Africa Fiberboard Barrel Volume Share (%), by Type 2025 & 2033
- Figure 47: Middle East & Africa Fiberboard Barrel Revenue (billion), by Country 2025 & 2033
- Figure 48: Middle East & Africa Fiberboard Barrel Volume (K), by Country 2025 & 2033
- Figure 49: Middle East & Africa Fiberboard Barrel Revenue Share (%), by Country 2025 & 2033
- Figure 50: Middle East & Africa Fiberboard Barrel Volume Share (%), by Country 2025 & 2033
- Figure 51: Asia Pacific Fiberboard Barrel Revenue (billion), by Application 2025 & 2033
- Figure 52: Asia Pacific Fiberboard Barrel Volume (K), by Application 2025 & 2033
- Figure 53: Asia Pacific Fiberboard Barrel Revenue Share (%), by Application 2025 & 2033
- Figure 54: Asia Pacific Fiberboard Barrel Volume Share (%), by Application 2025 & 2033
- Figure 55: Asia Pacific Fiberboard Barrel Revenue (billion), by Type 2025 & 2033
- Figure 56: Asia Pacific Fiberboard Barrel Volume (K), by Type 2025 & 2033
- Figure 57: Asia Pacific Fiberboard Barrel Revenue Share (%), by Type 2025 & 2033
- Figure 58: Asia Pacific Fiberboard Barrel Volume Share (%), by Type 2025 & 2033
- Figure 59: Asia Pacific Fiberboard Barrel Revenue (billion), by Country 2025 & 2033
- Figure 60: Asia Pacific Fiberboard Barrel Volume (K), by Country 2025 & 2033
- Figure 61: Asia Pacific Fiberboard Barrel Revenue Share (%), by Country 2025 & 2033
- Figure 62: Asia Pacific Fiberboard Barrel Volume Share (%), by Country 2025 & 2033
List of Tables
- Table 1: Global Fiberboard Barrel Revenue billion Forecast, by Application 2020 & 2033
- Table 2: Global Fiberboard Barrel Volume K Forecast, by Application 2020 & 2033
- Table 3: Global Fiberboard Barrel Revenue billion Forecast, by Type 2020 & 2033
- Table 4: Global Fiberboard Barrel Volume K Forecast, by Type 2020 & 2033
- Table 5: Global Fiberboard Barrel Revenue billion Forecast, by Region 2020 & 2033
- Table 6: Global Fiberboard Barrel Volume K Forecast, by Region 2020 & 2033
- Table 7: Global Fiberboard Barrel Revenue billion Forecast, by Application 2020 & 2033
- Table 8: Global Fiberboard Barrel Volume K Forecast, by Application 2020 & 2033
- Table 9: Global Fiberboard Barrel Revenue billion Forecast, by Type 2020 & 2033
- Table 10: Global Fiberboard Barrel Volume K Forecast, by Type 2020 & 2033
- Table 11: Global Fiberboard Barrel Revenue billion Forecast, by Country 2020 & 2033
- Table 12: Global Fiberboard Barrel Volume K Forecast, by Country 2020 & 2033
- Table 13: United States Fiberboard Barrel Revenue (billion) Forecast, by Application 2020 & 2033
- Table 14: United States Fiberboard Barrel Volume (K) Forecast, by Application 2020 & 2033
- Table 15: Canada Fiberboard Barrel Revenue (billion) Forecast, by Application 2020 & 2033
- Table 16: Canada Fiberboard Barrel Volume (K) Forecast, by Application 2020 & 2033
- Table 17: Mexico Fiberboard Barrel Revenue (billion) Forecast, by Application 2020 & 2033
- Table 18: Mexico Fiberboard Barrel Volume (K) Forecast, by Application 2020 & 2033
- Table 19: Global Fiberboard Barrel Revenue billion Forecast, by Application 2020 & 2033
- Table 20: Global Fiberboard Barrel Volume K Forecast, by Application 2020 & 2033
- Table 21: Global Fiberboard Barrel Revenue billion Forecast, by Type 2020 & 2033
- Table 22: Global Fiberboard Barrel Volume K Forecast, by Type 2020 & 2033
- Table 23: Global Fiberboard Barrel Revenue billion Forecast, by Country 2020 & 2033
- Table 24: Global Fiberboard Barrel Volume K Forecast, by Country 2020 & 2033
- Table 25: Brazil Fiberboard Barrel Revenue (billion) Forecast, by Application 2020 & 2033
- Table 26: Brazil Fiberboard Barrel Volume (K) Forecast, by Application 2020 & 2033
- Table 27: Argentina Fiberboard Barrel Revenue (billion) Forecast, by Application 2020 & 2033
- Table 28: Argentina Fiberboard Barrel Volume (K) Forecast, by Application 2020 & 2033
- Table 29: Rest of South America Fiberboard Barrel Revenue (billion) Forecast, by Application 2020 & 2033
- Table 30: Rest of South America Fiberboard Barrel Volume (K) Forecast, by Application 2020 & 2033
- Table 31: Global Fiberboard Barrel Revenue billion Forecast, by Application 2020 & 2033
- Table 32: Global Fiberboard Barrel Volume K Forecast, by Application 2020 & 2033
- Table 33: Global Fiberboard Barrel Revenue billion Forecast, by Type 2020 & 2033
- Table 34: Global Fiberboard Barrel Volume K Forecast, by Type 2020 & 2033
- Table 35: Global Fiberboard Barrel Revenue billion Forecast, by Country 2020 & 2033
- Table 36: Global Fiberboard Barrel Volume K Forecast, by Country 2020 & 2033
- Table 37: United Kingdom Fiberboard Barrel Revenue (billion) Forecast, by Application 2020 & 2033
- Table 38: United Kingdom Fiberboard Barrel Volume (K) Forecast, by Application 2020 & 2033
- Table 39: Germany Fiberboard Barrel Revenue (billion) Forecast, by Application 2020 & 2033
- Table 40: Germany Fiberboard Barrel Volume (K) Forecast, by Application 2020 & 2033
- Table 41: France Fiberboard Barrel Revenue (billion) Forecast, by Application 2020 & 2033
- Table 42: France Fiberboard Barrel Volume (K) Forecast, by Application 2020 & 2033
- Table 43: Italy Fiberboard Barrel Revenue (billion) Forecast, by Application 2020 & 2033
- Table 44: Italy Fiberboard Barrel Volume (K) Forecast, by Application 2020 & 2033
- Table 45: Spain Fiberboard Barrel Revenue (billion) Forecast, by Application 2020 & 2033
- Table 46: Spain Fiberboard Barrel Volume (K) Forecast, by Application 2020 & 2033
- Table 47: Russia Fiberboard Barrel Revenue (billion) Forecast, by Application 2020 & 2033
- Table 48: Russia Fiberboard Barrel Volume (K) Forecast, by Application 2020 & 2033
- Table 49: Benelux Fiberboard Barrel Revenue (billion) Forecast, by Application 2020 & 2033
- Table 50: Benelux Fiberboard Barrel Volume (K) Forecast, by Application 2020 & 2033
- Table 51: Nordics Fiberboard Barrel Revenue (billion) Forecast, by Application 2020 & 2033
- Table 52: Nordics Fiberboard Barrel Volume (K) Forecast, by Application 2020 & 2033
- Table 53: Rest of Europe Fiberboard Barrel Revenue (billion) Forecast, by Application 2020 & 2033
- Table 54: Rest of Europe Fiberboard Barrel Volume (K) Forecast, by Application 2020 & 2033
- Table 55: Global Fiberboard Barrel Revenue billion Forecast, by Application 2020 & 2033
- Table 56: Global Fiberboard Barrel Volume K Forecast, by Application 2020 & 2033
- Table 57: Global Fiberboard Barrel Revenue billion Forecast, by Type 2020 & 2033
- Table 58: Global Fiberboard Barrel Volume K Forecast, by Type 2020 & 2033
- Table 59: Global Fiberboard Barrel Revenue billion Forecast, by Country 2020 & 2033
- Table 60: Global Fiberboard Barrel Volume K Forecast, by Country 2020 & 2033
- Table 61: Turkey Fiberboard Barrel Revenue (billion) Forecast, by Application 2020 & 2033
- Table 62: Turkey Fiberboard Barrel Volume (K) Forecast, by Application 2020 & 2033
- Table 63: Israel Fiberboard Barrel Revenue (billion) Forecast, by Application 2020 & 2033
- Table 64: Israel Fiberboard Barrel Volume (K) Forecast, by Application 2020 & 2033
- Table 65: GCC Fiberboard Barrel Revenue (billion) Forecast, by Application 2020 & 2033
- Table 66: GCC Fiberboard Barrel Volume (K) Forecast, by Application 2020 & 2033
- Table 67: North Africa Fiberboard Barrel Revenue (billion) Forecast, by Application 2020 & 2033
- Table 68: North Africa Fiberboard Barrel Volume (K) Forecast, by Application 2020 & 2033
- Table 69: South Africa Fiberboard Barrel Revenue (billion) Forecast, by Application 2020 & 2033
- Table 70: South Africa Fiberboard Barrel Volume (K) Forecast, by Application 2020 & 2033
- Table 71: Rest of Middle East & Africa Fiberboard Barrel Revenue (billion) Forecast, by Application 2020 & 2033
- Table 72: Rest of Middle East & Africa Fiberboard Barrel Volume (K) Forecast, by Application 2020 & 2033
- Table 73: Global Fiberboard Barrel Revenue billion Forecast, by Application 2020 & 2033
- Table 74: Global Fiberboard Barrel Volume K Forecast, by Application 2020 & 2033
- Table 75: Global Fiberboard Barrel Revenue billion Forecast, by Type 2020 & 2033
- Table 76: Global Fiberboard Barrel Volume K Forecast, by Type 2020 & 2033
- Table 77: Global Fiberboard Barrel Revenue billion Forecast, by Country 2020 & 2033
- Table 78: Global Fiberboard Barrel Volume K Forecast, by Country 2020 & 2033
- Table 79: China Fiberboard Barrel Revenue (billion) Forecast, by Application 2020 & 2033
- Table 80: China Fiberboard Barrel Volume (K) Forecast, by Application 2020 & 2033
- Table 81: India Fiberboard Barrel Revenue (billion) Forecast, by Application 2020 & 2033
- Table 82: India Fiberboard Barrel Volume (K) Forecast, by Application 2020 & 2033
- Table 83: Japan Fiberboard Barrel Revenue (billion) Forecast, by Application 2020 & 2033
- Table 84: Japan Fiberboard Barrel Volume (K) Forecast, by Application 2020 & 2033
- Table 85: South Korea Fiberboard Barrel Revenue (billion) Forecast, by Application 2020 & 2033
- Table 86: South Korea Fiberboard Barrel Volume (K) Forecast, by Application 2020 & 2033
- Table 87: ASEAN Fiberboard Barrel Revenue (billion) Forecast, by Application 2020 & 2033
- Table 88: ASEAN Fiberboard Barrel Volume (K) Forecast, by Application 2020 & 2033
- Table 89: Oceania Fiberboard Barrel Revenue (billion) Forecast, by Application 2020 & 2033
- Table 90: Oceania Fiberboard Barrel Volume (K) Forecast, by Application 2020 & 2033
- Table 91: Rest of Asia Pacific Fiberboard Barrel Revenue (billion) Forecast, by Application 2020 & 2033
- Table 92: Rest of Asia Pacific Fiberboard Barrel Volume (K) Forecast, by Application 2020 & 2033
Frequently Asked Questions
1. What is the projected Compound Annual Growth Rate (CAGR) of the Fiberboard Barrel?
The projected CAGR is approximately 6.3%.
2. Which companies are prominent players in the Fiberboard Barrel?
Key companies in the market include Greif, CL Smith, Fibrestar Drums, Schutz Elsa, Mauser Group, TPL Plastech, Industrial Container Services (ICS), Fibre Drum Company, Sonoco Product, Orlando Drum & Container, Gaurav Composite Containers, Lianyungang Longteng Pccking Limited Company, Guangzhou Hongye Packaging Products, Jining Rencheng Xinhua Packaging Factory, Yangxin Jindaxiang Packaging Products, Shenyang Meika Paper Products Packaging, Shanghai Central Asia Packing.
3. What are the main segments of the Fiberboard Barrel?
The market segments include Application, Type.
4. Can you provide details about the market size?
The market size is estimated to be USD 1.47 billion as of 2022.
5. What are some drivers contributing to market growth?
N/A
6. What are the notable trends driving market growth?
N/A
7. Are there any restraints impacting market growth?
N/A
8. Can you provide examples of recent developments in the market?
N/A
9. What pricing options are available for accessing the report?
Pricing options include single-user, multi-user, and enterprise licenses priced at USD 3950.00, USD 5925.00, and USD 7900.00 respectively.
10. Is the market size provided in terms of value or volume?
The market size is provided in terms of value, measured in billion and volume, measured in K.
11. Are there any specific market keywords associated with the report?
Yes, the market keyword associated with the report is "Fiberboard Barrel," which aids in identifying and referencing the specific market segment covered.
12. How do I determine which pricing option suits my needs best?
The pricing options vary based on user requirements and access needs. Individual users may opt for single-user licenses, while businesses requiring broader access may choose multi-user or enterprise licenses for cost-effective access to the report.
13. Are there any additional resources or data provided in the Fiberboard Barrel report?
While the report offers comprehensive insights, it's advisable to review the specific contents or supplementary materials provided to ascertain if additional resources or data are available.
14. How can I stay updated on further developments or reports in the Fiberboard Barrel?
To stay informed about further developments, trends, and reports in the Fiberboard Barrel, consider subscribing to industry newsletters, following relevant companies and organizations, or regularly checking reputable industry news sources and publications.
Methodology
Step 1 - Identification of Relevant Samples Size from Population Database


Step 2 - Approaches for Defining Global Market Size (Value, Volume* & Price*)

Note*: In applicable scenarios
Step 3 - Data Sources
Primary Research
- Web Analytics
- Survey Reports
- Research Institute
- Latest Research Reports
- Opinion Leaders
Secondary Research
- Annual Reports
- White Paper
- Latest Press Release
- Industry Association
- Paid Database
- Investor Presentations

Step 4 - Data Triangulation
Involves using different sources of information in order to increase the validity of a study
These sources are likely to be stakeholders in a program - participants, other researchers, program staff, other community members, and so on.
Then we put all data in single framework & apply various statistical tools to find out the dynamic on the market.
During the analysis stage, feedback from the stakeholder groups would be compared to determine areas of agreement as well as areas of divergence