

Key Insights
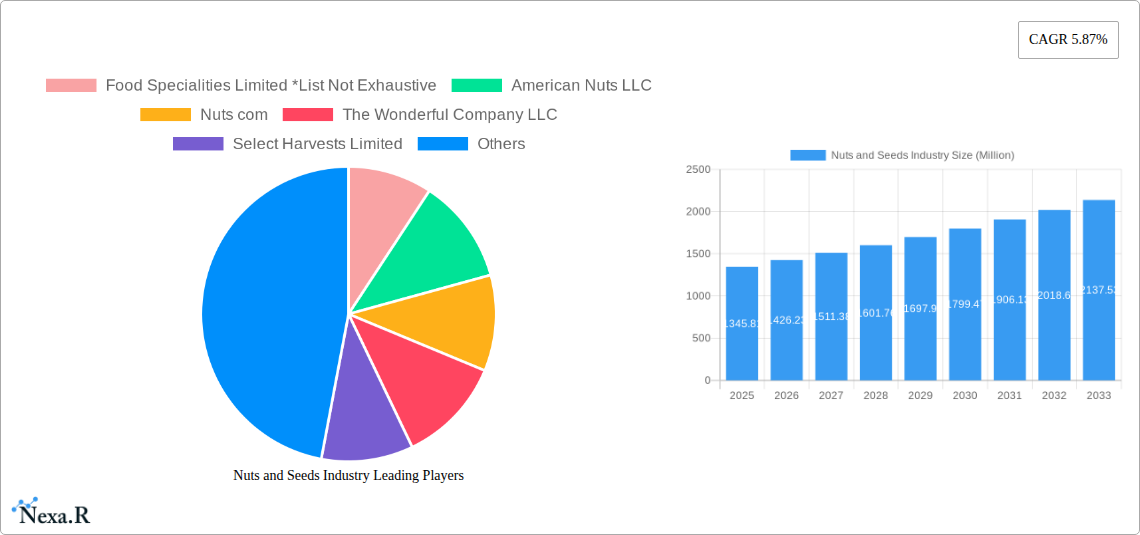
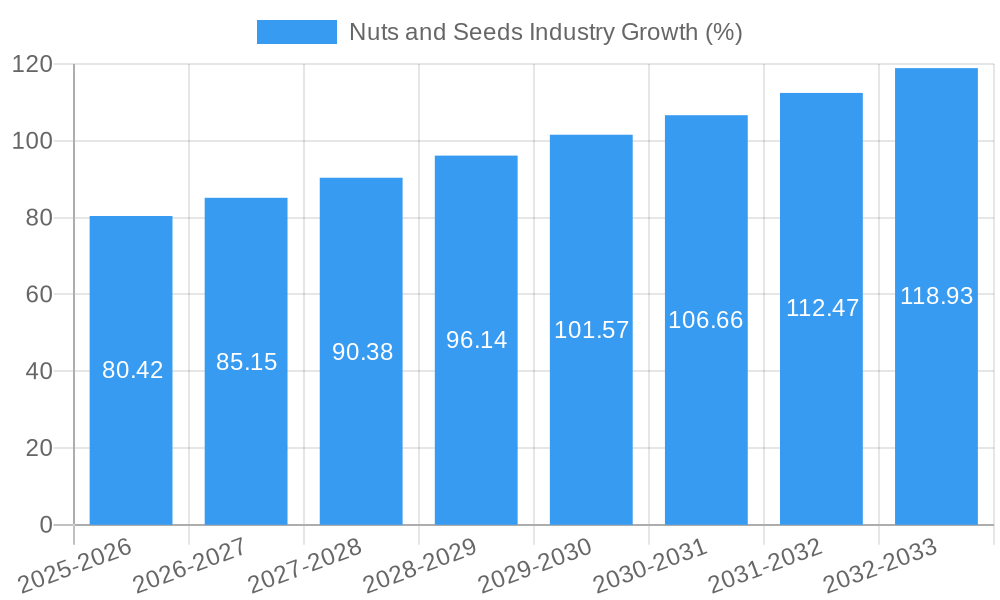
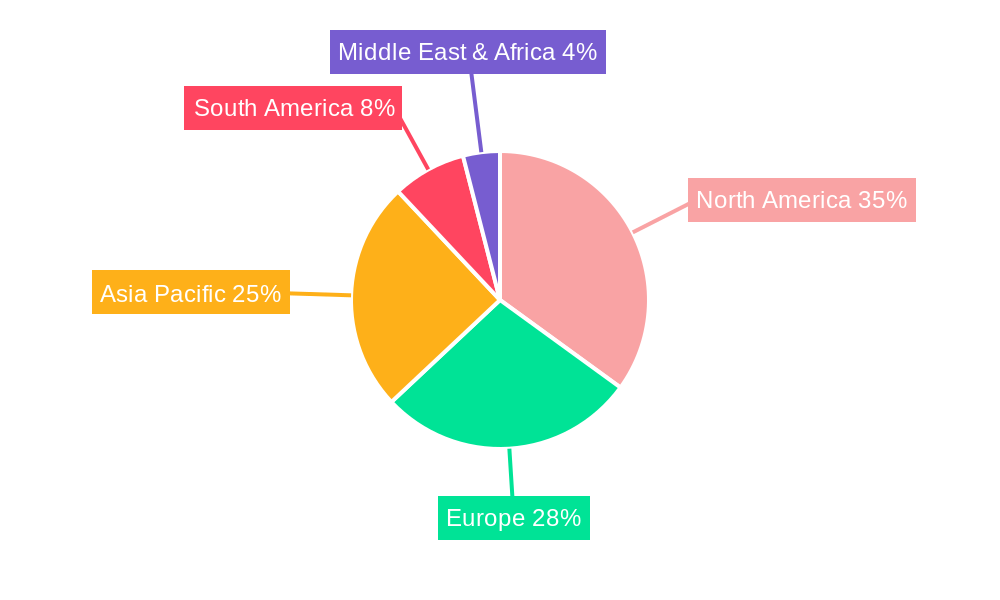
The global nuts and seeds market, valued at $1345.81 million in 2025, is projected to experience robust growth, driven by increasing consumer awareness of the health benefits associated with these products. The rising prevalence of health-conscious lifestyles, coupled with the growing demand for nutritious and convenient snack options, fuels this expansion. The market's steady Compound Annual Growth Rate (CAGR) of 5.87% from 2019 to 2024 indicates a consistent upward trajectory, expected to continue through 2033. Key drivers include the incorporation of nuts and seeds into diverse food and beverage applications, such as bakery goods, confectionery, dairy alternatives, and snack bars, catering to evolving consumer preferences. The versatility of nuts and seeds, allowing their use in various forms (whole, pieces, powdered, and oils), further expands market opportunities. The increasing adoption of plant-based diets and the growing demand for functional foods also contribute significantly to market growth. While potential restraints like price fluctuations in raw materials and seasonality of production exist, the market's positive growth outlook remains largely unhindered, particularly within the packaged nuts & seeds and trail mixes segments. Significant regional growth is anticipated in Asia Pacific, driven by rising disposable incomes and changing dietary habits in rapidly developing economies.
The segmentation reveals a dynamic market landscape. The "Food and Beverages" application segment holds significant market share, encompassing a wide range of product forms and retail channels. The "Bakery and Confectionery" segment within "Industrial applications" shows strong growth potential, driven by the increasing use of nuts and seeds as ingredients in processed foods. The "Packaged Nuts & Seeds" and "Trail Mixes" segments under "Retail" represent key consumer-facing product categories experiencing consistent demand. The market is dominated by major players like Food Specialities Limited, American Nuts LLC, and others, all vying for increased market penetration via innovative product offerings and strategic partnerships. Future market growth will likely be shaped by consumer preferences for sustainable and ethically sourced products, along with ongoing product innovation to cater to specific dietary needs and preferences.
Nuts and Seeds Industry Market Report: 2019-2033
This comprehensive report provides a detailed analysis of the Nuts and Seeds industry, encompassing market dynamics, growth trends, regional performance, product landscape, and key players. The study period covers 2019-2033, with 2025 as the base and estimated year. This report is an invaluable resource for industry professionals, investors, and strategic decision-makers seeking a deep understanding of this dynamic market. The report's analysis incorporates parent markets (e.g., food and beverage industry, health and wellness industry) and child markets (e.g., snack bars, bakery products) to provide a comprehensive view. Market values are presented in million units.
Nuts and Seeds Industry Market Dynamics & Structure
This section analyzes the competitive landscape, technological advancements, regulatory environment, and market trends within the nuts and seeds industry. We delve into market concentration, identifying key players and their market share. The analysis includes an examination of technological innovation drivers, such as advancements in processing and packaging, and explores the impact of regulatory frameworks on market growth. We also assess the influence of competitive product substitutes and evolving end-user demographics. Furthermore, the report examines M&A activity, providing quantitative insights into deal volumes and qualitative factors influencing merger and acquisition trends.
- Market Concentration: The global nuts and seeds market is moderately concentrated, with a few large players holding significant market share (xx%). Smaller regional players and specialized producers also contribute substantially.
- Technological Innovation: Advancements in processing, packaging (e.g., extended shelf life technologies), and quality control are major drivers. Barriers to innovation include high capital investment costs and regulatory compliance.
- Regulatory Framework: Food safety regulations and labeling requirements significantly impact operations, requiring compliance with varying standards across different regions.
- Competitive Substitutes: Other sources of protein and healthy fats (e.g., plant-based alternatives) exert competitive pressure, affecting market demand and pricing.
- End-User Demographics: Growing health consciousness, increasing disposable incomes, and shifting consumer preferences towards healthier snacks are major drivers.
- M&A Trends: The industry has witnessed xx M&A deals in the past five years, primarily driven by expansion strategies and consolidation efforts. (xx% increase compared to previous 5-year period)
Nuts and Seeds Industry Growth Trends & Insights
This section leverages extensive market research data to provide a detailed analysis of market size evolution, adoption rates, technological disruptions, and consumer behavior shifts within the nuts and seeds industry. The analysis includes a comprehensive review of historical data (2019-2024), the current market size and projection for the future (2025-2033). Specific metrics, such as CAGR (Compound Annual Growth Rate) and market penetration rates, are used to provide deeper insights into the dynamics of market growth. The impact of technological disruptions, changing consumer preferences, and emerging trends on market expansion are comprehensively examined. We project a CAGR of xx% for the forecast period (2025-2033).
Dominant Regions, Countries, or Segments in Nuts and Seeds Industry
This section identifies the leading regions, countries, and segments within the nuts and seeds market, focusing on the factors driving their growth. Analysis encompasses product type (nuts vs. seeds), form (whole, pieces & powdered, oils, other forms), and application (food and beverages, industrial, retail). Key drivers and dominance factors, including market share, growth potential, and economic conditions, are examined to understand the varying performances. North America currently holds a significant market share, with strong growth also observed in Asia-Pacific.
- Leading Regions: North America (xx million units), Asia-Pacific (xx million units), Europe (xx million units).
- Dominant Segments: The "Nuts" segment currently dominates (xx% market share) followed by the "Food & Beverage" application (xx% market share). Growth is expected in the powdered and oil segments.
- Key Drivers: Rising demand for healthy snacks, increasing awareness of health benefits (nutritional value), and robust food processing industries in key regions.
Nuts and Seeds Industry Product Landscape
The nuts and seeds market showcases diverse product offerings, characterized by ongoing innovation. New product development focuses on enhancing nutritional value, improving taste, and extending shelf life. Products range from conventional whole nuts and seeds to processed forms like powders and oils, catering to diverse applications across food, industrial, and retail segments. This diversity contributes to the market's dynamism and allows for various marketing strategies across multiple segments. Unique selling propositions include organic certifications, specific health benefits (e.g., omega-3 fatty acids), and convenient packaging.
Key Drivers, Barriers & Challenges in Nuts and Seeds Industry
Key Drivers: The nuts and seeds industry is experiencing rapid growth due to several factors, including increasing consumer demand for healthy and nutritious food options, growing awareness of the health benefits associated with nut and seed consumption, and the versatility of these products across various food applications. Government initiatives promoting healthy eating habits also contribute significantly to market growth.
Challenges and Restraints: The industry faces challenges including price volatility of raw materials due to fluctuating harvests, stringent regulatory requirements affecting production and labeling, and increasing competition from substitutes. Supply chain disruptions can also negatively impact market stability and accessibility. These factors can cause variability in product pricing and availability.
Emerging Opportunities in Nuts and Seeds Industry
Emerging opportunities arise from untapped markets in developing economies, growing demand for functional foods, and the exploration of innovative applications in areas like pharmaceuticals and cosmetics. The increasing use of nuts and seeds in vegan and plant-based products presents significant growth potential. Further, customized product formulations catering to specific dietary needs (e.g., gluten-free, allergen-free) are gaining traction.
Growth Accelerators in the Nuts and Seeds Industry
Long-term growth is fueled by continuous innovation in product development, strategic partnerships to expand market reach, and exploration of new applications in areas such as plant-based meat alternatives and nutrition bars. Technological advancements in processing and packaging are also critical growth enablers, enhancing product quality and shelf life. Furthermore, growing consumer awareness of the health benefits will continue to boost market demand.
Key Players Shaping the Nuts and Seeds Industry Market
- Food Specialities Limited
- American Nuts LLC
- Nuts.com
- The Wonderful Company LLC
- Select Harvests Limited
- Archer Daniels Midland Company
- Cargill Inc
- Olam Group
- HBS Foods Ltd
- Kanegrade Ltd
Notable Milestones in Nuts and Seeds Industry Sector
- September 2020: Harris Woolf Almonds launched almond powder and almond oil products.
- February 2022: Olam Nuts implemented a digital strategy for reaching smaller businesses through collaboration with Adobe Inc.
- March 2022: PB2 Foods introduced PB2 Cashew Powder, a non-GMO, kosher, vegan, and gluten-free product.
In-Depth Nuts and Seeds Industry Market Outlook
The nuts and seeds industry is poised for sustained growth, driven by increasing health consciousness, product diversification, and technological advancements. Strategic partnerships and expansion into new markets will further enhance market potential. Opportunities exist in developing specialized products catering to niche consumer segments and exploring innovative applications in non-food sectors. The market's future prospects are robust, promising significant returns for investors and key players.
Nuts and Seeds Industry Segmentation
-
1. Product Type
- 1.1. Nuts
- 1.2. Seeds
-
2. Form
- 2.1. Whole
- 2.2. Pieces & Powdered
- 2.3. Oils
- 2.4. Other Forms
-
3. Application
-
3.1. Food and Beverages
-
3.1.1. Industrial
- 3.1.1.1. Bakery and Confectionery
- 3.1.1.2. Dairy & Dairy Alternatives
- 3.1.1.3. Edible Oils
- 3.1.1.4. Snack Bars
- 3.1.1.5. Breakfast Cereals
- 3.1.1.6. Others
-
3.1.2. Retail
- 3.1.2.1. Packaged Nuts & Seeds
- 3.1.2.2. Trail Mixes
-
3.1.1. Industrial
- 3.2. Pharmaceutical
- 3.3. Cosmetics & Personal Care
- 3.4. Other Applications
-
3.1. Food and Beverages
Nuts and Seeds Industry Segmentation By Geography
-
1. North America
- 1.1. United States
- 1.2. Canada
- 1.3. Mexico
- 1.4. Rest of North America
-
2. Europe
- 2.1. United Kingdom
- 2.2. Germany
- 2.3. Spain
- 2.4. France
- 2.5. Italy
- 2.6. Russia
- 2.7. Rest of Europe
-
3. Asia Pacific
- 3.1. China
- 3.2. Japan
- 3.3. India
- 3.4. Australia
- 3.5. Rest of Asia Pacific
-
4. South America
- 4.1. Brazil
- 4.2. Argentina
- 4.3. Rest of South America
- 5. Middle East
-
6. United Arab Emirates
- 6.1. South Africa
- 6.2. Rest of Middle East
Nuts and Seeds Industry REPORT HIGHLIGHTS
| Aspects | Details |
|---|---|
| Study Period | 2019-2033 |
| Base Year | 2024 |
| Estimated Year | 2025 |
| Forecast Period | 2025-2033 |
| Historical Period | 2019-2024 |
| Growth Rate | CAGR of 5.87% from 2019-2033 |
| Segmentation |
|
Table of Contents
- 1. Introduction
- 1.1. Research Scope
- 1.2. Market Segmentation
- 1.3. Research Methodology
- 1.4. Definitions and Assumptions
- 2. Executive Summary
- 2.1. Introduction
- 3. Market Dynamics
- 3.1. Introduction
- 3.2. Market Drivers
- 3.2.1. Increasing Demand For Convenience & Processed Food
- 3.3. Market Restrains
- 3.3.1. Increased Consumer Awareness On Side-Effects Of Chemical Additives
- 3.4. Market Trends
- 3.4.1. Increasing Healthy Snack Demand is Fostering the Nuts and Seeds Market
- 4. Market Factor Analysis
- 4.1. Porters Five Forces
- 4.2. Supply/Value Chain
- 4.3. PESTEL analysis
- 4.4. Market Entropy
- 4.5. Patent/Trademark Analysis
- 5. Global Nuts and Seeds Industry Analysis, Insights and Forecast, 2019-2031
- 5.1. Market Analysis, Insights and Forecast - by Product Type
- 5.1.1. Nuts
- 5.1.2. Seeds
- 5.2. Market Analysis, Insights and Forecast - by Form
- 5.2.1. Whole
- 5.2.2. Pieces & Powdered
- 5.2.3. Oils
- 5.2.4. Other Forms
- 5.3. Market Analysis, Insights and Forecast - by Application
- 5.3.1. Food and Beverages
- 5.3.1.1. Industrial
- 5.3.1.1.1. Bakery and Confectionery
- 5.3.1.1.2. Dairy & Dairy Alternatives
- 5.3.1.1.3. Edible Oils
- 5.3.1.1.4. Snack Bars
- 5.3.1.1.5. Breakfast Cereals
- 5.3.1.1.6. Others
- 5.3.1.2. Retail
- 5.3.1.2.1. Packaged Nuts & Seeds
- 5.3.1.2.2. Trail Mixes
- 5.3.1.1. Industrial
- 5.3.2. Pharmaceutical
- 5.3.3. Cosmetics & Personal Care
- 5.3.4. Other Applications
- 5.3.1. Food and Beverages
- 5.4. Market Analysis, Insights and Forecast - by Region
- 5.4.1. North America
- 5.4.2. Europe
- 5.4.3. Asia Pacific
- 5.4.4. South America
- 5.4.5. Middle East
- 5.4.6. United Arab Emirates
- 5.1. Market Analysis, Insights and Forecast - by Product Type
- 6. North America Nuts and Seeds Industry Analysis, Insights and Forecast, 2019-2031
- 6.1. Market Analysis, Insights and Forecast - by Product Type
- 6.1.1. Nuts
- 6.1.2. Seeds
- 6.2. Market Analysis, Insights and Forecast - by Form
- 6.2.1. Whole
- 6.2.2. Pieces & Powdered
- 6.2.3. Oils
- 6.2.4. Other Forms
- 6.3. Market Analysis, Insights and Forecast - by Application
- 6.3.1. Food and Beverages
- 6.3.1.1. Industrial
- 6.3.1.1.1. Bakery and Confectionery
- 6.3.1.1.2. Dairy & Dairy Alternatives
- 6.3.1.1.3. Edible Oils
- 6.3.1.1.4. Snack Bars
- 6.3.1.1.5. Breakfast Cereals
- 6.3.1.1.6. Others
- 6.3.1.2. Retail
- 6.3.1.2.1. Packaged Nuts & Seeds
- 6.3.1.2.2. Trail Mixes
- 6.3.1.1. Industrial
- 6.3.2. Pharmaceutical
- 6.3.3. Cosmetics & Personal Care
- 6.3.4. Other Applications
- 6.3.1. Food and Beverages
- 6.1. Market Analysis, Insights and Forecast - by Product Type
- 7. Europe Nuts and Seeds Industry Analysis, Insights and Forecast, 2019-2031
- 7.1. Market Analysis, Insights and Forecast - by Product Type
- 7.1.1. Nuts
- 7.1.2. Seeds
- 7.2. Market Analysis, Insights and Forecast - by Form
- 7.2.1. Whole
- 7.2.2. Pieces & Powdered
- 7.2.3. Oils
- 7.2.4. Other Forms
- 7.3. Market Analysis, Insights and Forecast - by Application
- 7.3.1. Food and Beverages
- 7.3.1.1. Industrial
- 7.3.1.1.1. Bakery and Confectionery
- 7.3.1.1.2. Dairy & Dairy Alternatives
- 7.3.1.1.3. Edible Oils
- 7.3.1.1.4. Snack Bars
- 7.3.1.1.5. Breakfast Cereals
- 7.3.1.1.6. Others
- 7.3.1.2. Retail
- 7.3.1.2.1. Packaged Nuts & Seeds
- 7.3.1.2.2. Trail Mixes
- 7.3.1.1. Industrial
- 7.3.2. Pharmaceutical
- 7.3.3. Cosmetics & Personal Care
- 7.3.4. Other Applications
- 7.3.1. Food and Beverages
- 7.1. Market Analysis, Insights and Forecast - by Product Type
- 8. Asia Pacific Nuts and Seeds Industry Analysis, Insights and Forecast, 2019-2031
- 8.1. Market Analysis, Insights and Forecast - by Product Type
- 8.1.1. Nuts
- 8.1.2. Seeds
- 8.2. Market Analysis, Insights and Forecast - by Form
- 8.2.1. Whole
- 8.2.2. Pieces & Powdered
- 8.2.3. Oils
- 8.2.4. Other Forms
- 8.3. Market Analysis, Insights and Forecast - by Application
- 8.3.1. Food and Beverages
- 8.3.1.1. Industrial
- 8.3.1.1.1. Bakery and Confectionery
- 8.3.1.1.2. Dairy & Dairy Alternatives
- 8.3.1.1.3. Edible Oils
- 8.3.1.1.4. Snack Bars
- 8.3.1.1.5. Breakfast Cereals
- 8.3.1.1.6. Others
- 8.3.1.2. Retail
- 8.3.1.2.1. Packaged Nuts & Seeds
- 8.3.1.2.2. Trail Mixes
- 8.3.1.1. Industrial
- 8.3.2. Pharmaceutical
- 8.3.3. Cosmetics & Personal Care
- 8.3.4. Other Applications
- 8.3.1. Food and Beverages
- 8.1. Market Analysis, Insights and Forecast - by Product Type
- 9. South America Nuts and Seeds Industry Analysis, Insights and Forecast, 2019-2031
- 9.1. Market Analysis, Insights and Forecast - by Product Type
- 9.1.1. Nuts
- 9.1.2. Seeds
- 9.2. Market Analysis, Insights and Forecast - by Form
- 9.2.1. Whole
- 9.2.2. Pieces & Powdered
- 9.2.3. Oils
- 9.2.4. Other Forms
- 9.3. Market Analysis, Insights and Forecast - by Application
- 9.3.1. Food and Beverages
- 9.3.1.1. Industrial
- 9.3.1.1.1. Bakery and Confectionery
- 9.3.1.1.2. Dairy & Dairy Alternatives
- 9.3.1.1.3. Edible Oils
- 9.3.1.1.4. Snack Bars
- 9.3.1.1.5. Breakfast Cereals
- 9.3.1.1.6. Others
- 9.3.1.2. Retail
- 9.3.1.2.1. Packaged Nuts & Seeds
- 9.3.1.2.2. Trail Mixes
- 9.3.1.1. Industrial
- 9.3.2. Pharmaceutical
- 9.3.3. Cosmetics & Personal Care
- 9.3.4. Other Applications
- 9.3.1. Food and Beverages
- 9.1. Market Analysis, Insights and Forecast - by Product Type
- 10. Middle East Nuts and Seeds Industry Analysis, Insights and Forecast, 2019-2031
- 10.1. Market Analysis, Insights and Forecast - by Product Type
- 10.1.1. Nuts
- 10.1.2. Seeds
- 10.2. Market Analysis, Insights and Forecast - by Form
- 10.2.1. Whole
- 10.2.2. Pieces & Powdered
- 10.2.3. Oils
- 10.2.4. Other Forms
- 10.3. Market Analysis, Insights and Forecast - by Application
- 10.3.1. Food and Beverages
- 10.3.1.1. Industrial
- 10.3.1.1.1. Bakery and Confectionery
- 10.3.1.1.2. Dairy & Dairy Alternatives
- 10.3.1.1.3. Edible Oils
- 10.3.1.1.4. Snack Bars
- 10.3.1.1.5. Breakfast Cereals
- 10.3.1.1.6. Others
- 10.3.1.2. Retail
- 10.3.1.2.1. Packaged Nuts & Seeds
- 10.3.1.2.2. Trail Mixes
- 10.3.1.1. Industrial
- 10.3.2. Pharmaceutical
- 10.3.3. Cosmetics & Personal Care
- 10.3.4. Other Applications
- 10.3.1. Food and Beverages
- 10.1. Market Analysis, Insights and Forecast - by Product Type
- 11. United Arab Emirates Nuts and Seeds Industry Analysis, Insights and Forecast, 2019-2031
- 11.1. Market Analysis, Insights and Forecast - by Product Type
- 11.1.1. Nuts
- 11.1.2. Seeds
- 11.2. Market Analysis, Insights and Forecast - by Form
- 11.2.1. Whole
- 11.2.2. Pieces & Powdered
- 11.2.3. Oils
- 11.2.4. Other Forms
- 11.3. Market Analysis, Insights and Forecast - by Application
- 11.3.1. Food and Beverages
- 11.3.1.1. Industrial
- 11.3.1.1.1. Bakery and Confectionery
- 11.3.1.1.2. Dairy & Dairy Alternatives
- 11.3.1.1.3. Edible Oils
- 11.3.1.1.4. Snack Bars
- 11.3.1.1.5. Breakfast Cereals
- 11.3.1.1.6. Others
- 11.3.1.2. Retail
- 11.3.1.2.1. Packaged Nuts & Seeds
- 11.3.1.2.2. Trail Mixes
- 11.3.1.1. Industrial
- 11.3.2. Pharmaceutical
- 11.3.3. Cosmetics & Personal Care
- 11.3.4. Other Applications
- 11.3.1. Food and Beverages
- 11.1. Market Analysis, Insights and Forecast - by Product Type
- 12. North America Nuts and Seeds Industry Analysis, Insights and Forecast, 2019-2031
- 12.1. Market Analysis, Insights and Forecast - By Country/Sub-region
- 12.1.1 United States
- 12.1.2 Canada
- 12.1.3 Mexico
- 12.1.4 Rest of North America
- 13. Europe Nuts and Seeds Industry Analysis, Insights and Forecast, 2019-2031
- 13.1. Market Analysis, Insights and Forecast - By Country/Sub-region
- 13.1.1 United Kingdom
- 13.1.2 Germany
- 13.1.3 Spain
- 13.1.4 France
- 13.1.5 Italy
- 13.1.6 Russia
- 13.1.7 Rest of Europe
- 14. Asia Pacific Nuts and Seeds Industry Analysis, Insights and Forecast, 2019-2031
- 14.1. Market Analysis, Insights and Forecast - By Country/Sub-region
- 14.1.1 China
- 14.1.2 Japan
- 14.1.3 India
- 14.1.4 Australia
- 14.1.5 Rest of Asia Pacific
- 15. South America Nuts and Seeds Industry Analysis, Insights and Forecast, 2019-2031
- 15.1. Market Analysis, Insights and Forecast - By Country/Sub-region
- 15.1.1 Brazil
- 15.1.2 Argentina
- 15.1.3 Rest of South America
- 16. Middle East & Africa Nuts and Seeds Industry Analysis, Insights and Forecast, 2019-2031
- 16.1. Market Analysis, Insights and Forecast - By Country/Sub-region
- 16.1.1 UAE
- 16.1.2 South Africa
- 16.1.3 Saudi Arabia
- 16.1.4 Rest of MEA
- 17. United Arab Emirates Nuts and Seeds Industry Analysis, Insights and Forecast, 2019-2031
- 17.1. Market Analysis, Insights and Forecast - By Country/Sub-region
- 17.1.1 South Africa
- 17.1.2 Rest of Middle East
- 18. Competitive Analysis
- 18.1. Global Market Share Analysis 2024
- 18.2. Company Profiles
- 18.2.1 Food Specialities Limited *List Not Exhaustive
- 18.2.1.1. Overview
- 18.2.1.2. Products
- 18.2.1.3. SWOT Analysis
- 18.2.1.4. Recent Developments
- 18.2.1.5. Financials (Based on Availability)
- 18.2.2 American Nuts LLC
- 18.2.2.1. Overview
- 18.2.2.2. Products
- 18.2.2.3. SWOT Analysis
- 18.2.2.4. Recent Developments
- 18.2.2.5. Financials (Based on Availability)
- 18.2.3 Nuts com
- 18.2.3.1. Overview
- 18.2.3.2. Products
- 18.2.3.3. SWOT Analysis
- 18.2.3.4. Recent Developments
- 18.2.3.5. Financials (Based on Availability)
- 18.2.4 The Wonderful Company LLC
- 18.2.4.1. Overview
- 18.2.4.2. Products
- 18.2.4.3. SWOT Analysis
- 18.2.4.4. Recent Developments
- 18.2.4.5. Financials (Based on Availability)
- 18.2.5 Select Harvests Limited
- 18.2.5.1. Overview
- 18.2.5.2. Products
- 18.2.5.3. SWOT Analysis
- 18.2.5.4. Recent Developments
- 18.2.5.5. Financials (Based on Availability)
- 18.2.6 Archer Daniels Midland Company
- 18.2.6.1. Overview
- 18.2.6.2. Products
- 18.2.6.3. SWOT Analysis
- 18.2.6.4. Recent Developments
- 18.2.6.5. Financials (Based on Availability)
- 18.2.7 Cargill Inc
- 18.2.7.1. Overview
- 18.2.7.2. Products
- 18.2.7.3. SWOT Analysis
- 18.2.7.4. Recent Developments
- 18.2.7.5. Financials (Based on Availability)
- 18.2.8 Olam Group
- 18.2.8.1. Overview
- 18.2.8.2. Products
- 18.2.8.3. SWOT Analysis
- 18.2.8.4. Recent Developments
- 18.2.8.5. Financials (Based on Availability)
- 18.2.9 HBS Foods Ltd
- 18.2.9.1. Overview
- 18.2.9.2. Products
- 18.2.9.3. SWOT Analysis
- 18.2.9.4. Recent Developments
- 18.2.9.5. Financials (Based on Availability)
- 18.2.10 Kanegrade Ltd
- 18.2.10.1. Overview
- 18.2.10.2. Products
- 18.2.10.3. SWOT Analysis
- 18.2.10.4. Recent Developments
- 18.2.10.5. Financials (Based on Availability)
- 18.2.1 Food Specialities Limited *List Not Exhaustive
List of Figures
- Figure 1: Global Nuts and Seeds Industry Revenue Breakdown (Million, %) by Region 2024 & 2032
- Figure 2: Global Nuts and Seeds Industry Volume Breakdown (K Tons, %) by Region 2024 & 2032
- Figure 3: North America Nuts and Seeds Industry Revenue (Million), by Country 2024 & 2032
- Figure 4: North America Nuts and Seeds Industry Volume (K Tons), by Country 2024 & 2032
- Figure 5: North America Nuts and Seeds Industry Revenue Share (%), by Country 2024 & 2032
- Figure 6: North America Nuts and Seeds Industry Volume Share (%), by Country 2024 & 2032
- Figure 7: Europe Nuts and Seeds Industry Revenue (Million), by Country 2024 & 2032
- Figure 8: Europe Nuts and Seeds Industry Volume (K Tons), by Country 2024 & 2032
- Figure 9: Europe Nuts and Seeds Industry Revenue Share (%), by Country 2024 & 2032
- Figure 10: Europe Nuts and Seeds Industry Volume Share (%), by Country 2024 & 2032
- Figure 11: Asia Pacific Nuts and Seeds Industry Revenue (Million), by Country 2024 & 2032
- Figure 12: Asia Pacific Nuts and Seeds Industry Volume (K Tons), by Country 2024 & 2032
- Figure 13: Asia Pacific Nuts and Seeds Industry Revenue Share (%), by Country 2024 & 2032
- Figure 14: Asia Pacific Nuts and Seeds Industry Volume Share (%), by Country 2024 & 2032
- Figure 15: South America Nuts and Seeds Industry Revenue (Million), by Country 2024 & 2032
- Figure 16: South America Nuts and Seeds Industry Volume (K Tons), by Country 2024 & 2032
- Figure 17: South America Nuts and Seeds Industry Revenue Share (%), by Country 2024 & 2032
- Figure 18: South America Nuts and Seeds Industry Volume Share (%), by Country 2024 & 2032
- Figure 19: Middle East & Africa Nuts and Seeds Industry Revenue (Million), by Country 2024 & 2032
- Figure 20: Middle East & Africa Nuts and Seeds Industry Volume (K Tons), by Country 2024 & 2032
- Figure 21: Middle East & Africa Nuts and Seeds Industry Revenue Share (%), by Country 2024 & 2032
- Figure 22: Middle East & Africa Nuts and Seeds Industry Volume Share (%), by Country 2024 & 2032
- Figure 23: United Arab Emirates Nuts and Seeds Industry Revenue (Million), by Country 2024 & 2032
- Figure 24: United Arab Emirates Nuts and Seeds Industry Volume (K Tons), by Country 2024 & 2032
- Figure 25: United Arab Emirates Nuts and Seeds Industry Revenue Share (%), by Country 2024 & 2032
- Figure 26: United Arab Emirates Nuts and Seeds Industry Volume Share (%), by Country 2024 & 2032
- Figure 27: North America Nuts and Seeds Industry Revenue (Million), by Product Type 2024 & 2032
- Figure 28: North America Nuts and Seeds Industry Volume (K Tons), by Product Type 2024 & 2032
- Figure 29: North America Nuts and Seeds Industry Revenue Share (%), by Product Type 2024 & 2032
- Figure 30: North America Nuts and Seeds Industry Volume Share (%), by Product Type 2024 & 2032
- Figure 31: North America Nuts and Seeds Industry Revenue (Million), by Form 2024 & 2032
- Figure 32: North America Nuts and Seeds Industry Volume (K Tons), by Form 2024 & 2032
- Figure 33: North America Nuts and Seeds Industry Revenue Share (%), by Form 2024 & 2032
- Figure 34: North America Nuts and Seeds Industry Volume Share (%), by Form 2024 & 2032
- Figure 35: North America Nuts and Seeds Industry Revenue (Million), by Application 2024 & 2032
- Figure 36: North America Nuts and Seeds Industry Volume (K Tons), by Application 2024 & 2032
- Figure 37: North America Nuts and Seeds Industry Revenue Share (%), by Application 2024 & 2032
- Figure 38: North America Nuts and Seeds Industry Volume Share (%), by Application 2024 & 2032
- Figure 39: North America Nuts and Seeds Industry Revenue (Million), by Country 2024 & 2032
- Figure 40: North America Nuts and Seeds Industry Volume (K Tons), by Country 2024 & 2032
- Figure 41: North America Nuts and Seeds Industry Revenue Share (%), by Country 2024 & 2032
- Figure 42: North America Nuts and Seeds Industry Volume Share (%), by Country 2024 & 2032
- Figure 43: Europe Nuts and Seeds Industry Revenue (Million), by Product Type 2024 & 2032
- Figure 44: Europe Nuts and Seeds Industry Volume (K Tons), by Product Type 2024 & 2032
- Figure 45: Europe Nuts and Seeds Industry Revenue Share (%), by Product Type 2024 & 2032
- Figure 46: Europe Nuts and Seeds Industry Volume Share (%), by Product Type 2024 & 2032
- Figure 47: Europe Nuts and Seeds Industry Revenue (Million), by Form 2024 & 2032
- Figure 48: Europe Nuts and Seeds Industry Volume (K Tons), by Form 2024 & 2032
- Figure 49: Europe Nuts and Seeds Industry Revenue Share (%), by Form 2024 & 2032
- Figure 50: Europe Nuts and Seeds Industry Volume Share (%), by Form 2024 & 2032
- Figure 51: Europe Nuts and Seeds Industry Revenue (Million), by Application 2024 & 2032
- Figure 52: Europe Nuts and Seeds Industry Volume (K Tons), by Application 2024 & 2032
- Figure 53: Europe Nuts and Seeds Industry Revenue Share (%), by Application 2024 & 2032
- Figure 54: Europe Nuts and Seeds Industry Volume Share (%), by Application 2024 & 2032
- Figure 55: Europe Nuts and Seeds Industry Revenue (Million), by Country 2024 & 2032
- Figure 56: Europe Nuts and Seeds Industry Volume (K Tons), by Country 2024 & 2032
- Figure 57: Europe Nuts and Seeds Industry Revenue Share (%), by Country 2024 & 2032
- Figure 58: Europe Nuts and Seeds Industry Volume Share (%), by Country 2024 & 2032
- Figure 59: Asia Pacific Nuts and Seeds Industry Revenue (Million), by Product Type 2024 & 2032
- Figure 60: Asia Pacific Nuts and Seeds Industry Volume (K Tons), by Product Type 2024 & 2032
- Figure 61: Asia Pacific Nuts and Seeds Industry Revenue Share (%), by Product Type 2024 & 2032
- Figure 62: Asia Pacific Nuts and Seeds Industry Volume Share (%), by Product Type 2024 & 2032
- Figure 63: Asia Pacific Nuts and Seeds Industry Revenue (Million), by Form 2024 & 2032
- Figure 64: Asia Pacific Nuts and Seeds Industry Volume (K Tons), by Form 2024 & 2032
- Figure 65: Asia Pacific Nuts and Seeds Industry Revenue Share (%), by Form 2024 & 2032
- Figure 66: Asia Pacific Nuts and Seeds Industry Volume Share (%), by Form 2024 & 2032
- Figure 67: Asia Pacific Nuts and Seeds Industry Revenue (Million), by Application 2024 & 2032
- Figure 68: Asia Pacific Nuts and Seeds Industry Volume (K Tons), by Application 2024 & 2032
- Figure 69: Asia Pacific Nuts and Seeds Industry Revenue Share (%), by Application 2024 & 2032
- Figure 70: Asia Pacific Nuts and Seeds Industry Volume Share (%), by Application 2024 & 2032
- Figure 71: Asia Pacific Nuts and Seeds Industry Revenue (Million), by Country 2024 & 2032
- Figure 72: Asia Pacific Nuts and Seeds Industry Volume (K Tons), by Country 2024 & 2032
- Figure 73: Asia Pacific Nuts and Seeds Industry Revenue Share (%), by Country 2024 & 2032
- Figure 74: Asia Pacific Nuts and Seeds Industry Volume Share (%), by Country 2024 & 2032
- Figure 75: South America Nuts and Seeds Industry Revenue (Million), by Product Type 2024 & 2032
- Figure 76: South America Nuts and Seeds Industry Volume (K Tons), by Product Type 2024 & 2032
- Figure 77: South America Nuts and Seeds Industry Revenue Share (%), by Product Type 2024 & 2032
- Figure 78: South America Nuts and Seeds Industry Volume Share (%), by Product Type 2024 & 2032
- Figure 79: South America Nuts and Seeds Industry Revenue (Million), by Form 2024 & 2032
- Figure 80: South America Nuts and Seeds Industry Volume (K Tons), by Form 2024 & 2032
- Figure 81: South America Nuts and Seeds Industry Revenue Share (%), by Form 2024 & 2032
- Figure 82: South America Nuts and Seeds Industry Volume Share (%), by Form 2024 & 2032
- Figure 83: South America Nuts and Seeds Industry Revenue (Million), by Application 2024 & 2032
- Figure 84: South America Nuts and Seeds Industry Volume (K Tons), by Application 2024 & 2032
- Figure 85: South America Nuts and Seeds Industry Revenue Share (%), by Application 2024 & 2032
- Figure 86: South America Nuts and Seeds Industry Volume Share (%), by Application 2024 & 2032
- Figure 87: South America Nuts and Seeds Industry Revenue (Million), by Country 2024 & 2032
- Figure 88: South America Nuts and Seeds Industry Volume (K Tons), by Country 2024 & 2032
- Figure 89: South America Nuts and Seeds Industry Revenue Share (%), by Country 2024 & 2032
- Figure 90: South America Nuts and Seeds Industry Volume Share (%), by Country 2024 & 2032
- Figure 91: Middle East Nuts and Seeds Industry Revenue (Million), by Product Type 2024 & 2032
- Figure 92: Middle East Nuts and Seeds Industry Volume (K Tons), by Product Type 2024 & 2032
- Figure 93: Middle East Nuts and Seeds Industry Revenue Share (%), by Product Type 2024 & 2032
- Figure 94: Middle East Nuts and Seeds Industry Volume Share (%), by Product Type 2024 & 2032
- Figure 95: Middle East Nuts and Seeds Industry Revenue (Million), by Form 2024 & 2032
- Figure 96: Middle East Nuts and Seeds Industry Volume (K Tons), by Form 2024 & 2032
- Figure 97: Middle East Nuts and Seeds Industry Revenue Share (%), by Form 2024 & 2032
- Figure 98: Middle East Nuts and Seeds Industry Volume Share (%), by Form 2024 & 2032
- Figure 99: Middle East Nuts and Seeds Industry Revenue (Million), by Application 2024 & 2032
- Figure 100: Middle East Nuts and Seeds Industry Volume (K Tons), by Application 2024 & 2032
- Figure 101: Middle East Nuts and Seeds Industry Revenue Share (%), by Application 2024 & 2032
- Figure 102: Middle East Nuts and Seeds Industry Volume Share (%), by Application 2024 & 2032
- Figure 103: Middle East Nuts and Seeds Industry Revenue (Million), by Country 2024 & 2032
- Figure 104: Middle East Nuts and Seeds Industry Volume (K Tons), by Country 2024 & 2032
- Figure 105: Middle East Nuts and Seeds Industry Revenue Share (%), by Country 2024 & 2032
- Figure 106: Middle East Nuts and Seeds Industry Volume Share (%), by Country 2024 & 2032
- Figure 107: United Arab Emirates Nuts and Seeds Industry Revenue (Million), by Product Type 2024 & 2032
- Figure 108: United Arab Emirates Nuts and Seeds Industry Volume (K Tons), by Product Type 2024 & 2032
- Figure 109: United Arab Emirates Nuts and Seeds Industry Revenue Share (%), by Product Type 2024 & 2032
- Figure 110: United Arab Emirates Nuts and Seeds Industry Volume Share (%), by Product Type 2024 & 2032
- Figure 111: United Arab Emirates Nuts and Seeds Industry Revenue (Million), by Form 2024 & 2032
- Figure 112: United Arab Emirates Nuts and Seeds Industry Volume (K Tons), by Form 2024 & 2032
- Figure 113: United Arab Emirates Nuts and Seeds Industry Revenue Share (%), by Form 2024 & 2032
- Figure 114: United Arab Emirates Nuts and Seeds Industry Volume Share (%), by Form 2024 & 2032
- Figure 115: United Arab Emirates Nuts and Seeds Industry Revenue (Million), by Application 2024 & 2032
- Figure 116: United Arab Emirates Nuts and Seeds Industry Volume (K Tons), by Application 2024 & 2032
- Figure 117: United Arab Emirates Nuts and Seeds Industry Revenue Share (%), by Application 2024 & 2032
- Figure 118: United Arab Emirates Nuts and Seeds Industry Volume Share (%), by Application 2024 & 2032
- Figure 119: United Arab Emirates Nuts and Seeds Industry Revenue (Million), by Country 2024 & 2032
- Figure 120: United Arab Emirates Nuts and Seeds Industry Volume (K Tons), by Country 2024 & 2032
- Figure 121: United Arab Emirates Nuts and Seeds Industry Revenue Share (%), by Country 2024 & 2032
- Figure 122: United Arab Emirates Nuts and Seeds Industry Volume Share (%), by Country 2024 & 2032
List of Tables
- Table 1: Global Nuts and Seeds Industry Revenue Million Forecast, by Region 2019 & 2032
- Table 2: Global Nuts and Seeds Industry Volume K Tons Forecast, by Region 2019 & 2032
- Table 3: Global Nuts and Seeds Industry Revenue Million Forecast, by Product Type 2019 & 2032
- Table 4: Global Nuts and Seeds Industry Volume K Tons Forecast, by Product Type 2019 & 2032
- Table 5: Global Nuts and Seeds Industry Revenue Million Forecast, by Form 2019 & 2032
- Table 6: Global Nuts and Seeds Industry Volume K Tons Forecast, by Form 2019 & 2032
- Table 7: Global Nuts and Seeds Industry Revenue Million Forecast, by Application 2019 & 2032
- Table 8: Global Nuts and Seeds Industry Volume K Tons Forecast, by Application 2019 & 2032
- Table 9: Global Nuts and Seeds Industry Revenue Million Forecast, by Region 2019 & 2032
- Table 10: Global Nuts and Seeds Industry Volume K Tons Forecast, by Region 2019 & 2032
- Table 11: Global Nuts and Seeds Industry Revenue Million Forecast, by Country 2019 & 2032
- Table 12: Global Nuts and Seeds Industry Volume K Tons Forecast, by Country 2019 & 2032
- Table 13: United States Nuts and Seeds Industry Revenue (Million) Forecast, by Application 2019 & 2032
- Table 14: United States Nuts and Seeds Industry Volume (K Tons) Forecast, by Application 2019 & 2032
- Table 15: Canada Nuts and Seeds Industry Revenue (Million) Forecast, by Application 2019 & 2032
- Table 16: Canada Nuts and Seeds Industry Volume (K Tons) Forecast, by Application 2019 & 2032
- Table 17: Mexico Nuts and Seeds Industry Revenue (Million) Forecast, by Application 2019 & 2032
- Table 18: Mexico Nuts and Seeds Industry Volume (K Tons) Forecast, by Application 2019 & 2032
- Table 19: Rest of North America Nuts and Seeds Industry Revenue (Million) Forecast, by Application 2019 & 2032
- Table 20: Rest of North America Nuts and Seeds Industry Volume (K Tons) Forecast, by Application 2019 & 2032
- Table 21: Global Nuts and Seeds Industry Revenue Million Forecast, by Country 2019 & 2032
- Table 22: Global Nuts and Seeds Industry Volume K Tons Forecast, by Country 2019 & 2032
- Table 23: United Kingdom Nuts and Seeds Industry Revenue (Million) Forecast, by Application 2019 & 2032
- Table 24: United Kingdom Nuts and Seeds Industry Volume (K Tons) Forecast, by Application 2019 & 2032
- Table 25: Germany Nuts and Seeds Industry Revenue (Million) Forecast, by Application 2019 & 2032
- Table 26: Germany Nuts and Seeds Industry Volume (K Tons) Forecast, by Application 2019 & 2032
- Table 27: Spain Nuts and Seeds Industry Revenue (Million) Forecast, by Application 2019 & 2032
- Table 28: Spain Nuts and Seeds Industry Volume (K Tons) Forecast, by Application 2019 & 2032
- Table 29: France Nuts and Seeds Industry Revenue (Million) Forecast, by Application 2019 & 2032
- Table 30: France Nuts and Seeds Industry Volume (K Tons) Forecast, by Application 2019 & 2032
- Table 31: Italy Nuts and Seeds Industry Revenue (Million) Forecast, by Application 2019 & 2032
- Table 32: Italy Nuts and Seeds Industry Volume (K Tons) Forecast, by Application 2019 & 2032
- Table 33: Russia Nuts and Seeds Industry Revenue (Million) Forecast, by Application 2019 & 2032
- Table 34: Russia Nuts and Seeds Industry Volume (K Tons) Forecast, by Application 2019 & 2032
- Table 35: Rest of Europe Nuts and Seeds Industry Revenue (Million) Forecast, by Application 2019 & 2032
- Table 36: Rest of Europe Nuts and Seeds Industry Volume (K Tons) Forecast, by Application 2019 & 2032
- Table 37: Global Nuts and Seeds Industry Revenue Million Forecast, by Country 2019 & 2032
- Table 38: Global Nuts and Seeds Industry Volume K Tons Forecast, by Country 2019 & 2032
- Table 39: China Nuts and Seeds Industry Revenue (Million) Forecast, by Application 2019 & 2032
- Table 40: China Nuts and Seeds Industry Volume (K Tons) Forecast, by Application 2019 & 2032
- Table 41: Japan Nuts and Seeds Industry Revenue (Million) Forecast, by Application 2019 & 2032
- Table 42: Japan Nuts and Seeds Industry Volume (K Tons) Forecast, by Application 2019 & 2032
- Table 43: India Nuts and Seeds Industry Revenue (Million) Forecast, by Application 2019 & 2032
- Table 44: India Nuts and Seeds Industry Volume (K Tons) Forecast, by Application 2019 & 2032
- Table 45: Australia Nuts and Seeds Industry Revenue (Million) Forecast, by Application 2019 & 2032
- Table 46: Australia Nuts and Seeds Industry Volume (K Tons) Forecast, by Application 2019 & 2032
- Table 47: Rest of Asia Pacific Nuts and Seeds Industry Revenue (Million) Forecast, by Application 2019 & 2032
- Table 48: Rest of Asia Pacific Nuts and Seeds Industry Volume (K Tons) Forecast, by Application 2019 & 2032
- Table 49: Global Nuts and Seeds Industry Revenue Million Forecast, by Country 2019 & 2032
- Table 50: Global Nuts and Seeds Industry Volume K Tons Forecast, by Country 2019 & 2032
- Table 51: Brazil Nuts and Seeds Industry Revenue (Million) Forecast, by Application 2019 & 2032
- Table 52: Brazil Nuts and Seeds Industry Volume (K Tons) Forecast, by Application 2019 & 2032
- Table 53: Argentina Nuts and Seeds Industry Revenue (Million) Forecast, by Application 2019 & 2032
- Table 54: Argentina Nuts and Seeds Industry Volume (K Tons) Forecast, by Application 2019 & 2032
- Table 55: Rest of South America Nuts and Seeds Industry Revenue (Million) Forecast, by Application 2019 & 2032
- Table 56: Rest of South America Nuts and Seeds Industry Volume (K Tons) Forecast, by Application 2019 & 2032
- Table 57: Global Nuts and Seeds Industry Revenue Million Forecast, by Country 2019 & 2032
- Table 58: Global Nuts and Seeds Industry Volume K Tons Forecast, by Country 2019 & 2032
- Table 59: UAE Nuts and Seeds Industry Revenue (Million) Forecast, by Application 2019 & 2032
- Table 60: UAE Nuts and Seeds Industry Volume (K Tons) Forecast, by Application 2019 & 2032
- Table 61: South Africa Nuts and Seeds Industry Revenue (Million) Forecast, by Application 2019 & 2032
- Table 62: South Africa Nuts and Seeds Industry Volume (K Tons) Forecast, by Application 2019 & 2032
- Table 63: Saudi Arabia Nuts and Seeds Industry Revenue (Million) Forecast, by Application 2019 & 2032
- Table 64: Saudi Arabia Nuts and Seeds Industry Volume (K Tons) Forecast, by Application 2019 & 2032
- Table 65: Rest of MEA Nuts and Seeds Industry Revenue (Million) Forecast, by Application 2019 & 2032
- Table 66: Rest of MEA Nuts and Seeds Industry Volume (K Tons) Forecast, by Application 2019 & 2032
- Table 67: Global Nuts and Seeds Industry Revenue Million Forecast, by Country 2019 & 2032
- Table 68: Global Nuts and Seeds Industry Volume K Tons Forecast, by Country 2019 & 2032
- Table 69: South Africa Nuts and Seeds Industry Revenue (Million) Forecast, by Application 2019 & 2032
- Table 70: South Africa Nuts and Seeds Industry Volume (K Tons) Forecast, by Application 2019 & 2032
- Table 71: Rest of Middle East Nuts and Seeds Industry Revenue (Million) Forecast, by Application 2019 & 2032
- Table 72: Rest of Middle East Nuts and Seeds Industry Volume (K Tons) Forecast, by Application 2019 & 2032
- Table 73: Global Nuts and Seeds Industry Revenue Million Forecast, by Product Type 2019 & 2032
- Table 74: Global Nuts and Seeds Industry Volume K Tons Forecast, by Product Type 2019 & 2032
- Table 75: Global Nuts and Seeds Industry Revenue Million Forecast, by Form 2019 & 2032
- Table 76: Global Nuts and Seeds Industry Volume K Tons Forecast, by Form 2019 & 2032
- Table 77: Global Nuts and Seeds Industry Revenue Million Forecast, by Application 2019 & 2032
- Table 78: Global Nuts and Seeds Industry Volume K Tons Forecast, by Application 2019 & 2032
- Table 79: Global Nuts and Seeds Industry Revenue Million Forecast, by Country 2019 & 2032
- Table 80: Global Nuts and Seeds Industry Volume K Tons Forecast, by Country 2019 & 2032
- Table 81: United States Nuts and Seeds Industry Revenue (Million) Forecast, by Application 2019 & 2032
- Table 82: United States Nuts and Seeds Industry Volume (K Tons) Forecast, by Application 2019 & 2032
- Table 83: Canada Nuts and Seeds Industry Revenue (Million) Forecast, by Application 2019 & 2032
- Table 84: Canada Nuts and Seeds Industry Volume (K Tons) Forecast, by Application 2019 & 2032
- Table 85: Mexico Nuts and Seeds Industry Revenue (Million) Forecast, by Application 2019 & 2032
- Table 86: Mexico Nuts and Seeds Industry Volume (K Tons) Forecast, by Application 2019 & 2032
- Table 87: Rest of North America Nuts and Seeds Industry Revenue (Million) Forecast, by Application 2019 & 2032
- Table 88: Rest of North America Nuts and Seeds Industry Volume (K Tons) Forecast, by Application 2019 & 2032
- Table 89: Global Nuts and Seeds Industry Revenue Million Forecast, by Product Type 2019 & 2032
- Table 90: Global Nuts and Seeds Industry Volume K Tons Forecast, by Product Type 2019 & 2032
- Table 91: Global Nuts and Seeds Industry Revenue Million Forecast, by Form 2019 & 2032
- Table 92: Global Nuts and Seeds Industry Volume K Tons Forecast, by Form 2019 & 2032
- Table 93: Global Nuts and Seeds Industry Revenue Million Forecast, by Application 2019 & 2032
- Table 94: Global Nuts and Seeds Industry Volume K Tons Forecast, by Application 2019 & 2032
- Table 95: Global Nuts and Seeds Industry Revenue Million Forecast, by Country 2019 & 2032
- Table 96: Global Nuts and Seeds Industry Volume K Tons Forecast, by Country 2019 & 2032
- Table 97: United Kingdom Nuts and Seeds Industry Revenue (Million) Forecast, by Application 2019 & 2032
- Table 98: United Kingdom Nuts and Seeds Industry Volume (K Tons) Forecast, by Application 2019 & 2032
- Table 99: Germany Nuts and Seeds Industry Revenue (Million) Forecast, by Application 2019 & 2032
- Table 100: Germany Nuts and Seeds Industry Volume (K Tons) Forecast, by Application 2019 & 2032
- Table 101: Spain Nuts and Seeds Industry Revenue (Million) Forecast, by Application 2019 & 2032
- Table 102: Spain Nuts and Seeds Industry Volume (K Tons) Forecast, by Application 2019 & 2032
- Table 103: France Nuts and Seeds Industry Revenue (Million) Forecast, by Application 2019 & 2032
- Table 104: France Nuts and Seeds Industry Volume (K Tons) Forecast, by Application 2019 & 2032
- Table 105: Italy Nuts and Seeds Industry Revenue (Million) Forecast, by Application 2019 & 2032
- Table 106: Italy Nuts and Seeds Industry Volume (K Tons) Forecast, by Application 2019 & 2032
- Table 107: Russia Nuts and Seeds Industry Revenue (Million) Forecast, by Application 2019 & 2032
- Table 108: Russia Nuts and Seeds Industry Volume (K Tons) Forecast, by Application 2019 & 2032
- Table 109: Rest of Europe Nuts and Seeds Industry Revenue (Million) Forecast, by Application 2019 & 2032
- Table 110: Rest of Europe Nuts and Seeds Industry Volume (K Tons) Forecast, by Application 2019 & 2032
- Table 111: Global Nuts and Seeds Industry Revenue Million Forecast, by Product Type 2019 & 2032
- Table 112: Global Nuts and Seeds Industry Volume K Tons Forecast, by Product Type 2019 & 2032
- Table 113: Global Nuts and Seeds Industry Revenue Million Forecast, by Form 2019 & 2032
- Table 114: Global Nuts and Seeds Industry Volume K Tons Forecast, by Form 2019 & 2032
- Table 115: Global Nuts and Seeds Industry Revenue Million Forecast, by Application 2019 & 2032
- Table 116: Global Nuts and Seeds Industry Volume K Tons Forecast, by Application 2019 & 2032
- Table 117: Global Nuts and Seeds Industry Revenue Million Forecast, by Country 2019 & 2032
- Table 118: Global Nuts and Seeds Industry Volume K Tons Forecast, by Country 2019 & 2032
- Table 119: China Nuts and Seeds Industry Revenue (Million) Forecast, by Application 2019 & 2032
- Table 120: China Nuts and Seeds Industry Volume (K Tons) Forecast, by Application 2019 & 2032
- Table 121: Japan Nuts and Seeds Industry Revenue (Million) Forecast, by Application 2019 & 2032
- Table 122: Japan Nuts and Seeds Industry Volume (K Tons) Forecast, by Application 2019 & 2032
- Table 123: India Nuts and Seeds Industry Revenue (Million) Forecast, by Application 2019 & 2032
- Table 124: India Nuts and Seeds Industry Volume (K Tons) Forecast, by Application 2019 & 2032
- Table 125: Australia Nuts and Seeds Industry Revenue (Million) Forecast, by Application 2019 & 2032
- Table 126: Australia Nuts and Seeds Industry Volume (K Tons) Forecast, by Application 2019 & 2032
- Table 127: Rest of Asia Pacific Nuts and Seeds Industry Revenue (Million) Forecast, by Application 2019 & 2032
- Table 128: Rest of Asia Pacific Nuts and Seeds Industry Volume (K Tons) Forecast, by Application 2019 & 2032
- Table 129: Global Nuts and Seeds Industry Revenue Million Forecast, by Product Type 2019 & 2032
- Table 130: Global Nuts and Seeds Industry Volume K Tons Forecast, by Product Type 2019 & 2032
- Table 131: Global Nuts and Seeds Industry Revenue Million Forecast, by Form 2019 & 2032
- Table 132: Global Nuts and Seeds Industry Volume K Tons Forecast, by Form 2019 & 2032
- Table 133: Global Nuts and Seeds Industry Revenue Million Forecast, by Application 2019 & 2032
- Table 134: Global Nuts and Seeds Industry Volume K Tons Forecast, by Application 2019 & 2032
- Table 135: Global Nuts and Seeds Industry Revenue Million Forecast, by Country 2019 & 2032
- Table 136: Global Nuts and Seeds Industry Volume K Tons Forecast, by Country 2019 & 2032
- Table 137: Brazil Nuts and Seeds Industry Revenue (Million) Forecast, by Application 2019 & 2032
- Table 138: Brazil Nuts and Seeds Industry Volume (K Tons) Forecast, by Application 2019 & 2032
- Table 139: Argentina Nuts and Seeds Industry Revenue (Million) Forecast, by Application 2019 & 2032
- Table 140: Argentina Nuts and Seeds Industry Volume (K Tons) Forecast, by Application 2019 & 2032
- Table 141: Rest of South America Nuts and Seeds Industry Revenue (Million) Forecast, by Application 2019 & 2032
- Table 142: Rest of South America Nuts and Seeds Industry Volume (K Tons) Forecast, by Application 2019 & 2032
- Table 143: Global Nuts and Seeds Industry Revenue Million Forecast, by Product Type 2019 & 2032
- Table 144: Global Nuts and Seeds Industry Volume K Tons Forecast, by Product Type 2019 & 2032
- Table 145: Global Nuts and Seeds Industry Revenue Million Forecast, by Form 2019 & 2032
- Table 146: Global Nuts and Seeds Industry Volume K Tons Forecast, by Form 2019 & 2032
- Table 147: Global Nuts and Seeds Industry Revenue Million Forecast, by Application 2019 & 2032
- Table 148: Global Nuts and Seeds Industry Volume K Tons Forecast, by Application 2019 & 2032
- Table 149: Global Nuts and Seeds Industry Revenue Million Forecast, by Country 2019 & 2032
- Table 150: Global Nuts and Seeds Industry Volume K Tons Forecast, by Country 2019 & 2032
- Table 151: Global Nuts and Seeds Industry Revenue Million Forecast, by Product Type 2019 & 2032
- Table 152: Global Nuts and Seeds Industry Volume K Tons Forecast, by Product Type 2019 & 2032
- Table 153: Global Nuts and Seeds Industry Revenue Million Forecast, by Form 2019 & 2032
- Table 154: Global Nuts and Seeds Industry Volume K Tons Forecast, by Form 2019 & 2032
- Table 155: Global Nuts and Seeds Industry Revenue Million Forecast, by Application 2019 & 2032
- Table 156: Global Nuts and Seeds Industry Volume K Tons Forecast, by Application 2019 & 2032
- Table 157: Global Nuts and Seeds Industry Revenue Million Forecast, by Country 2019 & 2032
- Table 158: Global Nuts and Seeds Industry Volume K Tons Forecast, by Country 2019 & 2032
- Table 159: South Africa Nuts and Seeds Industry Revenue (Million) Forecast, by Application 2019 & 2032
- Table 160: South Africa Nuts and Seeds Industry Volume (K Tons) Forecast, by Application 2019 & 2032
- Table 161: Rest of Middle East Nuts and Seeds Industry Revenue (Million) Forecast, by Application 2019 & 2032
- Table 162: Rest of Middle East Nuts and Seeds Industry Volume (K Tons) Forecast, by Application 2019 & 2032
Frequently Asked Questions
1. What is the projected Compound Annual Growth Rate (CAGR) of the Nuts and Seeds Industry?
The projected CAGR is approximately 5.87%.
2. Which companies are prominent players in the Nuts and Seeds Industry?
Key companies in the market include Food Specialities Limited *List Not Exhaustive, American Nuts LLC, Nuts com, The Wonderful Company LLC, Select Harvests Limited, Archer Daniels Midland Company, Cargill Inc, Olam Group, HBS Foods Ltd, Kanegrade Ltd.
3. What are the main segments of the Nuts and Seeds Industry?
The market segments include Product Type, Form, Application.
4. Can you provide details about the market size?
The market size is estimated to be USD 1345.81 Million as of 2022.
5. What are some drivers contributing to market growth?
Increasing Demand For Convenience & Processed Food.
6. What are the notable trends driving market growth?
Increasing Healthy Snack Demand is Fostering the Nuts and Seeds Market.
7. Are there any restraints impacting market growth?
Increased Consumer Awareness On Side-Effects Of Chemical Additives.
8. Can you provide examples of recent developments in the market?
In March 2022, PB2 Foods, a renowned player in the powdered nut butter market, introduced PB2 Cashew Powder. The cashew powders were claimed to be manufactured entirely of non-GMO cashews, kosher, vegan, and gluten-free, and included no additional salt, sugar, or preservatives as per the company.
9. What pricing options are available for accessing the report?
Pricing options include single-user, multi-user, and enterprise licenses priced at USD 4750, USD 5250, and USD 8750 respectively.
10. Is the market size provided in terms of value or volume?
The market size is provided in terms of value, measured in Million and volume, measured in K Tons.
11. Are there any specific market keywords associated with the report?
Yes, the market keyword associated with the report is "Nuts and Seeds Industry," which aids in identifying and referencing the specific market segment covered.
12. How do I determine which pricing option suits my needs best?
The pricing options vary based on user requirements and access needs. Individual users may opt for single-user licenses, while businesses requiring broader access may choose multi-user or enterprise licenses for cost-effective access to the report.
13. Are there any additional resources or data provided in the Nuts and Seeds Industry report?
While the report offers comprehensive insights, it's advisable to review the specific contents or supplementary materials provided to ascertain if additional resources or data are available.
14. How can I stay updated on further developments or reports in the Nuts and Seeds Industry?
To stay informed about further developments, trends, and reports in the Nuts and Seeds Industry, consider subscribing to industry newsletters, following relevant companies and organizations, or regularly checking reputable industry news sources and publications.
Methodology
Step 1 - Identification of Relevant Samples Size from Population Database


Step 2 - Approaches for Defining Global Market Size (Value, Volume* & Price*)

Note*: In applicable scenarios
Step 3 - Data Sources
Primary Research
- Web Analytics
- Survey Reports
- Research Institute
- Latest Research Reports
- Opinion Leaders
Secondary Research
- Annual Reports
- White Paper
- Latest Press Release
- Industry Association
- Paid Database
- Investor Presentations

Step 4 - Data Triangulation
Involves using different sources of information in order to increase the validity of a study
These sources are likely to be stakeholders in a program - participants, other researchers, program staff, other community members, and so on.
Then we put all data in single framework & apply various statistical tools to find out the dynamic on the market.
During the analysis stage, feedback from the stakeholder groups would be compared to determine areas of agreement as well as areas of divergence
