

Key Insights
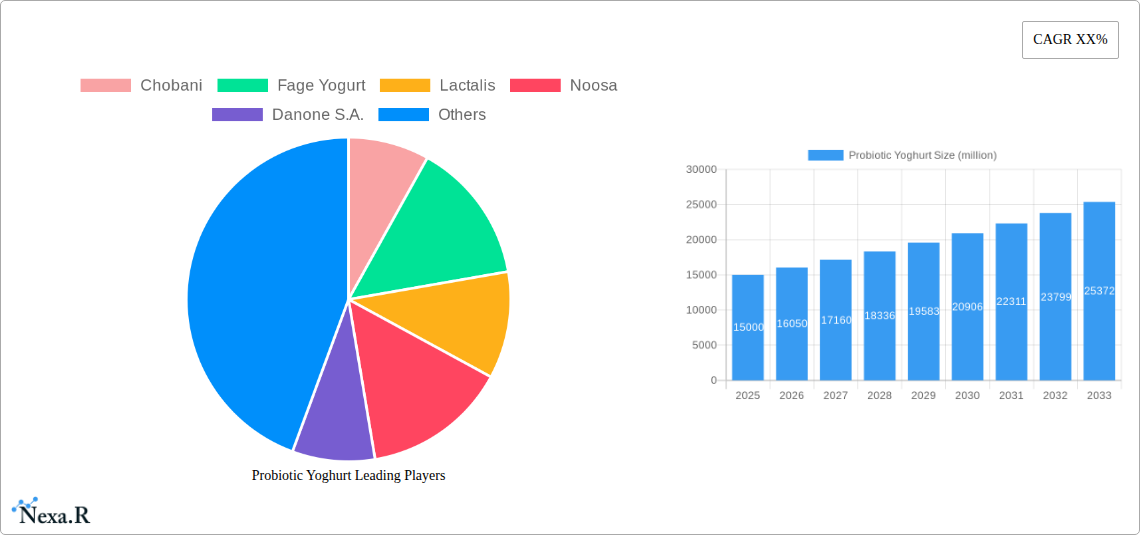
The global probiotic yogurt market is experiencing robust growth, driven by increasing consumer awareness of gut health and the associated benefits of probiotics. The market, estimated at $15 billion in 2025, is projected to exhibit a Compound Annual Growth Rate (CAGR) of 7% from 2025 to 2033, reaching an estimated $25 billion by 2033. This expansion is fueled by several key factors, including the rising prevalence of digestive disorders, increasing demand for functional foods, and a growing preference for natural and healthy food options. Consumers are actively seeking products that support their overall well-being, and probiotic yogurt, with its established health benefits, perfectly aligns with this trend. The market is segmented by product type (e.g., drinkable, frozen, etc.), distribution channel (e.g., supermarkets, online retailers), and geography, with North America and Europe currently holding significant market shares.
Major players like Chobani, Danone, and Nestlé are strategically investing in research and development to innovate product offerings, expanding their product lines to include a wider variety of flavors, textures, and probiotic strains. Furthermore, the increasing accessibility of online retail channels is further contributing to market growth, offering consumers convenient access to a wider range of probiotic yogurt options. However, challenges remain, including price sensitivity among consumers and potential variations in probiotic efficacy depending on the strain and manufacturing processes. Companies are addressing these concerns by introducing more affordable options and focusing on quality control to ensure consistent product quality and efficacy. The market's future growth will likely be shaped by further innovation in probiotic strains, personalized nutrition approaches, and the expansion into emerging markets with growing health-conscious populations.
Probiotic Yoghurt Market Report: 2019-2033
This comprehensive report provides a detailed analysis of the global probiotic yoghurt market, encompassing market dynamics, growth trends, competitive landscape, and future outlook. The study period covers 2019-2033, with 2025 as the base and estimated year. The forecast period spans 2025-2033, and the historical period is 2019-2024. This report is crucial for industry professionals, investors, and market entrants seeking a deep understanding of this dynamic sector. The parent market is the dairy industry and child market is the functional foods market.
Probiotic Yoghurt Market Dynamics & Structure
This section analyzes the competitive intensity, innovation drivers, regulatory environment, and market trends within the probiotic yoghurt industry. The global market size in 2024 was estimated at 500 million units.
- Market Concentration: The market is moderately concentrated, with key players holding significant shares. Chobani, Danone, and Nestlé are among the leading players, collectively accounting for approximately xx% of the market share in 2024.
- Technological Innovation: Advances in probiotic strain development, fermentation technologies, and packaging solutions are driving product innovation. The focus is on enhancing shelf life, improving taste and texture, and developing products catering to specific health needs.
- Regulatory Framework: Stringent regulations concerning food safety, labeling, and health claims influence product development and marketing strategies. Varied regulatory landscapes across different regions pose challenges to market expansion.
- Competitive Product Substitutes: Other fermented dairy products, plant-based alternatives, and other functional foods pose competition. The market faces the challenge of differentiating itself through unique value propositions.
- End-User Demographics: Health-conscious consumers, particularly millennials and Gen Z, are driving the demand for probiotic yoghurt. Growing awareness of gut health and its impact on overall well-being fuels this trend.
- M&A Trends: The industry has witnessed a moderate level of M&A activity in recent years. xx major deals were reported between 2019 and 2024, primarily driven by expansion into new markets and product portfolios. These deals indicate a consolidation trend and increasing competition.
Probiotic Yoghurt Growth Trends & Insights
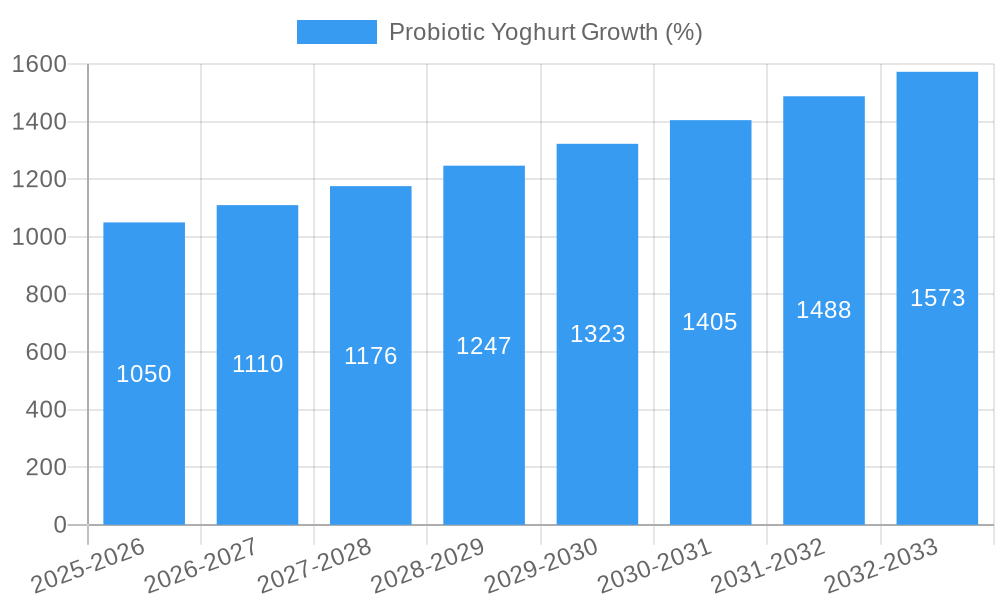
This section delves into the evolution of the probiotic yoghurt market, examining key growth drivers and market dynamics. The global market is projected to experience a CAGR of xx% during the forecast period (2025-2033), reaching xx million units by 2033. This growth is fueled by factors such as increasing consumer awareness of gut health, expanding product offerings, and successful marketing campaigns. Market penetration in developed regions is relatively high, while emerging markets offer significant growth potential. Technological advancements, including personalized nutrition, are driving further market expansion. Changes in consumer preferences, towards convenience and health-conscious options, are also influencing market growth.
Dominant Regions, Countries, or Segments in Probiotic Yoghurt
North America currently holds the largest market share, driven by high consumer awareness and strong purchasing power. However, Asia Pacific is projected to exhibit the fastest growth rate over the forecast period due to increasing disposable income and rising health consciousness.
- Key Drivers in North America: Strong regulatory frameworks, advanced manufacturing facilities, and well-established distribution channels contribute to its dominance.
- Key Drivers in Asia Pacific: Rapid urbanization, increasing disposable incomes, and rising health concerns are fueling market growth in this region.
- Europe: Established market with steady growth, driven by innovation and evolving consumer preferences.
- Market Share Breakdown: North America (xx%), Europe (xx%), Asia Pacific (xx%), Rest of World (xx%) (2024 estimates).
Probiotic Yoghurt Product Landscape
The probiotic yoghurt market offers a wide range of products, including traditional styles, Greek yoghurt, and organic options. Product innovations focus on enhanced taste, texture, functionality, and convenience. Manufacturers are increasingly incorporating unique flavors, using innovative packaging, and expanding product lines to meet the diverse needs of consumers. The emphasis on clean labels and natural ingredients is further driving innovation.
Key Drivers, Barriers & Challenges in Probiotic Yoghurt
Key Drivers:
- Growing consumer awareness of gut health and probiotics.
- Increasing demand for functional foods and healthy alternatives.
- Product innovation and diversification, including organic and plant-based options.
Challenges & Restraints:
- Intense competition and pricing pressures from numerous market participants.
- Stringent regulations concerning labeling and health claims.
- Maintaining the viability and stability of probiotic cultures during manufacturing and storage. Supply chain disruptions can affect product quality and availability.
Emerging Opportunities in Probiotic Yoghurt
- Expanding into emerging markets with high growth potential.
- Developing innovative products with targeted health benefits.
- Leveraging personalized nutrition technologies to cater to individual needs.
- Creating sustainable and environmentally friendly product packaging.
Growth Accelerators in the Probiotic Yoghurt Industry
Technological advancements in strain development and fermentation technologies, strategic partnerships to access wider distribution networks, and successful marketing campaigns focused on educating consumers about gut health, are key growth accelerators. Expansion into new geographic markets, tapping into the growing demand for convenient and healthier food options, will further fuel market growth.
Key Players Shaping the Probiotic Yoghurt Market
- Chobani
- Fage Yogurt
- Lactalis
- Noosa
- Danone S.A.
- General Mills, Inc.
- Nestlé S.A.
- Fonterra Co-operative Group Limited
- Mother Dairy Fruit & Vegetable Pvt Ltd.
- Meiji Holdings Company, Ltd.
- Chobani LLC
- FAGE International S.A.
- Good Karma Foods, Inc.
- Inner Mongolia Yili Industrial Group Co., Ltd.
- Sovos Brands Intermediate, Inc.
- The Coconut Collaborative
- Yofix Probiotics Ltd.
- GT's Living Foods LLC
- COYO Pty Ltd.
- Ehrmann AG
- Forager Project, LLC
- Lancashire Farm Dairies
- Olympic Dairy Products Ltd
Notable Milestones in Probiotic Yoghurt Sector
- 2020: Increased focus on plant-based probiotic yoghurts.
- 2021: Launch of several new probiotic strains with enhanced health benefits.
- 2022: Several mergers and acquisitions consolidate the market.
- 2023: Rise in demand for organic and sustainable probiotic yoghurt.
- 2024: Growing emphasis on personalized nutrition and gut microbiome analysis.
In-Depth Probiotic Yoghurt Market Outlook
The probiotic yoghurt market is poised for continued growth, driven by sustained consumer demand for healthier food options and ongoing technological innovation. Strategic partnerships, expansion into new markets, and continued focus on product innovation will be key to success for market players. The focus on personalized nutrition and scientific validation of health benefits will further enhance the market’s growth trajectory in the coming years.
Probiotic Yoghurt Segmentation
-
1. Application
- 1.1. Supermarkets / Outlets
- 1.2. Specialty Shops
- 1.3. Convenience Stores
- 1.4. Online Sales
- 1.5. Other
-
2. Types
- 2.1. Full Fat
- 2.2. Skim
Probiotic Yoghurt Segmentation By Geography
-
1. North America
- 1.1. United States
- 1.2. Canada
- 1.3. Mexico
-
2. South America
- 2.1. Brazil
- 2.2. Argentina
- 2.3. Rest of South America
-
3. Europe
- 3.1. United Kingdom
- 3.2. Germany
- 3.3. France
- 3.4. Italy
- 3.5. Spain
- 3.6. Russia
- 3.7. Benelux
- 3.8. Nordics
- 3.9. Rest of Europe
-
4. Middle East & Africa
- 4.1. Turkey
- 4.2. Israel
- 4.3. GCC
- 4.4. North Africa
- 4.5. South Africa
- 4.6. Rest of Middle East & Africa
-
5. Asia Pacific
- 5.1. China
- 5.2. India
- 5.3. Japan
- 5.4. South Korea
- 5.5. ASEAN
- 5.6. Oceania
- 5.7. Rest of Asia Pacific

Probiotic Yoghurt REPORT HIGHLIGHTS
| Aspects | Details |
|---|---|
| Study Period | 2019-2033 |
| Base Year | 2024 |
| Estimated Year | 2025 |
| Forecast Period | 2025-2033 |
| Historical Period | 2019-2024 |
| Growth Rate | CAGR of XX% from 2019-2033 |
| Segmentation |
|
Table of Contents
- 1. Introduction
- 1.1. Research Scope
- 1.2. Market Segmentation
- 1.3. Research Methodology
- 1.4. Definitions and Assumptions
- 2. Executive Summary
- 2.1. Introduction
- 3. Market Dynamics
- 3.1. Introduction
- 3.2. Market Drivers
- 3.3. Market Restrains
- 3.4. Market Trends
- 4. Market Factor Analysis
- 4.1. Porters Five Forces
- 4.2. Supply/Value Chain
- 4.3. PESTEL analysis
- 4.4. Market Entropy
- 4.5. Patent/Trademark Analysis
- 5. Global Probiotic Yoghurt Analysis, Insights and Forecast, 2019-2031
- 5.1. Market Analysis, Insights and Forecast - by Application
- 5.1.1. Supermarkets / Outlets
- 5.1.2. Specialty Shops
- 5.1.3. Convenience Stores
- 5.1.4. Online Sales
- 5.1.5. Other
- 5.2. Market Analysis, Insights and Forecast - by Types
- 5.2.1. Full Fat
- 5.2.2. Skim
- 5.3. Market Analysis, Insights and Forecast - by Region
- 5.3.1. North America
- 5.3.2. South America
- 5.3.3. Europe
- 5.3.4. Middle East & Africa
- 5.3.5. Asia Pacific
- 5.1. Market Analysis, Insights and Forecast - by Application
- 6. North America Probiotic Yoghurt Analysis, Insights and Forecast, 2019-2031
- 6.1. Market Analysis, Insights and Forecast - by Application
- 6.1.1. Supermarkets / Outlets
- 6.1.2. Specialty Shops
- 6.1.3. Convenience Stores
- 6.1.4. Online Sales
- 6.1.5. Other
- 6.2. Market Analysis, Insights and Forecast - by Types
- 6.2.1. Full Fat
- 6.2.2. Skim
- 6.1. Market Analysis, Insights and Forecast - by Application
- 7. South America Probiotic Yoghurt Analysis, Insights and Forecast, 2019-2031
- 7.1. Market Analysis, Insights and Forecast - by Application
- 7.1.1. Supermarkets / Outlets
- 7.1.2. Specialty Shops
- 7.1.3. Convenience Stores
- 7.1.4. Online Sales
- 7.1.5. Other
- 7.2. Market Analysis, Insights and Forecast - by Types
- 7.2.1. Full Fat
- 7.2.2. Skim
- 7.1. Market Analysis, Insights and Forecast - by Application
- 8. Europe Probiotic Yoghurt Analysis, Insights and Forecast, 2019-2031
- 8.1. Market Analysis, Insights and Forecast - by Application
- 8.1.1. Supermarkets / Outlets
- 8.1.2. Specialty Shops
- 8.1.3. Convenience Stores
- 8.1.4. Online Sales
- 8.1.5. Other
- 8.2. Market Analysis, Insights and Forecast - by Types
- 8.2.1. Full Fat
- 8.2.2. Skim
- 8.1. Market Analysis, Insights and Forecast - by Application
- 9. Middle East & Africa Probiotic Yoghurt Analysis, Insights and Forecast, 2019-2031
- 9.1. Market Analysis, Insights and Forecast - by Application
- 9.1.1. Supermarkets / Outlets
- 9.1.2. Specialty Shops
- 9.1.3. Convenience Stores
- 9.1.4. Online Sales
- 9.1.5. Other
- 9.2. Market Analysis, Insights and Forecast - by Types
- 9.2.1. Full Fat
- 9.2.2. Skim
- 9.1. Market Analysis, Insights and Forecast - by Application
- 10. Asia Pacific Probiotic Yoghurt Analysis, Insights and Forecast, 2019-2031
- 10.1. Market Analysis, Insights and Forecast - by Application
- 10.1.1. Supermarkets / Outlets
- 10.1.2. Specialty Shops
- 10.1.3. Convenience Stores
- 10.1.4. Online Sales
- 10.1.5. Other
- 10.2. Market Analysis, Insights and Forecast - by Types
- 10.2.1. Full Fat
- 10.2.2. Skim
- 10.1. Market Analysis, Insights and Forecast - by Application
- 11. Competitive Analysis
- 11.1. Global Market Share Analysis 2024
- 11.2. Company Profiles
- 11.2.1 Chobani
- 11.2.1.1. Overview
- 11.2.1.2. Products
- 11.2.1.3. SWOT Analysis
- 11.2.1.4. Recent Developments
- 11.2.1.5. Financials (Based on Availability)
- 11.2.2 Fage Yogurt
- 11.2.2.1. Overview
- 11.2.2.2. Products
- 11.2.2.3. SWOT Analysis
- 11.2.2.4. Recent Developments
- 11.2.2.5. Financials (Based on Availability)
- 11.2.3 Lactalis
- 11.2.3.1. Overview
- 11.2.3.2. Products
- 11.2.3.3. SWOT Analysis
- 11.2.3.4. Recent Developments
- 11.2.3.5. Financials (Based on Availability)
- 11.2.4 Noosa
- 11.2.4.1. Overview
- 11.2.4.2. Products
- 11.2.4.3. SWOT Analysis
- 11.2.4.4. Recent Developments
- 11.2.4.5. Financials (Based on Availability)
- 11.2.5 Danone S.A.
- 11.2.5.1. Overview
- 11.2.5.2. Products
- 11.2.5.3. SWOT Analysis
- 11.2.5.4. Recent Developments
- 11.2.5.5. Financials (Based on Availability)
- 11.2.6 General Mills
- 11.2.6.1. Overview
- 11.2.6.2. Products
- 11.2.6.3. SWOT Analysis
- 11.2.6.4. Recent Developments
- 11.2.6.5. Financials (Based on Availability)
- 11.2.7 Inc.
- 11.2.7.1. Overview
- 11.2.7.2. Products
- 11.2.7.3. SWOT Analysis
- 11.2.7.4. Recent Developments
- 11.2.7.5. Financials (Based on Availability)
- 11.2.8 Nestlé S.A.
- 11.2.8.1. Overview
- 11.2.8.2. Products
- 11.2.8.3. SWOT Analysis
- 11.2.8.4. Recent Developments
- 11.2.8.5. Financials (Based on Availability)
- 11.2.9 Fonterra Co-operative Group Limited
- 11.2.9.1. Overview
- 11.2.9.2. Products
- 11.2.9.3. SWOT Analysis
- 11.2.9.4. Recent Developments
- 11.2.9.5. Financials (Based on Availability)
- 11.2.10 Mother Dairy Fruit & Vegetable Pvt Ltd.
- 11.2.10.1. Overview
- 11.2.10.2. Products
- 11.2.10.3. SWOT Analysis
- 11.2.10.4. Recent Developments
- 11.2.10.5. Financials (Based on Availability)
- 11.2.11 Meiji Holdings Company
- 11.2.11.1. Overview
- 11.2.11.2. Products
- 11.2.11.3. SWOT Analysis
- 11.2.11.4. Recent Developments
- 11.2.11.5. Financials (Based on Availability)
- 11.2.12 Ltd.
- 11.2.12.1. Overview
- 11.2.12.2. Products
- 11.2.12.3. SWOT Analysis
- 11.2.12.4. Recent Developments
- 11.2.12.5. Financials (Based on Availability)
- 11.2.13 Chobani LLC
- 11.2.13.1. Overview
- 11.2.13.2. Products
- 11.2.13.3. SWOT Analysis
- 11.2.13.4. Recent Developments
- 11.2.13.5. Financials (Based on Availability)
- 11.2.14 FAGE International S.A.
- 11.2.14.1. Overview
- 11.2.14.2. Products
- 11.2.14.3. SWOT Analysis
- 11.2.14.4. Recent Developments
- 11.2.14.5. Financials (Based on Availability)
- 11.2.15 Good Karma Foods
- 11.2.15.1. Overview
- 11.2.15.2. Products
- 11.2.15.3. SWOT Analysis
- 11.2.15.4. Recent Developments
- 11.2.15.5. Financials (Based on Availability)
- 11.2.16 Inc.
- 11.2.16.1. Overview
- 11.2.16.2. Products
- 11.2.16.3. SWOT Analysis
- 11.2.16.4. Recent Developments
- 11.2.16.5. Financials (Based on Availability)
- 11.2.17 Inner Mongolia Yili Industrial Group Co.
- 11.2.17.1. Overview
- 11.2.17.2. Products
- 11.2.17.3. SWOT Analysis
- 11.2.17.4. Recent Developments
- 11.2.17.5. Financials (Based on Availability)
- 11.2.18 Ltd.
- 11.2.18.1. Overview
- 11.2.18.2. Products
- 11.2.18.3. SWOT Analysis
- 11.2.18.4. Recent Developments
- 11.2.18.5. Financials (Based on Availability)
- 11.2.19 Sovos Brands Intermediate
- 11.2.19.1. Overview
- 11.2.19.2. Products
- 11.2.19.3. SWOT Analysis
- 11.2.19.4. Recent Developments
- 11.2.19.5. Financials (Based on Availability)
- 11.2.20 Inc.
- 11.2.20.1. Overview
- 11.2.20.2. Products
- 11.2.20.3. SWOT Analysis
- 11.2.20.4. Recent Developments
- 11.2.20.5. Financials (Based on Availability)
- 11.2.21 The Coconut Collaborative
- 11.2.21.1. Overview
- 11.2.21.2. Products
- 11.2.21.3. SWOT Analysis
- 11.2.21.4. Recent Developments
- 11.2.21.5. Financials (Based on Availability)
- 11.2.22 Yofix Probiotics Ltd.
- 11.2.22.1. Overview
- 11.2.22.2. Products
- 11.2.22.3. SWOT Analysis
- 11.2.22.4. Recent Developments
- 11.2.22.5. Financials (Based on Availability)
- 11.2.23 GT's Living Foods LLC
- 11.2.23.1. Overview
- 11.2.23.2. Products
- 11.2.23.3. SWOT Analysis
- 11.2.23.4. Recent Developments
- 11.2.23.5. Financials (Based on Availability)
- 11.2.24 COYO Pty Ltd.
- 11.2.24.1. Overview
- 11.2.24.2. Products
- 11.2.24.3. SWOT Analysis
- 11.2.24.4. Recent Developments
- 11.2.24.5. Financials (Based on Availability)
- 11.2.25 Ehrmann AG
- 11.2.25.1. Overview
- 11.2.25.2. Products
- 11.2.25.3. SWOT Analysis
- 11.2.25.4. Recent Developments
- 11.2.25.5. Financials (Based on Availability)
- 11.2.26 Forager Project
- 11.2.26.1. Overview
- 11.2.26.2. Products
- 11.2.26.3. SWOT Analysis
- 11.2.26.4. Recent Developments
- 11.2.26.5. Financials (Based on Availability)
- 11.2.27 LLC
- 11.2.27.1. Overview
- 11.2.27.2. Products
- 11.2.27.3. SWOT Analysis
- 11.2.27.4. Recent Developments
- 11.2.27.5. Financials (Based on Availability)
- 11.2.28 Lancashire Farm Dairies
- 11.2.28.1. Overview
- 11.2.28.2. Products
- 11.2.28.3. SWOT Analysis
- 11.2.28.4. Recent Developments
- 11.2.28.5. Financials (Based on Availability)
- 11.2.29 Olympic Dairy Products Ltd
- 11.2.29.1. Overview
- 11.2.29.2. Products
- 11.2.29.3. SWOT Analysis
- 11.2.29.4. Recent Developments
- 11.2.29.5. Financials (Based on Availability)
- 11.2.1 Chobani
List of Figures
- Figure 1: Global Probiotic Yoghurt Revenue Breakdown (million, %) by Region 2024 & 2032
- Figure 2: North America Probiotic Yoghurt Revenue (million), by Application 2024 & 2032
- Figure 3: North America Probiotic Yoghurt Revenue Share (%), by Application 2024 & 2032
- Figure 4: North America Probiotic Yoghurt Revenue (million), by Types 2024 & 2032
- Figure 5: North America Probiotic Yoghurt Revenue Share (%), by Types 2024 & 2032
- Figure 6: North America Probiotic Yoghurt Revenue (million), by Country 2024 & 2032
- Figure 7: North America Probiotic Yoghurt Revenue Share (%), by Country 2024 & 2032
- Figure 8: South America Probiotic Yoghurt Revenue (million), by Application 2024 & 2032
- Figure 9: South America Probiotic Yoghurt Revenue Share (%), by Application 2024 & 2032
- Figure 10: South America Probiotic Yoghurt Revenue (million), by Types 2024 & 2032
- Figure 11: South America Probiotic Yoghurt Revenue Share (%), by Types 2024 & 2032
- Figure 12: South America Probiotic Yoghurt Revenue (million), by Country 2024 & 2032
- Figure 13: South America Probiotic Yoghurt Revenue Share (%), by Country 2024 & 2032
- Figure 14: Europe Probiotic Yoghurt Revenue (million), by Application 2024 & 2032
- Figure 15: Europe Probiotic Yoghurt Revenue Share (%), by Application 2024 & 2032
- Figure 16: Europe Probiotic Yoghurt Revenue (million), by Types 2024 & 2032
- Figure 17: Europe Probiotic Yoghurt Revenue Share (%), by Types 2024 & 2032
- Figure 18: Europe Probiotic Yoghurt Revenue (million), by Country 2024 & 2032
- Figure 19: Europe Probiotic Yoghurt Revenue Share (%), by Country 2024 & 2032
- Figure 20: Middle East & Africa Probiotic Yoghurt Revenue (million), by Application 2024 & 2032
- Figure 21: Middle East & Africa Probiotic Yoghurt Revenue Share (%), by Application 2024 & 2032
- Figure 22: Middle East & Africa Probiotic Yoghurt Revenue (million), by Types 2024 & 2032
- Figure 23: Middle East & Africa Probiotic Yoghurt Revenue Share (%), by Types 2024 & 2032
- Figure 24: Middle East & Africa Probiotic Yoghurt Revenue (million), by Country 2024 & 2032
- Figure 25: Middle East & Africa Probiotic Yoghurt Revenue Share (%), by Country 2024 & 2032
- Figure 26: Asia Pacific Probiotic Yoghurt Revenue (million), by Application 2024 & 2032
- Figure 27: Asia Pacific Probiotic Yoghurt Revenue Share (%), by Application 2024 & 2032
- Figure 28: Asia Pacific Probiotic Yoghurt Revenue (million), by Types 2024 & 2032
- Figure 29: Asia Pacific Probiotic Yoghurt Revenue Share (%), by Types 2024 & 2032
- Figure 30: Asia Pacific Probiotic Yoghurt Revenue (million), by Country 2024 & 2032
- Figure 31: Asia Pacific Probiotic Yoghurt Revenue Share (%), by Country 2024 & 2032
List of Tables
- Table 1: Global Probiotic Yoghurt Revenue million Forecast, by Region 2019 & 2032
- Table 2: Global Probiotic Yoghurt Revenue million Forecast, by Application 2019 & 2032
- Table 3: Global Probiotic Yoghurt Revenue million Forecast, by Types 2019 & 2032
- Table 4: Global Probiotic Yoghurt Revenue million Forecast, by Region 2019 & 2032
- Table 5: Global Probiotic Yoghurt Revenue million Forecast, by Application 2019 & 2032
- Table 6: Global Probiotic Yoghurt Revenue million Forecast, by Types 2019 & 2032
- Table 7: Global Probiotic Yoghurt Revenue million Forecast, by Country 2019 & 2032
- Table 8: United States Probiotic Yoghurt Revenue (million) Forecast, by Application 2019 & 2032
- Table 9: Canada Probiotic Yoghurt Revenue (million) Forecast, by Application 2019 & 2032
- Table 10: Mexico Probiotic Yoghurt Revenue (million) Forecast, by Application 2019 & 2032
- Table 11: Global Probiotic Yoghurt Revenue million Forecast, by Application 2019 & 2032
- Table 12: Global Probiotic Yoghurt Revenue million Forecast, by Types 2019 & 2032
- Table 13: Global Probiotic Yoghurt Revenue million Forecast, by Country 2019 & 2032
- Table 14: Brazil Probiotic Yoghurt Revenue (million) Forecast, by Application 2019 & 2032
- Table 15: Argentina Probiotic Yoghurt Revenue (million) Forecast, by Application 2019 & 2032
- Table 16: Rest of South America Probiotic Yoghurt Revenue (million) Forecast, by Application 2019 & 2032
- Table 17: Global Probiotic Yoghurt Revenue million Forecast, by Application 2019 & 2032
- Table 18: Global Probiotic Yoghurt Revenue million Forecast, by Types 2019 & 2032
- Table 19: Global Probiotic Yoghurt Revenue million Forecast, by Country 2019 & 2032
- Table 20: United Kingdom Probiotic Yoghurt Revenue (million) Forecast, by Application 2019 & 2032
- Table 21: Germany Probiotic Yoghurt Revenue (million) Forecast, by Application 2019 & 2032
- Table 22: France Probiotic Yoghurt Revenue (million) Forecast, by Application 2019 & 2032
- Table 23: Italy Probiotic Yoghurt Revenue (million) Forecast, by Application 2019 & 2032
- Table 24: Spain Probiotic Yoghurt Revenue (million) Forecast, by Application 2019 & 2032
- Table 25: Russia Probiotic Yoghurt Revenue (million) Forecast, by Application 2019 & 2032
- Table 26: Benelux Probiotic Yoghurt Revenue (million) Forecast, by Application 2019 & 2032
- Table 27: Nordics Probiotic Yoghurt Revenue (million) Forecast, by Application 2019 & 2032
- Table 28: Rest of Europe Probiotic Yoghurt Revenue (million) Forecast, by Application 2019 & 2032
- Table 29: Global Probiotic Yoghurt Revenue million Forecast, by Application 2019 & 2032
- Table 30: Global Probiotic Yoghurt Revenue million Forecast, by Types 2019 & 2032
- Table 31: Global Probiotic Yoghurt Revenue million Forecast, by Country 2019 & 2032
- Table 32: Turkey Probiotic Yoghurt Revenue (million) Forecast, by Application 2019 & 2032
- Table 33: Israel Probiotic Yoghurt Revenue (million) Forecast, by Application 2019 & 2032
- Table 34: GCC Probiotic Yoghurt Revenue (million) Forecast, by Application 2019 & 2032
- Table 35: North Africa Probiotic Yoghurt Revenue (million) Forecast, by Application 2019 & 2032
- Table 36: South Africa Probiotic Yoghurt Revenue (million) Forecast, by Application 2019 & 2032
- Table 37: Rest of Middle East & Africa Probiotic Yoghurt Revenue (million) Forecast, by Application 2019 & 2032
- Table 38: Global Probiotic Yoghurt Revenue million Forecast, by Application 2019 & 2032
- Table 39: Global Probiotic Yoghurt Revenue million Forecast, by Types 2019 & 2032
- Table 40: Global Probiotic Yoghurt Revenue million Forecast, by Country 2019 & 2032
- Table 41: China Probiotic Yoghurt Revenue (million) Forecast, by Application 2019 & 2032
- Table 42: India Probiotic Yoghurt Revenue (million) Forecast, by Application 2019 & 2032
- Table 43: Japan Probiotic Yoghurt Revenue (million) Forecast, by Application 2019 & 2032
- Table 44: South Korea Probiotic Yoghurt Revenue (million) Forecast, by Application 2019 & 2032
- Table 45: ASEAN Probiotic Yoghurt Revenue (million) Forecast, by Application 2019 & 2032
- Table 46: Oceania Probiotic Yoghurt Revenue (million) Forecast, by Application 2019 & 2032
- Table 47: Rest of Asia Pacific Probiotic Yoghurt Revenue (million) Forecast, by Application 2019 & 2032
Frequently Asked Questions
1. What is the projected Compound Annual Growth Rate (CAGR) of the Probiotic Yoghurt?
The projected CAGR is approximately XX%.
2. Which companies are prominent players in the Probiotic Yoghurt?
Key companies in the market include Chobani, Fage Yogurt, Lactalis, Noosa, Danone S.A., General Mills, Inc., Nestlé S.A., Fonterra Co-operative Group Limited, Mother Dairy Fruit & Vegetable Pvt Ltd., Meiji Holdings Company, Ltd., Chobani LLC, FAGE International S.A., Good Karma Foods, Inc., Inner Mongolia Yili Industrial Group Co., Ltd., Sovos Brands Intermediate, Inc., The Coconut Collaborative, Yofix Probiotics Ltd., GT's Living Foods LLC, COYO Pty Ltd., Ehrmann AG, Forager Project, LLC, Lancashire Farm Dairies, Olympic Dairy Products Ltd.
3. What are the main segments of the Probiotic Yoghurt?
The market segments include Application, Types.
4. Can you provide details about the market size?
The market size is estimated to be USD XXX million as of 2022.
5. What are some drivers contributing to market growth?
N/A
6. What are the notable trends driving market growth?
N/A
7. Are there any restraints impacting market growth?
N/A
8. Can you provide examples of recent developments in the market?
N/A
9. What pricing options are available for accessing the report?
Pricing options include single-user, multi-user, and enterprise licenses priced at USD 2900.00, USD 4350.00, and USD 5800.00 respectively.
10. Is the market size provided in terms of value or volume?
The market size is provided in terms of value, measured in million.
11. Are there any specific market keywords associated with the report?
Yes, the market keyword associated with the report is "Probiotic Yoghurt," which aids in identifying and referencing the specific market segment covered.
12. How do I determine which pricing option suits my needs best?
The pricing options vary based on user requirements and access needs. Individual users may opt for single-user licenses, while businesses requiring broader access may choose multi-user or enterprise licenses for cost-effective access to the report.
13. Are there any additional resources or data provided in the Probiotic Yoghurt report?
While the report offers comprehensive insights, it's advisable to review the specific contents or supplementary materials provided to ascertain if additional resources or data are available.
14. How can I stay updated on further developments or reports in the Probiotic Yoghurt?
To stay informed about further developments, trends, and reports in the Probiotic Yoghurt, consider subscribing to industry newsletters, following relevant companies and organizations, or regularly checking reputable industry news sources and publications.
Methodology
Step 1 - Identification of Relevant Samples Size from Population Database


Step 2 - Approaches for Defining Global Market Size (Value, Volume* & Price*)

Note*: In applicable scenarios
Step 3 - Data Sources
Primary Research
- Web Analytics
- Survey Reports
- Research Institute
- Latest Research Reports
- Opinion Leaders
Secondary Research
- Annual Reports
- White Paper
- Latest Press Release
- Industry Association
- Paid Database
- Investor Presentations

Step 4 - Data Triangulation
Involves using different sources of information in order to increase the validity of a study
These sources are likely to be stakeholders in a program - participants, other researchers, program staff, other community members, and so on.
Then we put all data in single framework & apply various statistical tools to find out the dynamic on the market.
During the analysis stage, feedback from the stakeholder groups would be compared to determine areas of agreement as well as areas of divergence
