

Key Insights
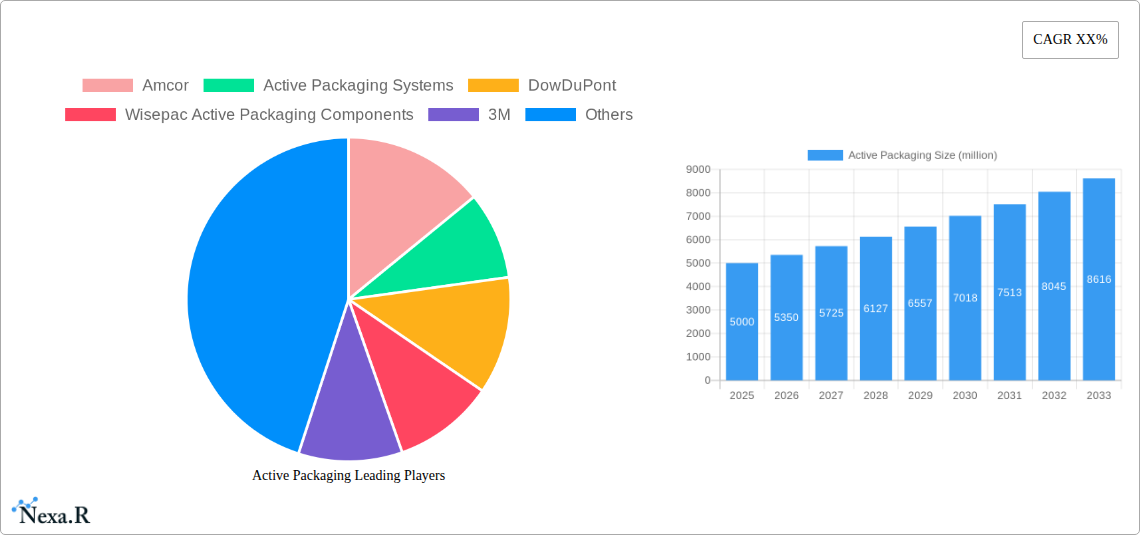
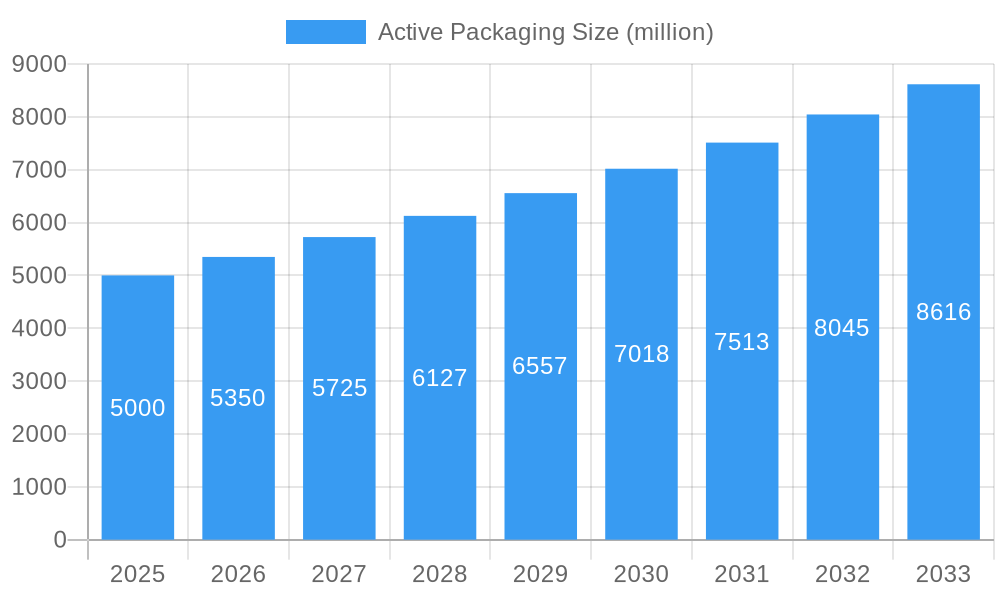
The active packaging market is experiencing robust growth, driven by increasing consumer demand for extended shelf life, improved food safety, and enhanced product quality. The market's expansion is fueled by several key trends, including the rising adoption of intelligent packaging incorporating sensors and indicators to monitor product freshness and condition. This is particularly prevalent in the food and beverage sector, where maintaining quality and minimizing waste are paramount. Furthermore, the growing e-commerce sector and its associated need for tamper-evident and secure packaging are significantly contributing to market growth. The rising prevalence of chronic diseases and the consequent demand for healthier, better-preserved food products are further bolstering market expansion. While challenges like the relatively high cost of active packaging compared to conventional methods and potential regulatory hurdles exist, the overall market outlook remains positive. We estimate the 2025 market size to be around $5 billion, based on reasonable extrapolation of industry data and considering the strong growth drivers mentioned above. A compound annual growth rate (CAGR) of 7% is projected for the forecast period (2025-2033), leading to a significant market expansion by 2033. Major players such as Amcor, DowDuPont, and 3M are actively involved in research and development, driving innovation and competition within the sector. Segmentation within the market is primarily based on packaging type (e.g., films, pouches, bottles), application (e.g., food & beverage, pharmaceuticals, healthcare), and technology (e.g., oxygen absorbers, moisture scavengers, antimicrobial agents). Regional growth is expected to be diverse, with developed markets exhibiting steady growth and emerging economies showing higher growth rates due to increasing disposable incomes and changing consumer preferences.
Active Packaging Market Size (In Billion)
The competitive landscape is characterized by a mix of large multinational corporations and specialized active packaging providers. Strategic collaborations, mergers, and acquisitions are common, as companies seek to expand their product portfolios and market reach. Innovation in materials science and packaging technology is critical for sustained market growth, particularly in developing sustainable and eco-friendly active packaging solutions. The focus is increasingly on reducing the environmental impact through biodegradable and compostable materials, aligning with growing consumer and regulatory concerns regarding sustainability. Overall, the active packaging market presents a significant opportunity for companies that can successfully meet the evolving demands of consumers and the industry's sustainability goals. Continued technological advancements and innovative packaging solutions are crucial for capturing the market's potential and driving future growth.
Active Packaging Company Market Share
Active Packaging Market Report: 2019-2033 Forecast
This comprehensive report delivers an in-depth analysis of the active packaging market, encompassing market dynamics, growth trends, regional dominance, product landscape, challenges, opportunities, key players, and future outlook. The report covers the period 2019-2033, with a focus on the 2025-2033 forecast period. The study utilizes data from the historical period (2019-2024) and considers 2025 as the base year. The market is segmented by [Insert Segments Here - e.g., Material Type, Application, Packaging Type] and further analyzed across various regions. This report is essential for industry professionals, investors, and strategic decision-makers seeking a clear understanding of this dynamic market. Market values are presented in million units.
Active Packaging Market Dynamics & Structure
The active packaging market is characterized by moderate concentration, with key players like Amcor, Amcor, DowDuPont, 3M, BASF Corporation, and others holding significant market share. However, the emergence of innovative startups and smaller players is increasing competition. Technological advancements, particularly in sensor technology and material science, are driving market growth. Regulatory frameworks concerning food safety and environmental sustainability are influencing packaging choices. The market witnesses continuous innovation in material science with a focus on improved barrier properties and functionalities. Substitutes like traditional passive packaging continue to pose a competitive threat, but the increasing demand for extended shelf life and improved product quality is driving adoption of active packaging. Mergers and acquisitions (M&A) activity is expected to remain moderate, with larger companies consolidating their positions and acquiring smaller innovative businesses.
- Market Concentration: Moderately concentrated, with top 5 players holding approximately xx% market share in 2025.
- Technological Innovation: Focus on intelligent packaging (IP), sensors, and biodegradable materials.
- Regulatory Framework: Stringent food safety regulations and increasing focus on sustainability.
- Competitive Substitutes: Traditional passive packaging.
- M&A Activity: xx deals predicted in the forecast period, primarily driven by consolidation and technology acquisition.
- Innovation Barriers: High R&D costs and challenges in scaling up production.
Active Packaging Growth Trends & Insights
The global active packaging market is witnessing substantial growth, driven by increasing consumer demand for extended shelf life, enhanced product quality, and improved food safety. The market size is estimated at xx million units in 2025 and is projected to reach xx million units by 2033, exhibiting a CAGR of xx%. This growth is fueled by technological advancements such as the integration of sensors and smart packaging features, allowing for real-time monitoring of product conditions. Changing consumer preferences, particularly a heightened awareness of food waste and sustainability, are contributing to the adoption of active packaging solutions that extend shelf life and minimize spoilage. The penetration rate of active packaging is currently at xx% and is projected to increase to xx% by 2033. Technological disruptions, including the development of biodegradable and compostable active packaging, are further propelling market expansion.
Dominant Regions, Countries, or Segments in Active Packaging
North America currently dominates the active packaging market, driven by high consumer disposable income and stringent food safety regulations. However, Asia Pacific is projected to exhibit the highest growth rate during the forecast period, fueled by increasing urbanization, rising food consumption, and rapid economic expansion. Europe is also a significant market with a mature active packaging industry. The food and beverage segment holds the largest market share, followed by pharmaceuticals and healthcare.
- North America: High adoption rates, stringent regulations, and strong consumer demand.
- Asia Pacific: Rapid growth potential driven by rising disposable income and urbanization.
- Europe: Mature market with high consumer awareness of food safety and sustainability.
- Food and Beverage: Dominant segment due to extended shelf life benefits.
- Pharmaceuticals and Healthcare: Increasing demand for tamper-evident and drug-delivery systems.
Active Packaging Product Landscape
The active packaging product landscape is characterized by a wide range of innovations focusing on improved functionality, sustainability, and convenience. These include oxygen scavengers, moisture absorbers, and antimicrobial agents incorporated into various packaging materials. Recent advancements include the development of self-healing packaging, intelligent labels providing real-time product information, and eco-friendly biodegradable materials. Unique selling propositions include extended shelf life, improved product freshness, enhanced safety, and reduced food waste.
Key Drivers, Barriers & Challenges in Active Packaging
Key Drivers:
- Increasing demand for extended shelf life and improved food safety.
- Growing consumer awareness of sustainability and environmental concerns.
- Technological advancements in sensor technology, material science, and smart packaging.
- Stringent government regulations promoting food safety and reducing food waste.
Key Barriers and Challenges:
- High initial investment costs associated with adopting new technologies and materials.
- Complexity in integrating active packaging components into existing supply chains.
- Potential compatibility issues with certain food products.
- Regulatory hurdles and stringent testing requirements in specific regions. The regulatory landscape can vary significantly, impacting cost and time-to-market for new products.
Emerging Opportunities in Active Packaging
Emerging opportunities in the active packaging market include the development of biodegradable and compostable materials, integration of smart packaging features such as sensors and RFID tags, and expanding into niche markets such as pharmaceuticals and cosmetics. Untapped markets in developing economies, particularly in Africa and South America, offer significant growth potential. The demand for sustainable active packaging, made from renewable resources and designed for easy recycling or composting, is a major growth driver.
Growth Accelerators in the Active Packaging Industry
Technological breakthroughs in material science and sensor technology are crucial catalysts driving long-term growth. Strategic partnerships between packaging manufacturers, material suppliers, and technology providers are essential for innovation and market penetration. The expansion into new applications and markets, coupled with a focus on sustainability, will be vital for achieving sustained growth in the active packaging industry.
Key Players Shaping the Active Packaging Market
- Amcor
- Active Packaging Systems
- DowDuPont
- Wisepac Active Packaging Components
- 3M
- BASF Corporation
- Active Packaging
- Intelligent Packaging (IP)
- Air Products and Chemicals
Notable Milestones in Active Packaging Sector
- 2020: Launch of biodegradable active packaging by [Company Name].
- 2021: Acquisition of [Company A] by [Company B], expanding market reach.
- 2022: Introduction of smart packaging with integrated sensors by [Company Name].
- 2023: Increased regulatory scrutiny on certain active packaging materials.
- 2024: Successful commercialization of compostable active packaging.
In-Depth Active Packaging Market Outlook
The active packaging market is poised for significant growth over the forecast period, driven by ongoing technological advancements, rising consumer demand for extended shelf life, and increasing focus on sustainability. Strategic partnerships and investments in research and development will be key to unlocking the market's full potential. The development of innovative and sustainable active packaging solutions will be crucial for continued growth and market leadership.
Active Packaging Segmentation
-
1. Application
- 1.1. Food & Beverage
- 1.2. Medical Industry
- 1.3. Others
-
2. Types
- 2.1. Antibiosis Type
- 2.2. Oxygen Control Type
- 2.3. Others
Active Packaging Segmentation By Geography
-
1. North America
- 1.1. United States
- 1.2. Canada
- 1.3. Mexico
-
2. South America
- 2.1. Brazil
- 2.2. Argentina
- 2.3. Rest of South America
-
3. Europe
- 3.1. United Kingdom
- 3.2. Germany
- 3.3. France
- 3.4. Italy
- 3.5. Spain
- 3.6. Russia
- 3.7. Benelux
- 3.8. Nordics
- 3.9. Rest of Europe
-
4. Middle East & Africa
- 4.1. Turkey
- 4.2. Israel
- 4.3. GCC
- 4.4. North Africa
- 4.5. South Africa
- 4.6. Rest of Middle East & Africa
-
5. Asia Pacific
- 5.1. China
- 5.2. India
- 5.3. Japan
- 5.4. South Korea
- 5.5. ASEAN
- 5.6. Oceania
- 5.7. Rest of Asia Pacific

Active Packaging Regional Market Share
Geographic Coverage of Active Packaging
Active Packaging REPORT HIGHLIGHTS
| Aspects | Details |
|---|---|
| Study Period | 2020-2034 |
| Base Year | 2025 |
| Estimated Year | 2026 |
| Forecast Period | 2026-2034 |
| Historical Period | 2020-2025 |
| Growth Rate | CAGR of 7.5% from 2020-2034 |
| Segmentation |
|
Table of Contents
- 1. Introduction
- 1.1. Research Scope
- 1.2. Market Segmentation
- 1.3. Research Methodology
- 1.4. Definitions and Assumptions
- 2. Executive Summary
- 2.1. Introduction
- 3. Market Dynamics
- 3.1. Introduction
- 3.2. Market Drivers
- 3.3. Market Restrains
- 3.4. Market Trends
- 4. Market Factor Analysis
- 4.1. Porters Five Forces
- 4.2. Supply/Value Chain
- 4.3. PESTEL analysis
- 4.4. Market Entropy
- 4.5. Patent/Trademark Analysis
- 5. Global Active Packaging Analysis, Insights and Forecast, 2020-2032
- 5.1. Market Analysis, Insights and Forecast - by Application
- 5.1.1. Food & Beverage
- 5.1.2. Medical Industry
- 5.1.3. Others
- 5.2. Market Analysis, Insights and Forecast - by Types
- 5.2.1. Antibiosis Type
- 5.2.2. Oxygen Control Type
- 5.2.3. Others
- 5.3. Market Analysis, Insights and Forecast - by Region
- 5.3.1. North America
- 5.3.2. South America
- 5.3.3. Europe
- 5.3.4. Middle East & Africa
- 5.3.5. Asia Pacific
- 5.1. Market Analysis, Insights and Forecast - by Application
- 6. North America Active Packaging Analysis, Insights and Forecast, 2020-2032
- 6.1. Market Analysis, Insights and Forecast - by Application
- 6.1.1. Food & Beverage
- 6.1.2. Medical Industry
- 6.1.3. Others
- 6.2. Market Analysis, Insights and Forecast - by Types
- 6.2.1. Antibiosis Type
- 6.2.2. Oxygen Control Type
- 6.2.3. Others
- 6.1. Market Analysis, Insights and Forecast - by Application
- 7. South America Active Packaging Analysis, Insights and Forecast, 2020-2032
- 7.1. Market Analysis, Insights and Forecast - by Application
- 7.1.1. Food & Beverage
- 7.1.2. Medical Industry
- 7.1.3. Others
- 7.2. Market Analysis, Insights and Forecast - by Types
- 7.2.1. Antibiosis Type
- 7.2.2. Oxygen Control Type
- 7.2.3. Others
- 7.1. Market Analysis, Insights and Forecast - by Application
- 8. Europe Active Packaging Analysis, Insights and Forecast, 2020-2032
- 8.1. Market Analysis, Insights and Forecast - by Application
- 8.1.1. Food & Beverage
- 8.1.2. Medical Industry
- 8.1.3. Others
- 8.2. Market Analysis, Insights and Forecast - by Types
- 8.2.1. Antibiosis Type
- 8.2.2. Oxygen Control Type
- 8.2.3. Others
- 8.1. Market Analysis, Insights and Forecast - by Application
- 9. Middle East & Africa Active Packaging Analysis, Insights and Forecast, 2020-2032
- 9.1. Market Analysis, Insights and Forecast - by Application
- 9.1.1. Food & Beverage
- 9.1.2. Medical Industry
- 9.1.3. Others
- 9.2. Market Analysis, Insights and Forecast - by Types
- 9.2.1. Antibiosis Type
- 9.2.2. Oxygen Control Type
- 9.2.3. Others
- 9.1. Market Analysis, Insights and Forecast - by Application
- 10. Asia Pacific Active Packaging Analysis, Insights and Forecast, 2020-2032
- 10.1. Market Analysis, Insights and Forecast - by Application
- 10.1.1. Food & Beverage
- 10.1.2. Medical Industry
- 10.1.3. Others
- 10.2. Market Analysis, Insights and Forecast - by Types
- 10.2.1. Antibiosis Type
- 10.2.2. Oxygen Control Type
- 10.2.3. Others
- 10.1. Market Analysis, Insights and Forecast - by Application
- 11. Competitive Analysis
- 11.1. Global Market Share Analysis 2025
- 11.2. Company Profiles
- 11.2.1 Amcor
- 11.2.1.1. Overview
- 11.2.1.2. Products
- 11.2.1.3. SWOT Analysis
- 11.2.1.4. Recent Developments
- 11.2.1.5. Financials (Based on Availability)
- 11.2.2 Active Packaging Systems
- 11.2.2.1. Overview
- 11.2.2.2. Products
- 11.2.2.3. SWOT Analysis
- 11.2.2.4. Recent Developments
- 11.2.2.5. Financials (Based on Availability)
- 11.2.3 DowDuPont
- 11.2.3.1. Overview
- 11.2.3.2. Products
- 11.2.3.3. SWOT Analysis
- 11.2.3.4. Recent Developments
- 11.2.3.5. Financials (Based on Availability)
- 11.2.4 Wisepac Active Packaging Components
- 11.2.4.1. Overview
- 11.2.4.2. Products
- 11.2.4.3. SWOT Analysis
- 11.2.4.4. Recent Developments
- 11.2.4.5. Financials (Based on Availability)
- 11.2.5 3M
- 11.2.5.1. Overview
- 11.2.5.2. Products
- 11.2.5.3. SWOT Analysis
- 11.2.5.4. Recent Developments
- 11.2.5.5. Financials (Based on Availability)
- 11.2.6 BASF Corporation
- 11.2.6.1. Overview
- 11.2.6.2. Products
- 11.2.6.3. SWOT Analysis
- 11.2.6.4. Recent Developments
- 11.2.6.5. Financials (Based on Availability)
- 11.2.7 Active Packaging
- 11.2.7.1. Overview
- 11.2.7.2. Products
- 11.2.7.3. SWOT Analysis
- 11.2.7.4. Recent Developments
- 11.2.7.5. Financials (Based on Availability)
- 11.2.8 Intelligent Packaging (IP)
- 11.2.8.1. Overview
- 11.2.8.2. Products
- 11.2.8.3. SWOT Analysis
- 11.2.8.4. Recent Developments
- 11.2.8.5. Financials (Based on Availability)
- 11.2.9 Air Products and Chemicals
- 11.2.9.1. Overview
- 11.2.9.2. Products
- 11.2.9.3. SWOT Analysis
- 11.2.9.4. Recent Developments
- 11.2.9.5. Financials (Based on Availability)
- 11.2.1 Amcor
List of Figures
- Figure 1: Global Active Packaging Revenue Breakdown (undefined, %) by Region 2025 & 2033
- Figure 2: North America Active Packaging Revenue (undefined), by Application 2025 & 2033
- Figure 3: North America Active Packaging Revenue Share (%), by Application 2025 & 2033
- Figure 4: North America Active Packaging Revenue (undefined), by Types 2025 & 2033
- Figure 5: North America Active Packaging Revenue Share (%), by Types 2025 & 2033
- Figure 6: North America Active Packaging Revenue (undefined), by Country 2025 & 2033
- Figure 7: North America Active Packaging Revenue Share (%), by Country 2025 & 2033
- Figure 8: South America Active Packaging Revenue (undefined), by Application 2025 & 2033
- Figure 9: South America Active Packaging Revenue Share (%), by Application 2025 & 2033
- Figure 10: South America Active Packaging Revenue (undefined), by Types 2025 & 2033
- Figure 11: South America Active Packaging Revenue Share (%), by Types 2025 & 2033
- Figure 12: South America Active Packaging Revenue (undefined), by Country 2025 & 2033
- Figure 13: South America Active Packaging Revenue Share (%), by Country 2025 & 2033
- Figure 14: Europe Active Packaging Revenue (undefined), by Application 2025 & 2033
- Figure 15: Europe Active Packaging Revenue Share (%), by Application 2025 & 2033
- Figure 16: Europe Active Packaging Revenue (undefined), by Types 2025 & 2033
- Figure 17: Europe Active Packaging Revenue Share (%), by Types 2025 & 2033
- Figure 18: Europe Active Packaging Revenue (undefined), by Country 2025 & 2033
- Figure 19: Europe Active Packaging Revenue Share (%), by Country 2025 & 2033
- Figure 20: Middle East & Africa Active Packaging Revenue (undefined), by Application 2025 & 2033
- Figure 21: Middle East & Africa Active Packaging Revenue Share (%), by Application 2025 & 2033
- Figure 22: Middle East & Africa Active Packaging Revenue (undefined), by Types 2025 & 2033
- Figure 23: Middle East & Africa Active Packaging Revenue Share (%), by Types 2025 & 2033
- Figure 24: Middle East & Africa Active Packaging Revenue (undefined), by Country 2025 & 2033
- Figure 25: Middle East & Africa Active Packaging Revenue Share (%), by Country 2025 & 2033
- Figure 26: Asia Pacific Active Packaging Revenue (undefined), by Application 2025 & 2033
- Figure 27: Asia Pacific Active Packaging Revenue Share (%), by Application 2025 & 2033
- Figure 28: Asia Pacific Active Packaging Revenue (undefined), by Types 2025 & 2033
- Figure 29: Asia Pacific Active Packaging Revenue Share (%), by Types 2025 & 2033
- Figure 30: Asia Pacific Active Packaging Revenue (undefined), by Country 2025 & 2033
- Figure 31: Asia Pacific Active Packaging Revenue Share (%), by Country 2025 & 2033
List of Tables
- Table 1: Global Active Packaging Revenue undefined Forecast, by Application 2020 & 2033
- Table 2: Global Active Packaging Revenue undefined Forecast, by Types 2020 & 2033
- Table 3: Global Active Packaging Revenue undefined Forecast, by Region 2020 & 2033
- Table 4: Global Active Packaging Revenue undefined Forecast, by Application 2020 & 2033
- Table 5: Global Active Packaging Revenue undefined Forecast, by Types 2020 & 2033
- Table 6: Global Active Packaging Revenue undefined Forecast, by Country 2020 & 2033
- Table 7: United States Active Packaging Revenue (undefined) Forecast, by Application 2020 & 2033
- Table 8: Canada Active Packaging Revenue (undefined) Forecast, by Application 2020 & 2033
- Table 9: Mexico Active Packaging Revenue (undefined) Forecast, by Application 2020 & 2033
- Table 10: Global Active Packaging Revenue undefined Forecast, by Application 2020 & 2033
- Table 11: Global Active Packaging Revenue undefined Forecast, by Types 2020 & 2033
- Table 12: Global Active Packaging Revenue undefined Forecast, by Country 2020 & 2033
- Table 13: Brazil Active Packaging Revenue (undefined) Forecast, by Application 2020 & 2033
- Table 14: Argentina Active Packaging Revenue (undefined) Forecast, by Application 2020 & 2033
- Table 15: Rest of South America Active Packaging Revenue (undefined) Forecast, by Application 2020 & 2033
- Table 16: Global Active Packaging Revenue undefined Forecast, by Application 2020 & 2033
- Table 17: Global Active Packaging Revenue undefined Forecast, by Types 2020 & 2033
- Table 18: Global Active Packaging Revenue undefined Forecast, by Country 2020 & 2033
- Table 19: United Kingdom Active Packaging Revenue (undefined) Forecast, by Application 2020 & 2033
- Table 20: Germany Active Packaging Revenue (undefined) Forecast, by Application 2020 & 2033
- Table 21: France Active Packaging Revenue (undefined) Forecast, by Application 2020 & 2033
- Table 22: Italy Active Packaging Revenue (undefined) Forecast, by Application 2020 & 2033
- Table 23: Spain Active Packaging Revenue (undefined) Forecast, by Application 2020 & 2033
- Table 24: Russia Active Packaging Revenue (undefined) Forecast, by Application 2020 & 2033
- Table 25: Benelux Active Packaging Revenue (undefined) Forecast, by Application 2020 & 2033
- Table 26: Nordics Active Packaging Revenue (undefined) Forecast, by Application 2020 & 2033
- Table 27: Rest of Europe Active Packaging Revenue (undefined) Forecast, by Application 2020 & 2033
- Table 28: Global Active Packaging Revenue undefined Forecast, by Application 2020 & 2033
- Table 29: Global Active Packaging Revenue undefined Forecast, by Types 2020 & 2033
- Table 30: Global Active Packaging Revenue undefined Forecast, by Country 2020 & 2033
- Table 31: Turkey Active Packaging Revenue (undefined) Forecast, by Application 2020 & 2033
- Table 32: Israel Active Packaging Revenue (undefined) Forecast, by Application 2020 & 2033
- Table 33: GCC Active Packaging Revenue (undefined) Forecast, by Application 2020 & 2033
- Table 34: North Africa Active Packaging Revenue (undefined) Forecast, by Application 2020 & 2033
- Table 35: South Africa Active Packaging Revenue (undefined) Forecast, by Application 2020 & 2033
- Table 36: Rest of Middle East & Africa Active Packaging Revenue (undefined) Forecast, by Application 2020 & 2033
- Table 37: Global Active Packaging Revenue undefined Forecast, by Application 2020 & 2033
- Table 38: Global Active Packaging Revenue undefined Forecast, by Types 2020 & 2033
- Table 39: Global Active Packaging Revenue undefined Forecast, by Country 2020 & 2033
- Table 40: China Active Packaging Revenue (undefined) Forecast, by Application 2020 & 2033
- Table 41: India Active Packaging Revenue (undefined) Forecast, by Application 2020 & 2033
- Table 42: Japan Active Packaging Revenue (undefined) Forecast, by Application 2020 & 2033
- Table 43: South Korea Active Packaging Revenue (undefined) Forecast, by Application 2020 & 2033
- Table 44: ASEAN Active Packaging Revenue (undefined) Forecast, by Application 2020 & 2033
- Table 45: Oceania Active Packaging Revenue (undefined) Forecast, by Application 2020 & 2033
- Table 46: Rest of Asia Pacific Active Packaging Revenue (undefined) Forecast, by Application 2020 & 2033
Frequently Asked Questions
1. What is the projected Compound Annual Growth Rate (CAGR) of the Active Packaging?
The projected CAGR is approximately 7.5%.
2. Which companies are prominent players in the Active Packaging?
Key companies in the market include Amcor, Active Packaging Systems, DowDuPont, Wisepac Active Packaging Components, 3M, BASF Corporation, Active Packaging, Intelligent Packaging (IP), Air Products and Chemicals.
3. What are the main segments of the Active Packaging?
The market segments include Application, Types.
4. Can you provide details about the market size?
The market size is estimated to be USD XXX N/A as of 2022.
5. What are some drivers contributing to market growth?
N/A
6. What are the notable trends driving market growth?
N/A
7. Are there any restraints impacting market growth?
N/A
8. Can you provide examples of recent developments in the market?
N/A
9. What pricing options are available for accessing the report?
Pricing options include single-user, multi-user, and enterprise licenses priced at USD 3350.00, USD 5025.00, and USD 6700.00 respectively.
10. Is the market size provided in terms of value or volume?
The market size is provided in terms of value, measured in N/A.
11. Are there any specific market keywords associated with the report?
Yes, the market keyword associated with the report is "Active Packaging," which aids in identifying and referencing the specific market segment covered.
12. How do I determine which pricing option suits my needs best?
The pricing options vary based on user requirements and access needs. Individual users may opt for single-user licenses, while businesses requiring broader access may choose multi-user or enterprise licenses for cost-effective access to the report.
13. Are there any additional resources or data provided in the Active Packaging report?
While the report offers comprehensive insights, it's advisable to review the specific contents or supplementary materials provided to ascertain if additional resources or data are available.
14. How can I stay updated on further developments or reports in the Active Packaging?
To stay informed about further developments, trends, and reports in the Active Packaging, consider subscribing to industry newsletters, following relevant companies and organizations, or regularly checking reputable industry news sources and publications.
Methodology
Step 1 - Identification of Relevant Samples Size from Population Database


Step 2 - Approaches for Defining Global Market Size (Value, Volume* & Price*)

Note*: In applicable scenarios
Step 3 - Data Sources
Primary Research
- Web Analytics
- Survey Reports
- Research Institute
- Latest Research Reports
- Opinion Leaders
Secondary Research
- Annual Reports
- White Paper
- Latest Press Release
- Industry Association
- Paid Database
- Investor Presentations

Step 4 - Data Triangulation
Involves using different sources of information in order to increase the validity of a study
These sources are likely to be stakeholders in a program - participants, other researchers, program staff, other community members, and so on.
Then we put all data in single framework & apply various statistical tools to find out the dynamic on the market.
During the analysis stage, feedback from the stakeholder groups would be compared to determine areas of agreement as well as areas of divergence