

Key Insights
The global anti-counterfeit plastic caps and closures market is poised for significant expansion, driven by escalating concerns regarding product authenticity and brand integrity across diverse industries. The market's growth is propelled by the pervasive issue of counterfeit goods, which undermine brand reputation and erode consumer confidence. Sectors such as pharmaceuticals, food and beverages, and personal care are particularly vulnerable, underscoring the critical role of anti-counterfeit packaging. Key growth catalysts include technological advancements in security features, including RFID tags, tamper-evident seals, and unique identification codes embedded in closures. Stringent regulatory mandates and heightened consumer awareness concerning counterfeiting further contribute to market momentum. The market is projected to reach approximately $176.5 billion by 2033, exhibiting a Compound Annual Growth Rate (CAGR) of 4.9%, with a base year of 2025.
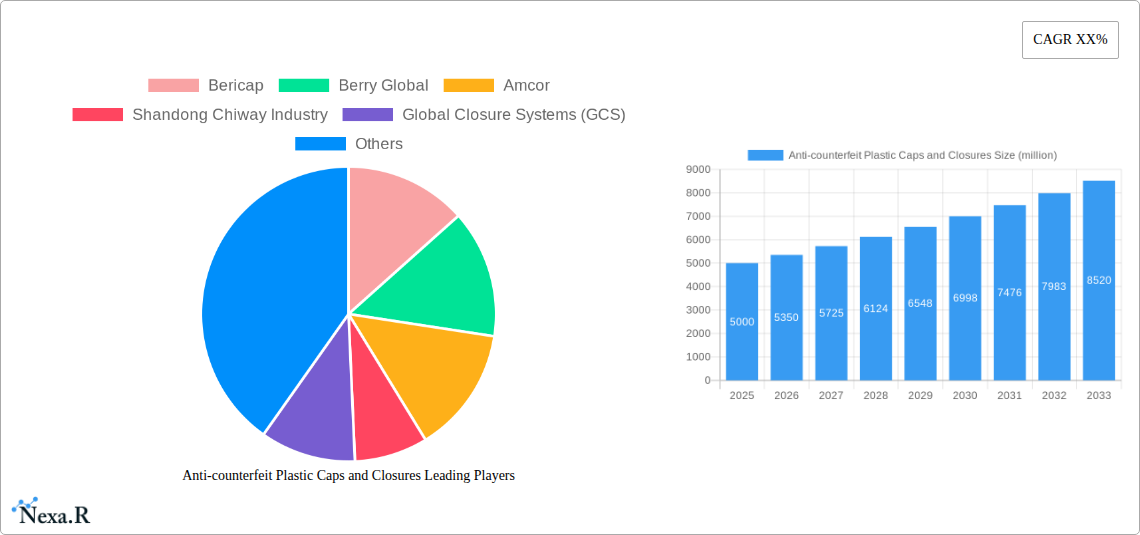
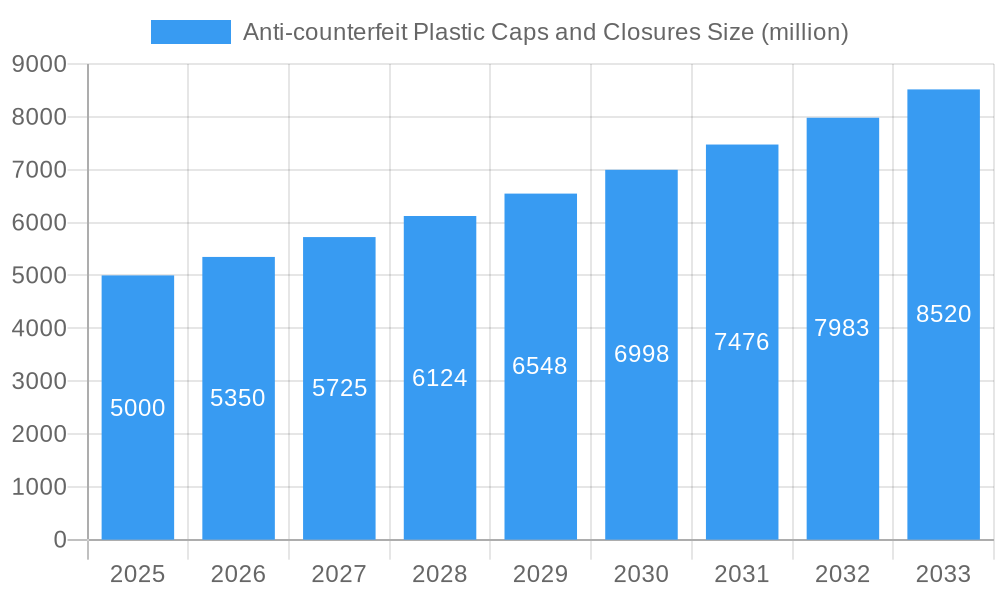
Anti-counterfeit Plastic Caps and Closures Market Size (In Billion)
Leading market participants, including Bericap, Berry Global, and Amcor, are actively expanding their market presence by leveraging robust manufacturing capabilities and pioneering product innovations to address the escalating demand.
Anti-counterfeit Plastic Caps and Closures Company Market Share
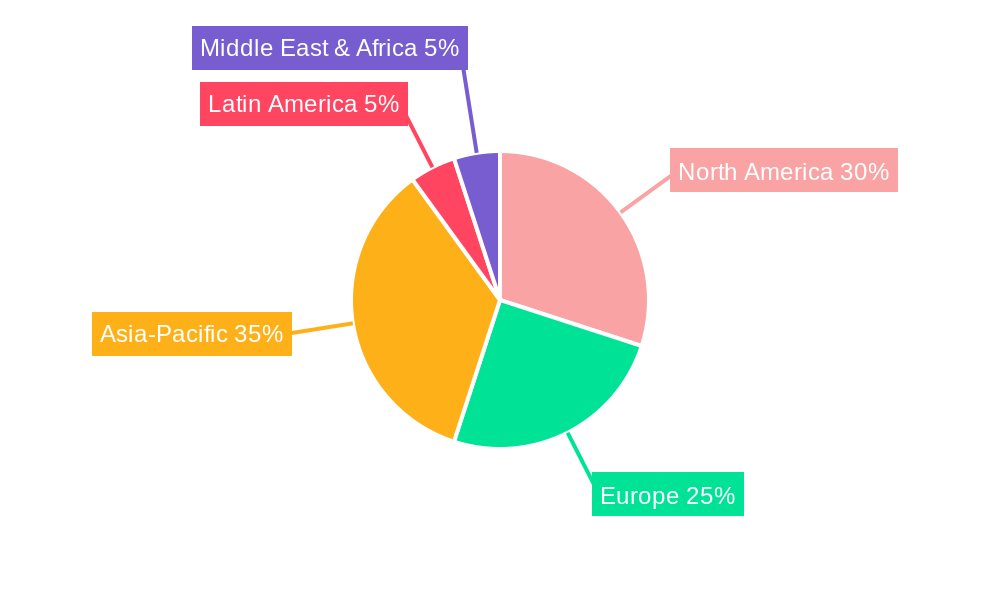
Significant regional disparities are observed, with mature markets like North America and Europe exhibiting accelerated adoption rates attributed to stringent regulatory environments and elevated consumer awareness. Conversely, emerging economies present substantial growth opportunities, spurred by rising disposable incomes and an increasing demand for branded products. Market challenges encompass the substantial initial investment required for advanced anti-counterfeit technologies, the potential for the circumvention of security features, and the necessity for seamless integration throughout the supply chain. Notwithstanding these obstacles, the long-term outlook for the anti-counterfeit plastic caps and closures market remains robust, supported by ongoing innovation and an unwavering demand for effective brand protection strategies.
Anti-counterfeit Plastic Caps and Closures Market Report: 2019-2033
This comprehensive report provides a detailed analysis of the global anti-counterfeit plastic caps and closures market, encompassing market dynamics, growth trends, regional insights, product landscape, and future outlook. The study period covers 2019-2033, with a base year of 2025 and a forecast period of 2025-2033. This report is invaluable for industry professionals, investors, and strategic decision-makers seeking a deep understanding of this rapidly evolving market. The market is segmented by material type, application, and region, offering granular insights into key growth drivers and challenges.
Anti-counterfeit Plastic Caps and Closures Market Dynamics & Structure
The global anti-counterfeit plastic caps and closures market is characterized by moderate concentration, with several key players holding significant market share. Technological innovation, driven by increasing counterfeiting concerns and evolving consumer demand for secure packaging, is a key growth driver. Stringent regulatory frameworks globally are further shaping market dynamics, pushing manufacturers towards more sophisticated anti-counterfeit solutions. While alternative closure materials exist (e.g., metal), plastic remains dominant due to its cost-effectiveness and versatility. The end-user demographics are diverse, spanning the pharmaceutical, food & beverage, and personal care industries. Mergers and acquisitions (M&A) activity has been moderate in recent years, with larger players seeking to expand their product portfolios and geographic reach.
- Market Concentration: Moderately concentrated, with the top 5 players holding approximately xx% of the market share in 2024.
- Technological Innovation: Focus on advanced technologies such as RFID, NFC, and tamper-evident seals.
- Regulatory Frameworks: Increasingly stringent regulations across various regions driving adoption of anti-counterfeit measures.
- Competitive Substitutes: Limited direct substitutes; however, alternative packaging materials present indirect competition.
- M&A Activity: An average of xx M&A deals annually during the historical period (2019-2024).
- Innovation Barriers: High R&D costs and the need for specialized expertise can hinder innovation.
Anti-counterfeit Plastic Caps and Closures Growth Trends & Insights
The global anti-counterfeit plastic caps and closures market experienced significant growth during the historical period (2019-2024), driven by increasing brand protection concerns and rising consumer awareness of counterfeit products. The market size is estimated at xx million units in 2025, and is projected to grow at a CAGR of xx% from 2025 to 2033, reaching xx million units by 2033. This growth is fueled by technological advancements leading to more sophisticated and cost-effective anti-counterfeit solutions, increasing adoption rates across various industries, and changing consumer behavior emphasizing product authenticity. The market penetration rate is expected to increase from xx% in 2025 to xx% in 2033, driven by the rising demand for secure packaging. Disruptive technologies such as blockchain integration for enhanced traceability are expected to further accelerate market growth in the forecast period.
Dominant Regions, Countries, or Segments in Anti-counterfeit Plastic Caps and Closures
The North American and European regions are currently the dominant markets for anti-counterfeit plastic caps and closures, driven by high consumer awareness, stringent regulations, and a strong presence of key players. However, the Asia-Pacific region is projected to witness the fastest growth during the forecast period, fueled by rising disposable incomes, increased demand for branded products, and a growing awareness of counterfeiting issues in developing economies such as China and India. The pharmaceutical segment is a major driver of market growth globally, due to high security requirements for drugs and medications.
- Key Drivers in North America: Stringent regulatory compliance and high consumer demand for branded products.
- Key Drivers in Europe: Strong brand protection measures and established supply chains.
- Key Drivers in Asia-Pacific: Rapid economic growth, rising middle class, and increasing counterfeiting concerns.
- Segment Dominance: Pharmaceutical segment leads the market, followed by food & beverage and personal care.
Anti-counterfeit Plastic Caps and Closures Product Landscape
The market offers a wide range of anti-counterfeit plastic caps and closures, incorporating diverse technologies such as tamper-evident seals, unique markings, specialized inks, and digital tracking systems (RFID, NFC). These solutions provide varying levels of security and traceability, catering to different industry needs and budgets. Recent innovations focus on improving ease of use, enhancing security features, and reducing environmental impact through the use of sustainable materials. Unique selling propositions include increased security, brand protection, and supply chain transparency, leading to improved consumer trust and reduced losses from counterfeiting.
Key Drivers, Barriers & Challenges in Anti-counterfeit Plastic Caps and Closures
Key Drivers: Growing consumer awareness of counterfeit products, increasing stringent regulations across various industries, technological advancements leading to more sophisticated and cost-effective solutions, and the rising demand for brand protection.
Challenges and Restraints: High initial investment costs associated with implementing anti-counterfeit technologies can pose a barrier for small and medium-sized enterprises. Supply chain complexities and the need for robust integration across the entire value chain can also impede market growth. Furthermore, the challenge of keeping ahead of counterfeiters' evolving techniques necessitates continuous innovation and adaptation within the industry. The fluctuating prices of raw materials and global economic uncertainties can also impact market growth.
Emerging Opportunities in Anti-counterfeit Plastic Caps and Closures
Emerging opportunities lie in developing sustainable and eco-friendly anti-counterfeit solutions, leveraging blockchain technology for enhanced traceability and transparency, and expanding into untapped markets in developing economies. Focus on innovative applications, such as integrating smart packaging features for consumer engagement and product authentication, holds significant potential. Addressing the increasing demand for customized anti-counterfeit solutions tailored to specific industry needs represents a significant opportunity.
Growth Accelerators in the Anti-counterfeit Plastic Caps and Closures Industry
Long-term growth in this market will be accelerated by ongoing technological breakthroughs, strategic partnerships between packaging manufacturers and technology providers, and market expansion strategies focusing on emerging economies. The development of cost-effective and user-friendly anti-counterfeit solutions will be crucial in driving widespread adoption across various industries. Strategic collaborations aimed at streamlining supply chains and enhancing regulatory compliance will also contribute significantly to long-term market growth.
Key Players Shaping the Anti-counterfeit Plastic Caps and Closures Market
- Bericap
- Berry Global
- Amcor
- Shandong Chiway Industry
- Global Closure Systems (GCS)
- GualaClosures Group
- Taiwan HonChuan Group
- Anhui Baishijia Packaging
Notable Milestones in Anti-counterfeit Plastic Caps and Closures Sector
- 2020: Introduction of a new tamper-evident closure incorporating NFC technology by Berry Global.
- 2021: Amcor launches a sustainable anti-counterfeit solution utilizing recycled materials.
- 2022: Strategic partnership between GualaClosures and a blockchain technology provider to enhance product traceability.
- 2023: Bericap introduces a new range of closures featuring enhanced security features.
In-Depth Anti-counterfeit Plastic Caps and Closures Market Outlook
The future of the anti-counterfeit plastic caps and closures market is bright, driven by continuous technological advancements, growing consumer awareness, and increasing regulatory pressures. Strategic opportunities lie in developing innovative, sustainable, and cost-effective solutions that address the evolving needs of diverse industries. The market is poised for significant growth, with increasing demand for secure packaging and enhanced brand protection in both developed and developing economies. Companies that proactively adapt to technological disruptions and focus on delivering value-added solutions are likely to succeed in this dynamic market.
Anti-counterfeit Plastic Caps and Closures Segmentation
-
1. Application
- 1.1. Alcoholic Beverages
- 1.2. Alcoholic Beverages
- 1.3. Non-Alcoholic Beverages
- 1.4. Healthcare Products
- 1.5. Personal Care Products
- 1.6. Other
-
2. Types
- 2.1. PP Caps and Closures
- 2.2. PE Caps and Closures
Anti-counterfeit Plastic Caps and Closures Segmentation By Geography
-
1. North America
- 1.1. United States
- 1.2. Canada
- 1.3. Mexico
-
2. South America
- 2.1. Brazil
- 2.2. Argentina
- 2.3. Rest of South America
-
3. Europe
- 3.1. United Kingdom
- 3.2. Germany
- 3.3. France
- 3.4. Italy
- 3.5. Spain
- 3.6. Russia
- 3.7. Benelux
- 3.8. Nordics
- 3.9. Rest of Europe
-
4. Middle East & Africa
- 4.1. Turkey
- 4.2. Israel
- 4.3. GCC
- 4.4. North Africa
- 4.5. South Africa
- 4.6. Rest of Middle East & Africa
-
5. Asia Pacific
- 5.1. China
- 5.2. India
- 5.3. Japan
- 5.4. South Korea
- 5.5. ASEAN
- 5.6. Oceania
- 5.7. Rest of Asia Pacific
Anti-counterfeit Plastic Caps and Closures Regional Market Share
Geographic Coverage of Anti-counterfeit Plastic Caps and Closures
Anti-counterfeit Plastic Caps and Closures REPORT HIGHLIGHTS
| Aspects | Details |
|---|---|
| Study Period | 2020-2034 |
| Base Year | 2025 |
| Estimated Year | 2026 |
| Forecast Period | 2026-2034 |
| Historical Period | 2020-2025 |
| Growth Rate | CAGR of 4.9% from 2020-2034 |
| Segmentation |
|
Table of Contents
- 1. Introduction
- 1.1. Research Scope
- 1.2. Market Segmentation
- 1.3. Research Methodology
- 1.4. Definitions and Assumptions
- 2. Executive Summary
- 2.1. Introduction
- 3. Market Dynamics
- 3.1. Introduction
- 3.2. Market Drivers
- 3.3. Market Restrains
- 3.4. Market Trends
- 4. Market Factor Analysis
- 4.1. Porters Five Forces
- 4.2. Supply/Value Chain
- 4.3. PESTEL analysis
- 4.4. Market Entropy
- 4.5. Patent/Trademark Analysis
- 5. Global Anti-counterfeit Plastic Caps and Closures Analysis, Insights and Forecast, 2020-2032
- 5.1. Market Analysis, Insights and Forecast - by Application
- 5.1.1. Alcoholic Beverages
- 5.1.2. Alcoholic Beverages
- 5.1.3. Non-Alcoholic Beverages
- 5.1.4. Healthcare Products
- 5.1.5. Personal Care Products
- 5.1.6. Other
- 5.2. Market Analysis, Insights and Forecast - by Types
- 5.2.1. PP Caps and Closures
- 5.2.2. PE Caps and Closures
- 5.3. Market Analysis, Insights and Forecast - by Region
- 5.3.1. North America
- 5.3.2. South America
- 5.3.3. Europe
- 5.3.4. Middle East & Africa
- 5.3.5. Asia Pacific
- 5.1. Market Analysis, Insights and Forecast - by Application
- 6. North America Anti-counterfeit Plastic Caps and Closures Analysis, Insights and Forecast, 2020-2032
- 6.1. Market Analysis, Insights and Forecast - by Application
- 6.1.1. Alcoholic Beverages
- 6.1.2. Alcoholic Beverages
- 6.1.3. Non-Alcoholic Beverages
- 6.1.4. Healthcare Products
- 6.1.5. Personal Care Products
- 6.1.6. Other
- 6.2. Market Analysis, Insights and Forecast - by Types
- 6.2.1. PP Caps and Closures
- 6.2.2. PE Caps and Closures
- 6.1. Market Analysis, Insights and Forecast - by Application
- 7. South America Anti-counterfeit Plastic Caps and Closures Analysis, Insights and Forecast, 2020-2032
- 7.1. Market Analysis, Insights and Forecast - by Application
- 7.1.1. Alcoholic Beverages
- 7.1.2. Alcoholic Beverages
- 7.1.3. Non-Alcoholic Beverages
- 7.1.4. Healthcare Products
- 7.1.5. Personal Care Products
- 7.1.6. Other
- 7.2. Market Analysis, Insights and Forecast - by Types
- 7.2.1. PP Caps and Closures
- 7.2.2. PE Caps and Closures
- 7.1. Market Analysis, Insights and Forecast - by Application
- 8. Europe Anti-counterfeit Plastic Caps and Closures Analysis, Insights and Forecast, 2020-2032
- 8.1. Market Analysis, Insights and Forecast - by Application
- 8.1.1. Alcoholic Beverages
- 8.1.2. Alcoholic Beverages
- 8.1.3. Non-Alcoholic Beverages
- 8.1.4. Healthcare Products
- 8.1.5. Personal Care Products
- 8.1.6. Other
- 8.2. Market Analysis, Insights and Forecast - by Types
- 8.2.1. PP Caps and Closures
- 8.2.2. PE Caps and Closures
- 8.1. Market Analysis, Insights and Forecast - by Application
- 9. Middle East & Africa Anti-counterfeit Plastic Caps and Closures Analysis, Insights and Forecast, 2020-2032
- 9.1. Market Analysis, Insights and Forecast - by Application
- 9.1.1. Alcoholic Beverages
- 9.1.2. Alcoholic Beverages
- 9.1.3. Non-Alcoholic Beverages
- 9.1.4. Healthcare Products
- 9.1.5. Personal Care Products
- 9.1.6. Other
- 9.2. Market Analysis, Insights and Forecast - by Types
- 9.2.1. PP Caps and Closures
- 9.2.2. PE Caps and Closures
- 9.1. Market Analysis, Insights and Forecast - by Application
- 10. Asia Pacific Anti-counterfeit Plastic Caps and Closures Analysis, Insights and Forecast, 2020-2032
- 10.1. Market Analysis, Insights and Forecast - by Application
- 10.1.1. Alcoholic Beverages
- 10.1.2. Alcoholic Beverages
- 10.1.3. Non-Alcoholic Beverages
- 10.1.4. Healthcare Products
- 10.1.5. Personal Care Products
- 10.1.6. Other
- 10.2. Market Analysis, Insights and Forecast - by Types
- 10.2.1. PP Caps and Closures
- 10.2.2. PE Caps and Closures
- 10.1. Market Analysis, Insights and Forecast - by Application
- 11. Competitive Analysis
- 11.1. Global Market Share Analysis 2025
- 11.2. Company Profiles
- 11.2.1 Bericap
- 11.2.1.1. Overview
- 11.2.1.2. Products
- 11.2.1.3. SWOT Analysis
- 11.2.1.4. Recent Developments
- 11.2.1.5. Financials (Based on Availability)
- 11.2.2 Berry Global
- 11.2.2.1. Overview
- 11.2.2.2. Products
- 11.2.2.3. SWOT Analysis
- 11.2.2.4. Recent Developments
- 11.2.2.5. Financials (Based on Availability)
- 11.2.3 Amcor
- 11.2.3.1. Overview
- 11.2.3.2. Products
- 11.2.3.3. SWOT Analysis
- 11.2.3.4. Recent Developments
- 11.2.3.5. Financials (Based on Availability)
- 11.2.4 Shandong Chiway Industry
- 11.2.4.1. Overview
- 11.2.4.2. Products
- 11.2.4.3. SWOT Analysis
- 11.2.4.4. Recent Developments
- 11.2.4.5. Financials (Based on Availability)
- 11.2.5 Global Closure Systems (GCS)
- 11.2.5.1. Overview
- 11.2.5.2. Products
- 11.2.5.3. SWOT Analysis
- 11.2.5.4. Recent Developments
- 11.2.5.5. Financials (Based on Availability)
- 11.2.6 GualaClosures Group
- 11.2.6.1. Overview
- 11.2.6.2. Products
- 11.2.6.3. SWOT Analysis
- 11.2.6.4. Recent Developments
- 11.2.6.5. Financials (Based on Availability)
- 11.2.7 Taiwan HonChuan Group
- 11.2.7.1. Overview
- 11.2.7.2. Products
- 11.2.7.3. SWOT Analysis
- 11.2.7.4. Recent Developments
- 11.2.7.5. Financials (Based on Availability)
- 11.2.8 Anhui Baishijia Packaging
- 11.2.8.1. Overview
- 11.2.8.2. Products
- 11.2.8.3. SWOT Analysis
- 11.2.8.4. Recent Developments
- 11.2.8.5. Financials (Based on Availability)
- 11.2.1 Bericap
List of Figures
- Figure 1: Global Anti-counterfeit Plastic Caps and Closures Revenue Breakdown (billion, %) by Region 2025 & 2033
- Figure 2: North America Anti-counterfeit Plastic Caps and Closures Revenue (billion), by Application 2025 & 2033
- Figure 3: North America Anti-counterfeit Plastic Caps and Closures Revenue Share (%), by Application 2025 & 2033
- Figure 4: North America Anti-counterfeit Plastic Caps and Closures Revenue (billion), by Types 2025 & 2033
- Figure 5: North America Anti-counterfeit Plastic Caps and Closures Revenue Share (%), by Types 2025 & 2033
- Figure 6: North America Anti-counterfeit Plastic Caps and Closures Revenue (billion), by Country 2025 & 2033
- Figure 7: North America Anti-counterfeit Plastic Caps and Closures Revenue Share (%), by Country 2025 & 2033
- Figure 8: South America Anti-counterfeit Plastic Caps and Closures Revenue (billion), by Application 2025 & 2033
- Figure 9: South America Anti-counterfeit Plastic Caps and Closures Revenue Share (%), by Application 2025 & 2033
- Figure 10: South America Anti-counterfeit Plastic Caps and Closures Revenue (billion), by Types 2025 & 2033
- Figure 11: South America Anti-counterfeit Plastic Caps and Closures Revenue Share (%), by Types 2025 & 2033
- Figure 12: South America Anti-counterfeit Plastic Caps and Closures Revenue (billion), by Country 2025 & 2033
- Figure 13: South America Anti-counterfeit Plastic Caps and Closures Revenue Share (%), by Country 2025 & 2033
- Figure 14: Europe Anti-counterfeit Plastic Caps and Closures Revenue (billion), by Application 2025 & 2033
- Figure 15: Europe Anti-counterfeit Plastic Caps and Closures Revenue Share (%), by Application 2025 & 2033
- Figure 16: Europe Anti-counterfeit Plastic Caps and Closures Revenue (billion), by Types 2025 & 2033
- Figure 17: Europe Anti-counterfeit Plastic Caps and Closures Revenue Share (%), by Types 2025 & 2033
- Figure 18: Europe Anti-counterfeit Plastic Caps and Closures Revenue (billion), by Country 2025 & 2033
- Figure 19: Europe Anti-counterfeit Plastic Caps and Closures Revenue Share (%), by Country 2025 & 2033
- Figure 20: Middle East & Africa Anti-counterfeit Plastic Caps and Closures Revenue (billion), by Application 2025 & 2033
- Figure 21: Middle East & Africa Anti-counterfeit Plastic Caps and Closures Revenue Share (%), by Application 2025 & 2033
- Figure 22: Middle East & Africa Anti-counterfeit Plastic Caps and Closures Revenue (billion), by Types 2025 & 2033
- Figure 23: Middle East & Africa Anti-counterfeit Plastic Caps and Closures Revenue Share (%), by Types 2025 & 2033
- Figure 24: Middle East & Africa Anti-counterfeit Plastic Caps and Closures Revenue (billion), by Country 2025 & 2033
- Figure 25: Middle East & Africa Anti-counterfeit Plastic Caps and Closures Revenue Share (%), by Country 2025 & 2033
- Figure 26: Asia Pacific Anti-counterfeit Plastic Caps and Closures Revenue (billion), by Application 2025 & 2033
- Figure 27: Asia Pacific Anti-counterfeit Plastic Caps and Closures Revenue Share (%), by Application 2025 & 2033
- Figure 28: Asia Pacific Anti-counterfeit Plastic Caps and Closures Revenue (billion), by Types 2025 & 2033
- Figure 29: Asia Pacific Anti-counterfeit Plastic Caps and Closures Revenue Share (%), by Types 2025 & 2033
- Figure 30: Asia Pacific Anti-counterfeit Plastic Caps and Closures Revenue (billion), by Country 2025 & 2033
- Figure 31: Asia Pacific Anti-counterfeit Plastic Caps and Closures Revenue Share (%), by Country 2025 & 2033
List of Tables
- Table 1: Global Anti-counterfeit Plastic Caps and Closures Revenue billion Forecast, by Application 2020 & 2033
- Table 2: Global Anti-counterfeit Plastic Caps and Closures Revenue billion Forecast, by Types 2020 & 2033
- Table 3: Global Anti-counterfeit Plastic Caps and Closures Revenue billion Forecast, by Region 2020 & 2033
- Table 4: Global Anti-counterfeit Plastic Caps and Closures Revenue billion Forecast, by Application 2020 & 2033
- Table 5: Global Anti-counterfeit Plastic Caps and Closures Revenue billion Forecast, by Types 2020 & 2033
- Table 6: Global Anti-counterfeit Plastic Caps and Closures Revenue billion Forecast, by Country 2020 & 2033
- Table 7: United States Anti-counterfeit Plastic Caps and Closures Revenue (billion) Forecast, by Application 2020 & 2033
- Table 8: Canada Anti-counterfeit Plastic Caps and Closures Revenue (billion) Forecast, by Application 2020 & 2033
- Table 9: Mexico Anti-counterfeit Plastic Caps and Closures Revenue (billion) Forecast, by Application 2020 & 2033
- Table 10: Global Anti-counterfeit Plastic Caps and Closures Revenue billion Forecast, by Application 2020 & 2033
- Table 11: Global Anti-counterfeit Plastic Caps and Closures Revenue billion Forecast, by Types 2020 & 2033
- Table 12: Global Anti-counterfeit Plastic Caps and Closures Revenue billion Forecast, by Country 2020 & 2033
- Table 13: Brazil Anti-counterfeit Plastic Caps and Closures Revenue (billion) Forecast, by Application 2020 & 2033
- Table 14: Argentina Anti-counterfeit Plastic Caps and Closures Revenue (billion) Forecast, by Application 2020 & 2033
- Table 15: Rest of South America Anti-counterfeit Plastic Caps and Closures Revenue (billion) Forecast, by Application 2020 & 2033
- Table 16: Global Anti-counterfeit Plastic Caps and Closures Revenue billion Forecast, by Application 2020 & 2033
- Table 17: Global Anti-counterfeit Plastic Caps and Closures Revenue billion Forecast, by Types 2020 & 2033
- Table 18: Global Anti-counterfeit Plastic Caps and Closures Revenue billion Forecast, by Country 2020 & 2033
- Table 19: United Kingdom Anti-counterfeit Plastic Caps and Closures Revenue (billion) Forecast, by Application 2020 & 2033
- Table 20: Germany Anti-counterfeit Plastic Caps and Closures Revenue (billion) Forecast, by Application 2020 & 2033
- Table 21: France Anti-counterfeit Plastic Caps and Closures Revenue (billion) Forecast, by Application 2020 & 2033
- Table 22: Italy Anti-counterfeit Plastic Caps and Closures Revenue (billion) Forecast, by Application 2020 & 2033
- Table 23: Spain Anti-counterfeit Plastic Caps and Closures Revenue (billion) Forecast, by Application 2020 & 2033
- Table 24: Russia Anti-counterfeit Plastic Caps and Closures Revenue (billion) Forecast, by Application 2020 & 2033
- Table 25: Benelux Anti-counterfeit Plastic Caps and Closures Revenue (billion) Forecast, by Application 2020 & 2033
- Table 26: Nordics Anti-counterfeit Plastic Caps and Closures Revenue (billion) Forecast, by Application 2020 & 2033
- Table 27: Rest of Europe Anti-counterfeit Plastic Caps and Closures Revenue (billion) Forecast, by Application 2020 & 2033
- Table 28: Global Anti-counterfeit Plastic Caps and Closures Revenue billion Forecast, by Application 2020 & 2033
- Table 29: Global Anti-counterfeit Plastic Caps and Closures Revenue billion Forecast, by Types 2020 & 2033
- Table 30: Global Anti-counterfeit Plastic Caps and Closures Revenue billion Forecast, by Country 2020 & 2033
- Table 31: Turkey Anti-counterfeit Plastic Caps and Closures Revenue (billion) Forecast, by Application 2020 & 2033
- Table 32: Israel Anti-counterfeit Plastic Caps and Closures Revenue (billion) Forecast, by Application 2020 & 2033
- Table 33: GCC Anti-counterfeit Plastic Caps and Closures Revenue (billion) Forecast, by Application 2020 & 2033
- Table 34: North Africa Anti-counterfeit Plastic Caps and Closures Revenue (billion) Forecast, by Application 2020 & 2033
- Table 35: South Africa Anti-counterfeit Plastic Caps and Closures Revenue (billion) Forecast, by Application 2020 & 2033
- Table 36: Rest of Middle East & Africa Anti-counterfeit Plastic Caps and Closures Revenue (billion) Forecast, by Application 2020 & 2033
- Table 37: Global Anti-counterfeit Plastic Caps and Closures Revenue billion Forecast, by Application 2020 & 2033
- Table 38: Global Anti-counterfeit Plastic Caps and Closures Revenue billion Forecast, by Types 2020 & 2033
- Table 39: Global Anti-counterfeit Plastic Caps and Closures Revenue billion Forecast, by Country 2020 & 2033
- Table 40: China Anti-counterfeit Plastic Caps and Closures Revenue (billion) Forecast, by Application 2020 & 2033
- Table 41: India Anti-counterfeit Plastic Caps and Closures Revenue (billion) Forecast, by Application 2020 & 2033
- Table 42: Japan Anti-counterfeit Plastic Caps and Closures Revenue (billion) Forecast, by Application 2020 & 2033
- Table 43: South Korea Anti-counterfeit Plastic Caps and Closures Revenue (billion) Forecast, by Application 2020 & 2033
- Table 44: ASEAN Anti-counterfeit Plastic Caps and Closures Revenue (billion) Forecast, by Application 2020 & 2033
- Table 45: Oceania Anti-counterfeit Plastic Caps and Closures Revenue (billion) Forecast, by Application 2020 & 2033
- Table 46: Rest of Asia Pacific Anti-counterfeit Plastic Caps and Closures Revenue (billion) Forecast, by Application 2020 & 2033
Frequently Asked Questions
1. What is the projected Compound Annual Growth Rate (CAGR) of the Anti-counterfeit Plastic Caps and Closures?
The projected CAGR is approximately 4.9%.
2. Which companies are prominent players in the Anti-counterfeit Plastic Caps and Closures?
Key companies in the market include Bericap, Berry Global, Amcor, Shandong Chiway Industry, Global Closure Systems (GCS), GualaClosures Group, Taiwan HonChuan Group, Anhui Baishijia Packaging.
3. What are the main segments of the Anti-counterfeit Plastic Caps and Closures?
The market segments include Application, Types.
4. Can you provide details about the market size?
The market size is estimated to be USD 176.5 billion as of 2022.
5. What are some drivers contributing to market growth?
N/A
6. What are the notable trends driving market growth?
N/A
7. Are there any restraints impacting market growth?
N/A
8. Can you provide examples of recent developments in the market?
N/A
9. What pricing options are available for accessing the report?
Pricing options include single-user, multi-user, and enterprise licenses priced at USD 4900.00, USD 7350.00, and USD 9800.00 respectively.
10. Is the market size provided in terms of value or volume?
The market size is provided in terms of value, measured in billion.
11. Are there any specific market keywords associated with the report?
Yes, the market keyword associated with the report is "Anti-counterfeit Plastic Caps and Closures," which aids in identifying and referencing the specific market segment covered.
12. How do I determine which pricing option suits my needs best?
The pricing options vary based on user requirements and access needs. Individual users may opt for single-user licenses, while businesses requiring broader access may choose multi-user or enterprise licenses for cost-effective access to the report.
13. Are there any additional resources or data provided in the Anti-counterfeit Plastic Caps and Closures report?
While the report offers comprehensive insights, it's advisable to review the specific contents or supplementary materials provided to ascertain if additional resources or data are available.
14. How can I stay updated on further developments or reports in the Anti-counterfeit Plastic Caps and Closures?
To stay informed about further developments, trends, and reports in the Anti-counterfeit Plastic Caps and Closures, consider subscribing to industry newsletters, following relevant companies and organizations, or regularly checking reputable industry news sources and publications.
Methodology
Step 1 - Identification of Relevant Samples Size from Population Database


Step 2 - Approaches for Defining Global Market Size (Value, Volume* & Price*)

Note*: In applicable scenarios
Step 3 - Data Sources
Primary Research
- Web Analytics
- Survey Reports
- Research Institute
- Latest Research Reports
- Opinion Leaders
Secondary Research
- Annual Reports
- White Paper
- Latest Press Release
- Industry Association
- Paid Database
- Investor Presentations

Step 4 - Data Triangulation
Involves using different sources of information in order to increase the validity of a study
These sources are likely to be stakeholders in a program - participants, other researchers, program staff, other community members, and so on.
Then we put all data in single framework & apply various statistical tools to find out the dynamic on the market.
During the analysis stage, feedback from the stakeholder groups would be compared to determine areas of agreement as well as areas of divergence