

Key Insights
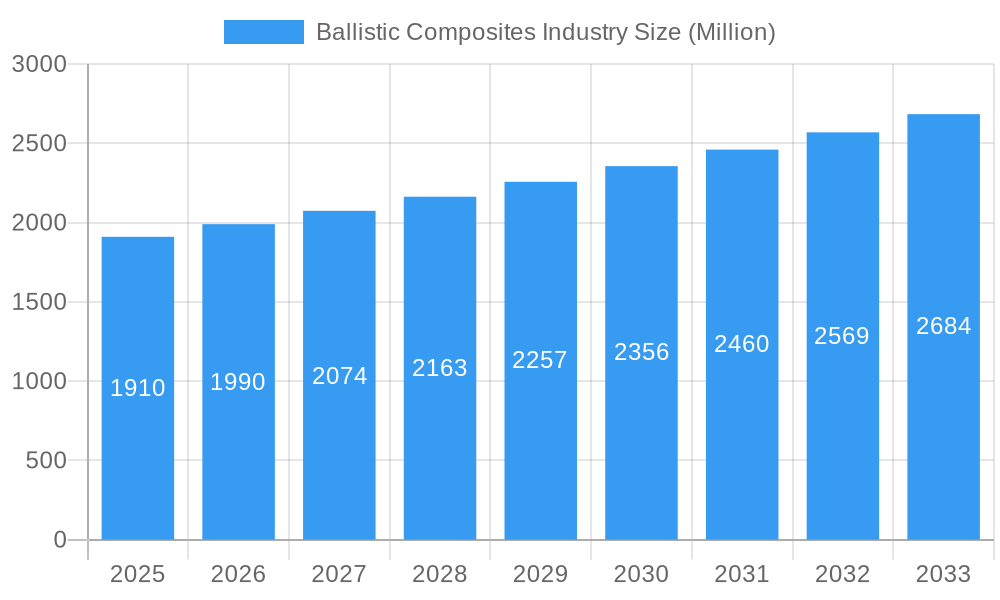
The global ballistic composites market, valued at $1.91 billion in 2025, is projected to experience robust growth, exhibiting a Compound Annual Growth Rate (CAGR) exceeding 4.00% from 2025 to 2033. This expansion is fueled by increasing demand for advanced protective materials across various sectors. Key drivers include rising global security concerns, escalating military spending, and the growing adoption of ballistic composites in civilian applications such as law enforcement and personal protective equipment. Technological advancements in fiber types, particularly the development of lighter, stronger, and more flexible materials like ultra-high-molecular weight polyethylene (UHMWPE) and bio-based fibers, are further propelling market growth. The market is segmented by fiber type (aramids, UHMWPE, S-glass, others), matrix type (polymer, polymer-ceramic, metal), and application (vehicle armor, body armor, helmets, and other applications like aircraft and marine protection). While the market faces restraints such as high material costs and stringent regulatory requirements, the ongoing demand for enhanced protection and the continuous innovation in materials science are expected to offset these challenges, ensuring sustained market expansion throughout the forecast period.

Ballistic Composites Industry Market Size (In Billion)
The regional distribution of the market reflects the global security landscape, with North America and Europe currently holding significant market shares. However, the Asia-Pacific region is anticipated to witness the fastest growth rate driven by increasing infrastructure development and rising defense budgets in countries like China and India. The competitive landscape is characterized by a mix of established players like Honeywell International Inc., Teijin Limited, and DuPont, alongside specialized manufacturers focusing on specific applications or material types. The increasing focus on research and development, strategic partnerships, and mergers and acquisitions will further shape the market dynamics in the coming years. The market's future trajectory points towards a continued shift towards lighter, more flexible, and cost-effective ballistic composites that offer superior protection while meeting the demands of diverse applications.
Ballistic Composites Industry Company Market Share
Ballistic Composites Industry: Market Analysis & Forecast (2019-2033)
This comprehensive report provides an in-depth analysis of the ballistic composites industry, encompassing market dynamics, growth trends, regional dominance, product landscape, and key players. With a study period spanning 2019-2033, a base year of 2025, and a forecast period of 2025-2033, this report is an essential resource for industry professionals, investors, and strategists seeking to understand and capitalize on the opportunities within this dynamic sector. The report analyzes parent markets like protective equipment and child markets such as body armor and vehicle armor. Market values are presented in million units.
Ballistic Composites Industry Market Dynamics & Structure
The ballistic composites market is characterized by moderate concentration, with key players like Honeywell International Inc, Teijin Limited, and DuPont holding significant market share (estimated at xx% combined in 2025). Technological innovation, driven by advancements in fiber types (e.g., UHMWPE, bio-based fibers) and matrix materials, is a key growth driver. Stringent regulatory frameworks regarding safety and performance standards influence product development and adoption. Competitive substitutes, such as traditional steel and ceramic armors, continue to exert pressure, although ballistic composites offer advantages in terms of weight and flexibility. The end-user demographics primarily comprise military and law enforcement agencies, but expanding applications in civilian sectors (e.g., high-performance sporting goods) are emerging. M&A activity in the sector has been moderate in recent years, with an estimated xx deals completed between 2019 and 2024.
- Market Concentration: Moderately concentrated, with top 3 players holding xx% market share (2025 est.).
- Technological Innovation: Focus on lighter, stronger, and more flexible materials.
- Regulatory Framework: Stringent safety and performance standards.
- Competitive Substitutes: Traditional steel and ceramic armors.
- End-User Demographics: Primarily military and law enforcement, expanding to civilian sectors.
- M&A Activity: xx deals completed between 2019 and 2024.
Ballistic Composites Industry Growth Trends & Insights
The ballistic composites market experienced significant growth during the historical period (2019-2024), with a CAGR of xx%. This growth is attributed to increasing demand from military and law enforcement, coupled with the development of advanced materials and applications. Market penetration in emerging economies is also contributing to expansion. Technological disruptions, particularly in fiber technology and manufacturing processes, are driving efficiency improvements and cost reductions. Shifts in consumer preferences toward lighter, more comfortable protective gear are also influencing market trends. The market is expected to continue its growth trajectory during the forecast period (2025-2033), with a projected CAGR of xx%, reaching a market size of xx million by 2033. The increasing adoption of advanced ballistic composites in various applications and expansion into new markets will be significant growth factors.
Dominant Regions, Countries, or Segments in Ballistic Composites Industry
North America and Europe currently dominate the ballistic composites market, driven by high defense budgets and technological advancements. However, the Asia-Pacific region is anticipated to exhibit significant growth in the coming years, fueled by rising defense spending and increasing demand for personal protective equipment. Within segments, aramids remain the dominant fiber type, holding a market share of approximately xx% in 2025, followed by UHMWPE. The polymer matrix type currently holds the largest share, though polymer-ceramic composites are gaining traction. Vehicle armor and body armor applications currently account for the largest market segments, with significant growth potential anticipated in other applications such as aircraft and marine protection.
- Key Regional Drivers: North America (strong defense spending), Europe (technological advancements), Asia-Pacific (rising defense budgets).
- Dominant Fiber Type: Aramids (xx% market share in 2025).
- Dominant Matrix Type: Polymer.
- Dominant Application: Vehicle Armor and Body Armor.
Ballistic Composites Industry Product Landscape
The ballistic composites market offers a wide range of products, including various types of body armor, vehicle armor, and helmets, each tailored to specific performance requirements. Recent innovations focus on enhancing flexibility, reducing weight, and improving comfort without compromising ballistic protection. Key selling propositions include improved protection, reduced weight, and enhanced comfort. Technological advancements include the development of advanced fiber materials, improved manufacturing processes, and the integration of smart technologies.
Key Drivers, Barriers & Challenges in Ballistic Composites Industry
Key Drivers:
- Increasing defense spending globally.
- Growing demand for personal protective equipment.
- Technological advancements in fiber and matrix materials.
- Expansion into new applications (e.g., sporting goods).
Key Challenges and Restraints:
- High raw material costs.
- Stringent regulatory compliance requirements.
- Intense competition from established players.
- Supply chain disruptions and geopolitical instability causing price fluctuations (estimated at xx% impact on market growth in 2024).
Emerging Opportunities in Ballistic Composites Industry
- Expansion into emerging markets with growing defense budgets.
- Development of lighter, more comfortable, and customizable protective gear.
- Integration of advanced technologies (e.g., sensors, electronics) into ballistic composites.
- Applications in high-performance sporting goods and other civilian sectors.
Growth Accelerators in the Ballistic Composites Industry
Technological breakthroughs in fiber and matrix materials, strategic partnerships between material suppliers and equipment manufacturers, and market expansion into new applications such as protective gear for civilian sectors are expected to accelerate market growth in the long term.
Key Players Shaping the Ballistic Composites Industry Market
- Honeywell International Inc
- Teijin Limited
- Plastic Reinforcement Fabrics Ltd
- BAE Systems
- Southern States llc
- Roihu Inc
- Barrday Inc
- TenCate Protective Fabrics
- MKU LIMITED
- Coherent Corp
- Integris
- Morgan Advanced Materials
- DSM
- DuPont
- Gaffco Ballistics
- Gurit Holding AG
- ArmorCore
Notable Milestones in Ballistic Composites Industry Sector
- November 2023: Integris Composites developed a new system of ballistic vest gear for law enforcement and military units and launched the company’s new Rapid Don/Doff body armor vests, reducing donning/doffing time by 50% or more.
- November 2023: Integris Composites launched customizable ballistic shields and vests, "Stand 5 F009," at Milipol Paris, showcasing a "make your own shield" concept.
In-Depth Ballistic Composites Industry Market Outlook
The ballistic composites market is poised for continued growth, driven by ongoing technological innovation, expanding applications, and increasing defense spending globally. Strategic partnerships and a focus on developing lighter, more comfortable, and customizable protective gear will be key factors in shaping future market dynamics. The market presents significant opportunities for companies that can innovate and adapt to evolving end-user needs.
Ballistic Composites Industry Segmentation
-
1. Fiber Type
- 1.1. Aramids
- 1.2. Ultra-high-molecular Weight Polyethylene (UHMWPE)
- 1.3. S-glass
- 1.4. Others F
-
2. Matrix Type
- 2.1. Polymer
- 2.2. Polymer-ceramic
- 2.3. Metal
-
3. Application
- 3.1. Vehicle Armor
- 3.2. Body Armor
- 3.3. Helmet and Face Protection
- 3.4. Other Ap
Ballistic Composites Industry Segmentation By Geography
-
1. Asia Pacific
- 1.1. China
- 1.2. India
- 1.3. Japan
- 1.4. South Korea
- 1.5. Rest of Asia Pacific
-
2. North America
- 2.1. United States
- 2.2. Canada
- 2.3. Mexico
-
3. Europe
- 3.1. Germany
- 3.2. United Kingdom
- 3.3. Italy
- 3.4. France
- 3.5. Spain
- 3.6. Rest of Europe
-
4. South America
- 4.1. Brazil
- 4.2. Argentina
- 4.3. Rest of South America
-
5. Middle East and Africa
- 5.1. Saudi Arabia
- 5.2. South Africa
- 5.3. Rest of Middle East and Africa

Ballistic Composites Industry Regional Market Share
Geographic Coverage of Ballistic Composites Industry
Ballistic Composites Industry REPORT HIGHLIGHTS
| Aspects | Details |
|---|---|
| Study Period | 2020-2034 |
| Base Year | 2025 |
| Estimated Year | 2026 |
| Forecast Period | 2026-2034 |
| Historical Period | 2020-2025 |
| Growth Rate | CAGR of > 4.00% from 2020-2034 |
| Segmentation |
|
Table of Contents
- 1. Introduction
- 1.1. Research Scope
- 1.2. Market Segmentation
- 1.3. Research Methodology
- 1.4. Definitions and Assumptions
- 2. Executive Summary
- 2.1. Introduction
- 3. Market Dynamics
- 3.1. Introduction
- 3.2. Market Drivers
- 3.2.1. Rise in Defense Expenditure; Increasing Demand for Lightweight Materials in the Aerospace and Defense Industry; Other Drivers
- 3.3. Market Restrains
- 3.3.1. High Processing and Manufacturing Costs; Volatile Raw Material Supply
- 3.4. Market Trends
- 3.4.1. Increasing Demand for Vehicle Armors
- 4. Market Factor Analysis
- 4.1. Porters Five Forces
- 4.2. Supply/Value Chain
- 4.3. PESTEL analysis
- 4.4. Market Entropy
- 4.5. Patent/Trademark Analysis
- 5. Global Ballistic Composites Industry Analysis, Insights and Forecast, 2020-2032
- 5.1. Market Analysis, Insights and Forecast - by Fiber Type
- 5.1.1. Aramids
- 5.1.2. Ultra-high-molecular Weight Polyethylene (UHMWPE)
- 5.1.3. S-glass
- 5.1.4. Others F
- 5.2. Market Analysis, Insights and Forecast - by Matrix Type
- 5.2.1. Polymer
- 5.2.2. Polymer-ceramic
- 5.2.3. Metal
- 5.3. Market Analysis, Insights and Forecast - by Application
- 5.3.1. Vehicle Armor
- 5.3.2. Body Armor
- 5.3.3. Helmet and Face Protection
- 5.3.4. Other Ap
- 5.4. Market Analysis, Insights and Forecast - by Region
- 5.4.1. Asia Pacific
- 5.4.2. North America
- 5.4.3. Europe
- 5.4.4. South America
- 5.4.5. Middle East and Africa
- 5.1. Market Analysis, Insights and Forecast - by Fiber Type
- 6. Asia Pacific Ballistic Composites Industry Analysis, Insights and Forecast, 2020-2032
- 6.1. Market Analysis, Insights and Forecast - by Fiber Type
- 6.1.1. Aramids
- 6.1.2. Ultra-high-molecular Weight Polyethylene (UHMWPE)
- 6.1.3. S-glass
- 6.1.4. Others F
- 6.2. Market Analysis, Insights and Forecast - by Matrix Type
- 6.2.1. Polymer
- 6.2.2. Polymer-ceramic
- 6.2.3. Metal
- 6.3. Market Analysis, Insights and Forecast - by Application
- 6.3.1. Vehicle Armor
- 6.3.2. Body Armor
- 6.3.3. Helmet and Face Protection
- 6.3.4. Other Ap
- 6.1. Market Analysis, Insights and Forecast - by Fiber Type
- 7. North America Ballistic Composites Industry Analysis, Insights and Forecast, 2020-2032
- 7.1. Market Analysis, Insights and Forecast - by Fiber Type
- 7.1.1. Aramids
- 7.1.2. Ultra-high-molecular Weight Polyethylene (UHMWPE)
- 7.1.3. S-glass
- 7.1.4. Others F
- 7.2. Market Analysis, Insights and Forecast - by Matrix Type
- 7.2.1. Polymer
- 7.2.2. Polymer-ceramic
- 7.2.3. Metal
- 7.3. Market Analysis, Insights and Forecast - by Application
- 7.3.1. Vehicle Armor
- 7.3.2. Body Armor
- 7.3.3. Helmet and Face Protection
- 7.3.4. Other Ap
- 7.1. Market Analysis, Insights and Forecast - by Fiber Type
- 8. Europe Ballistic Composites Industry Analysis, Insights and Forecast, 2020-2032
- 8.1. Market Analysis, Insights and Forecast - by Fiber Type
- 8.1.1. Aramids
- 8.1.2. Ultra-high-molecular Weight Polyethylene (UHMWPE)
- 8.1.3. S-glass
- 8.1.4. Others F
- 8.2. Market Analysis, Insights and Forecast - by Matrix Type
- 8.2.1. Polymer
- 8.2.2. Polymer-ceramic
- 8.2.3. Metal
- 8.3. Market Analysis, Insights and Forecast - by Application
- 8.3.1. Vehicle Armor
- 8.3.2. Body Armor
- 8.3.3. Helmet and Face Protection
- 8.3.4. Other Ap
- 8.1. Market Analysis, Insights and Forecast - by Fiber Type
- 9. South America Ballistic Composites Industry Analysis, Insights and Forecast, 2020-2032
- 9.1. Market Analysis, Insights and Forecast - by Fiber Type
- 9.1.1. Aramids
- 9.1.2. Ultra-high-molecular Weight Polyethylene (UHMWPE)
- 9.1.3. S-glass
- 9.1.4. Others F
- 9.2. Market Analysis, Insights and Forecast - by Matrix Type
- 9.2.1. Polymer
- 9.2.2. Polymer-ceramic
- 9.2.3. Metal
- 9.3. Market Analysis, Insights and Forecast - by Application
- 9.3.1. Vehicle Armor
- 9.3.2. Body Armor
- 9.3.3. Helmet and Face Protection
- 9.3.4. Other Ap
- 9.1. Market Analysis, Insights and Forecast - by Fiber Type
- 10. Middle East and Africa Ballistic Composites Industry Analysis, Insights and Forecast, 2020-2032
- 10.1. Market Analysis, Insights and Forecast - by Fiber Type
- 10.1.1. Aramids
- 10.1.2. Ultra-high-molecular Weight Polyethylene (UHMWPE)
- 10.1.3. S-glass
- 10.1.4. Others F
- 10.2. Market Analysis, Insights and Forecast - by Matrix Type
- 10.2.1. Polymer
- 10.2.2. Polymer-ceramic
- 10.2.3. Metal
- 10.3. Market Analysis, Insights and Forecast - by Application
- 10.3.1. Vehicle Armor
- 10.3.2. Body Armor
- 10.3.3. Helmet and Face Protection
- 10.3.4. Other Ap
- 10.1. Market Analysis, Insights and Forecast - by Fiber Type
- 11. Competitive Analysis
- 11.1. Global Market Share Analysis 2025
- 11.2. Company Profiles
- 11.2.1 Honeywell International Inc
- 11.2.1.1. Overview
- 11.2.1.2. Products
- 11.2.1.3. SWOT Analysis
- 11.2.1.4. Recent Developments
- 11.2.1.5. Financials (Based on Availability)
- 11.2.2 Teijin Limited
- 11.2.2.1. Overview
- 11.2.2.2. Products
- 11.2.2.3. SWOT Analysis
- 11.2.2.4. Recent Developments
- 11.2.2.5. Financials (Based on Availability)
- 11.2.3 Plastic Reinforcement Fabrics Ltd
- 11.2.3.1. Overview
- 11.2.3.2. Products
- 11.2.3.3. SWOT Analysis
- 11.2.3.4. Recent Developments
- 11.2.3.5. Financials (Based on Availability)
- 11.2.4 BAE Systems
- 11.2.4.1. Overview
- 11.2.4.2. Products
- 11.2.4.3. SWOT Analysis
- 11.2.4.4. Recent Developments
- 11.2.4.5. Financials (Based on Availability)
- 11.2.5 Southern States llc
- 11.2.5.1. Overview
- 11.2.5.2. Products
- 11.2.5.3. SWOT Analysis
- 11.2.5.4. Recent Developments
- 11.2.5.5. Financials (Based on Availability)
- 11.2.6 Roihu Inc
- 11.2.6.1. Overview
- 11.2.6.2. Products
- 11.2.6.3. SWOT Analysis
- 11.2.6.4. Recent Developments
- 11.2.6.5. Financials (Based on Availability)
- 11.2.7 Barrday Inc
- 11.2.7.1. Overview
- 11.2.7.2. Products
- 11.2.7.3. SWOT Analysis
- 11.2.7.4. Recent Developments
- 11.2.7.5. Financials (Based on Availability)
- 11.2.8 TenCate Protective Fabrics
- 11.2.8.1. Overview
- 11.2.8.2. Products
- 11.2.8.3. SWOT Analysis
- 11.2.8.4. Recent Developments
- 11.2.8.5. Financials (Based on Availability)
- 11.2.9 MKU LIMITED
- 11.2.9.1. Overview
- 11.2.9.2. Products
- 11.2.9.3. SWOT Analysis
- 11.2.9.4. Recent Developments
- 11.2.9.5. Financials (Based on Availability)
- 11.2.10 Coherent Corp
- 11.2.10.1. Overview
- 11.2.10.2. Products
- 11.2.10.3. SWOT Analysis
- 11.2.10.4. Recent Developments
- 11.2.10.5. Financials (Based on Availability)
- 11.2.11 Integris
- 11.2.11.1. Overview
- 11.2.11.2. Products
- 11.2.11.3. SWOT Analysis
- 11.2.11.4. Recent Developments
- 11.2.11.5. Financials (Based on Availability)
- 11.2.12 Morgan Advanced Materials
- 11.2.12.1. Overview
- 11.2.12.2. Products
- 11.2.12.3. SWOT Analysis
- 11.2.12.4. Recent Developments
- 11.2.12.5. Financials (Based on Availability)
- 11.2.13 DSM
- 11.2.13.1. Overview
- 11.2.13.2. Products
- 11.2.13.3. SWOT Analysis
- 11.2.13.4. Recent Developments
- 11.2.13.5. Financials (Based on Availability)
- 11.2.14 DuPont
- 11.2.14.1. Overview
- 11.2.14.2. Products
- 11.2.14.3. SWOT Analysis
- 11.2.14.4. Recent Developments
- 11.2.14.5. Financials (Based on Availability)
- 11.2.15 Gaffco Ballistics
- 11.2.15.1. Overview
- 11.2.15.2. Products
- 11.2.15.3. SWOT Analysis
- 11.2.15.4. Recent Developments
- 11.2.15.5. Financials (Based on Availability)
- 11.2.16 Gurit Holding AG
- 11.2.16.1. Overview
- 11.2.16.2. Products
- 11.2.16.3. SWOT Analysis
- 11.2.16.4. Recent Developments
- 11.2.16.5. Financials (Based on Availability)
- 11.2.17 ArmorCore
- 11.2.17.1. Overview
- 11.2.17.2. Products
- 11.2.17.3. SWOT Analysis
- 11.2.17.4. Recent Developments
- 11.2.17.5. Financials (Based on Availability)
- 11.2.1 Honeywell International Inc
List of Figures
- Figure 1: Global Ballistic Composites Industry Revenue Breakdown (Million, %) by Region 2025 & 2033
- Figure 2: Global Ballistic Composites Industry Volume Breakdown (K Tons, %) by Region 2025 & 2033
- Figure 3: Asia Pacific Ballistic Composites Industry Revenue (Million), by Fiber Type 2025 & 2033
- Figure 4: Asia Pacific Ballistic Composites Industry Volume (K Tons), by Fiber Type 2025 & 2033
- Figure 5: Asia Pacific Ballistic Composites Industry Revenue Share (%), by Fiber Type 2025 & 2033
- Figure 6: Asia Pacific Ballistic Composites Industry Volume Share (%), by Fiber Type 2025 & 2033
- Figure 7: Asia Pacific Ballistic Composites Industry Revenue (Million), by Matrix Type 2025 & 2033
- Figure 8: Asia Pacific Ballistic Composites Industry Volume (K Tons), by Matrix Type 2025 & 2033
- Figure 9: Asia Pacific Ballistic Composites Industry Revenue Share (%), by Matrix Type 2025 & 2033
- Figure 10: Asia Pacific Ballistic Composites Industry Volume Share (%), by Matrix Type 2025 & 2033
- Figure 11: Asia Pacific Ballistic Composites Industry Revenue (Million), by Application 2025 & 2033
- Figure 12: Asia Pacific Ballistic Composites Industry Volume (K Tons), by Application 2025 & 2033
- Figure 13: Asia Pacific Ballistic Composites Industry Revenue Share (%), by Application 2025 & 2033
- Figure 14: Asia Pacific Ballistic Composites Industry Volume Share (%), by Application 2025 & 2033
- Figure 15: Asia Pacific Ballistic Composites Industry Revenue (Million), by Country 2025 & 2033
- Figure 16: Asia Pacific Ballistic Composites Industry Volume (K Tons), by Country 2025 & 2033
- Figure 17: Asia Pacific Ballistic Composites Industry Revenue Share (%), by Country 2025 & 2033
- Figure 18: Asia Pacific Ballistic Composites Industry Volume Share (%), by Country 2025 & 2033
- Figure 19: North America Ballistic Composites Industry Revenue (Million), by Fiber Type 2025 & 2033
- Figure 20: North America Ballistic Composites Industry Volume (K Tons), by Fiber Type 2025 & 2033
- Figure 21: North America Ballistic Composites Industry Revenue Share (%), by Fiber Type 2025 & 2033
- Figure 22: North America Ballistic Composites Industry Volume Share (%), by Fiber Type 2025 & 2033
- Figure 23: North America Ballistic Composites Industry Revenue (Million), by Matrix Type 2025 & 2033
- Figure 24: North America Ballistic Composites Industry Volume (K Tons), by Matrix Type 2025 & 2033
- Figure 25: North America Ballistic Composites Industry Revenue Share (%), by Matrix Type 2025 & 2033
- Figure 26: North America Ballistic Composites Industry Volume Share (%), by Matrix Type 2025 & 2033
- Figure 27: North America Ballistic Composites Industry Revenue (Million), by Application 2025 & 2033
- Figure 28: North America Ballistic Composites Industry Volume (K Tons), by Application 2025 & 2033
- Figure 29: North America Ballistic Composites Industry Revenue Share (%), by Application 2025 & 2033
- Figure 30: North America Ballistic Composites Industry Volume Share (%), by Application 2025 & 2033
- Figure 31: North America Ballistic Composites Industry Revenue (Million), by Country 2025 & 2033
- Figure 32: North America Ballistic Composites Industry Volume (K Tons), by Country 2025 & 2033
- Figure 33: North America Ballistic Composites Industry Revenue Share (%), by Country 2025 & 2033
- Figure 34: North America Ballistic Composites Industry Volume Share (%), by Country 2025 & 2033
- Figure 35: Europe Ballistic Composites Industry Revenue (Million), by Fiber Type 2025 & 2033
- Figure 36: Europe Ballistic Composites Industry Volume (K Tons), by Fiber Type 2025 & 2033
- Figure 37: Europe Ballistic Composites Industry Revenue Share (%), by Fiber Type 2025 & 2033
- Figure 38: Europe Ballistic Composites Industry Volume Share (%), by Fiber Type 2025 & 2033
- Figure 39: Europe Ballistic Composites Industry Revenue (Million), by Matrix Type 2025 & 2033
- Figure 40: Europe Ballistic Composites Industry Volume (K Tons), by Matrix Type 2025 & 2033
- Figure 41: Europe Ballistic Composites Industry Revenue Share (%), by Matrix Type 2025 & 2033
- Figure 42: Europe Ballistic Composites Industry Volume Share (%), by Matrix Type 2025 & 2033
- Figure 43: Europe Ballistic Composites Industry Revenue (Million), by Application 2025 & 2033
- Figure 44: Europe Ballistic Composites Industry Volume (K Tons), by Application 2025 & 2033
- Figure 45: Europe Ballistic Composites Industry Revenue Share (%), by Application 2025 & 2033
- Figure 46: Europe Ballistic Composites Industry Volume Share (%), by Application 2025 & 2033
- Figure 47: Europe Ballistic Composites Industry Revenue (Million), by Country 2025 & 2033
- Figure 48: Europe Ballistic Composites Industry Volume (K Tons), by Country 2025 & 2033
- Figure 49: Europe Ballistic Composites Industry Revenue Share (%), by Country 2025 & 2033
- Figure 50: Europe Ballistic Composites Industry Volume Share (%), by Country 2025 & 2033
- Figure 51: South America Ballistic Composites Industry Revenue (Million), by Fiber Type 2025 & 2033
- Figure 52: South America Ballistic Composites Industry Volume (K Tons), by Fiber Type 2025 & 2033
- Figure 53: South America Ballistic Composites Industry Revenue Share (%), by Fiber Type 2025 & 2033
- Figure 54: South America Ballistic Composites Industry Volume Share (%), by Fiber Type 2025 & 2033
- Figure 55: South America Ballistic Composites Industry Revenue (Million), by Matrix Type 2025 & 2033
- Figure 56: South America Ballistic Composites Industry Volume (K Tons), by Matrix Type 2025 & 2033
- Figure 57: South America Ballistic Composites Industry Revenue Share (%), by Matrix Type 2025 & 2033
- Figure 58: South America Ballistic Composites Industry Volume Share (%), by Matrix Type 2025 & 2033
- Figure 59: South America Ballistic Composites Industry Revenue (Million), by Application 2025 & 2033
- Figure 60: South America Ballistic Composites Industry Volume (K Tons), by Application 2025 & 2033
- Figure 61: South America Ballistic Composites Industry Revenue Share (%), by Application 2025 & 2033
- Figure 62: South America Ballistic Composites Industry Volume Share (%), by Application 2025 & 2033
- Figure 63: South America Ballistic Composites Industry Revenue (Million), by Country 2025 & 2033
- Figure 64: South America Ballistic Composites Industry Volume (K Tons), by Country 2025 & 2033
- Figure 65: South America Ballistic Composites Industry Revenue Share (%), by Country 2025 & 2033
- Figure 66: South America Ballistic Composites Industry Volume Share (%), by Country 2025 & 2033
- Figure 67: Middle East and Africa Ballistic Composites Industry Revenue (Million), by Fiber Type 2025 & 2033
- Figure 68: Middle East and Africa Ballistic Composites Industry Volume (K Tons), by Fiber Type 2025 & 2033
- Figure 69: Middle East and Africa Ballistic Composites Industry Revenue Share (%), by Fiber Type 2025 & 2033
- Figure 70: Middle East and Africa Ballistic Composites Industry Volume Share (%), by Fiber Type 2025 & 2033
- Figure 71: Middle East and Africa Ballistic Composites Industry Revenue (Million), by Matrix Type 2025 & 2033
- Figure 72: Middle East and Africa Ballistic Composites Industry Volume (K Tons), by Matrix Type 2025 & 2033
- Figure 73: Middle East and Africa Ballistic Composites Industry Revenue Share (%), by Matrix Type 2025 & 2033
- Figure 74: Middle East and Africa Ballistic Composites Industry Volume Share (%), by Matrix Type 2025 & 2033
- Figure 75: Middle East and Africa Ballistic Composites Industry Revenue (Million), by Application 2025 & 2033
- Figure 76: Middle East and Africa Ballistic Composites Industry Volume (K Tons), by Application 2025 & 2033
- Figure 77: Middle East and Africa Ballistic Composites Industry Revenue Share (%), by Application 2025 & 2033
- Figure 78: Middle East and Africa Ballistic Composites Industry Volume Share (%), by Application 2025 & 2033
- Figure 79: Middle East and Africa Ballistic Composites Industry Revenue (Million), by Country 2025 & 2033
- Figure 80: Middle East and Africa Ballistic Composites Industry Volume (K Tons), by Country 2025 & 2033
- Figure 81: Middle East and Africa Ballistic Composites Industry Revenue Share (%), by Country 2025 & 2033
- Figure 82: Middle East and Africa Ballistic Composites Industry Volume Share (%), by Country 2025 & 2033
List of Tables
- Table 1: Global Ballistic Composites Industry Revenue Million Forecast, by Fiber Type 2020 & 2033
- Table 2: Global Ballistic Composites Industry Volume K Tons Forecast, by Fiber Type 2020 & 2033
- Table 3: Global Ballistic Composites Industry Revenue Million Forecast, by Matrix Type 2020 & 2033
- Table 4: Global Ballistic Composites Industry Volume K Tons Forecast, by Matrix Type 2020 & 2033
- Table 5: Global Ballistic Composites Industry Revenue Million Forecast, by Application 2020 & 2033
- Table 6: Global Ballistic Composites Industry Volume K Tons Forecast, by Application 2020 & 2033
- Table 7: Global Ballistic Composites Industry Revenue Million Forecast, by Region 2020 & 2033
- Table 8: Global Ballistic Composites Industry Volume K Tons Forecast, by Region 2020 & 2033
- Table 9: Global Ballistic Composites Industry Revenue Million Forecast, by Fiber Type 2020 & 2033
- Table 10: Global Ballistic Composites Industry Volume K Tons Forecast, by Fiber Type 2020 & 2033
- Table 11: Global Ballistic Composites Industry Revenue Million Forecast, by Matrix Type 2020 & 2033
- Table 12: Global Ballistic Composites Industry Volume K Tons Forecast, by Matrix Type 2020 & 2033
- Table 13: Global Ballistic Composites Industry Revenue Million Forecast, by Application 2020 & 2033
- Table 14: Global Ballistic Composites Industry Volume K Tons Forecast, by Application 2020 & 2033
- Table 15: Global Ballistic Composites Industry Revenue Million Forecast, by Country 2020 & 2033
- Table 16: Global Ballistic Composites Industry Volume K Tons Forecast, by Country 2020 & 2033
- Table 17: China Ballistic Composites Industry Revenue (Million) Forecast, by Application 2020 & 2033
- Table 18: China Ballistic Composites Industry Volume (K Tons) Forecast, by Application 2020 & 2033
- Table 19: India Ballistic Composites Industry Revenue (Million) Forecast, by Application 2020 & 2033
- Table 20: India Ballistic Composites Industry Volume (K Tons) Forecast, by Application 2020 & 2033
- Table 21: Japan Ballistic Composites Industry Revenue (Million) Forecast, by Application 2020 & 2033
- Table 22: Japan Ballistic Composites Industry Volume (K Tons) Forecast, by Application 2020 & 2033
- Table 23: South Korea Ballistic Composites Industry Revenue (Million) Forecast, by Application 2020 & 2033
- Table 24: South Korea Ballistic Composites Industry Volume (K Tons) Forecast, by Application 2020 & 2033
- Table 25: Rest of Asia Pacific Ballistic Composites Industry Revenue (Million) Forecast, by Application 2020 & 2033
- Table 26: Rest of Asia Pacific Ballistic Composites Industry Volume (K Tons) Forecast, by Application 2020 & 2033
- Table 27: Global Ballistic Composites Industry Revenue Million Forecast, by Fiber Type 2020 & 2033
- Table 28: Global Ballistic Composites Industry Volume K Tons Forecast, by Fiber Type 2020 & 2033
- Table 29: Global Ballistic Composites Industry Revenue Million Forecast, by Matrix Type 2020 & 2033
- Table 30: Global Ballistic Composites Industry Volume K Tons Forecast, by Matrix Type 2020 & 2033
- Table 31: Global Ballistic Composites Industry Revenue Million Forecast, by Application 2020 & 2033
- Table 32: Global Ballistic Composites Industry Volume K Tons Forecast, by Application 2020 & 2033
- Table 33: Global Ballistic Composites Industry Revenue Million Forecast, by Country 2020 & 2033
- Table 34: Global Ballistic Composites Industry Volume K Tons Forecast, by Country 2020 & 2033
- Table 35: United States Ballistic Composites Industry Revenue (Million) Forecast, by Application 2020 & 2033
- Table 36: United States Ballistic Composites Industry Volume (K Tons) Forecast, by Application 2020 & 2033
- Table 37: Canada Ballistic Composites Industry Revenue (Million) Forecast, by Application 2020 & 2033
- Table 38: Canada Ballistic Composites Industry Volume (K Tons) Forecast, by Application 2020 & 2033
- Table 39: Mexico Ballistic Composites Industry Revenue (Million) Forecast, by Application 2020 & 2033
- Table 40: Mexico Ballistic Composites Industry Volume (K Tons) Forecast, by Application 2020 & 2033
- Table 41: Global Ballistic Composites Industry Revenue Million Forecast, by Fiber Type 2020 & 2033
- Table 42: Global Ballistic Composites Industry Volume K Tons Forecast, by Fiber Type 2020 & 2033
- Table 43: Global Ballistic Composites Industry Revenue Million Forecast, by Matrix Type 2020 & 2033
- Table 44: Global Ballistic Composites Industry Volume K Tons Forecast, by Matrix Type 2020 & 2033
- Table 45: Global Ballistic Composites Industry Revenue Million Forecast, by Application 2020 & 2033
- Table 46: Global Ballistic Composites Industry Volume K Tons Forecast, by Application 2020 & 2033
- Table 47: Global Ballistic Composites Industry Revenue Million Forecast, by Country 2020 & 2033
- Table 48: Global Ballistic Composites Industry Volume K Tons Forecast, by Country 2020 & 2033
- Table 49: Germany Ballistic Composites Industry Revenue (Million) Forecast, by Application 2020 & 2033
- Table 50: Germany Ballistic Composites Industry Volume (K Tons) Forecast, by Application 2020 & 2033
- Table 51: United Kingdom Ballistic Composites Industry Revenue (Million) Forecast, by Application 2020 & 2033
- Table 52: United Kingdom Ballistic Composites Industry Volume (K Tons) Forecast, by Application 2020 & 2033
- Table 53: Italy Ballistic Composites Industry Revenue (Million) Forecast, by Application 2020 & 2033
- Table 54: Italy Ballistic Composites Industry Volume (K Tons) Forecast, by Application 2020 & 2033
- Table 55: France Ballistic Composites Industry Revenue (Million) Forecast, by Application 2020 & 2033
- Table 56: France Ballistic Composites Industry Volume (K Tons) Forecast, by Application 2020 & 2033
- Table 57: Spain Ballistic Composites Industry Revenue (Million) Forecast, by Application 2020 & 2033
- Table 58: Spain Ballistic Composites Industry Volume (K Tons) Forecast, by Application 2020 & 2033
- Table 59: Rest of Europe Ballistic Composites Industry Revenue (Million) Forecast, by Application 2020 & 2033
- Table 60: Rest of Europe Ballistic Composites Industry Volume (K Tons) Forecast, by Application 2020 & 2033
- Table 61: Global Ballistic Composites Industry Revenue Million Forecast, by Fiber Type 2020 & 2033
- Table 62: Global Ballistic Composites Industry Volume K Tons Forecast, by Fiber Type 2020 & 2033
- Table 63: Global Ballistic Composites Industry Revenue Million Forecast, by Matrix Type 2020 & 2033
- Table 64: Global Ballistic Composites Industry Volume K Tons Forecast, by Matrix Type 2020 & 2033
- Table 65: Global Ballistic Composites Industry Revenue Million Forecast, by Application 2020 & 2033
- Table 66: Global Ballistic Composites Industry Volume K Tons Forecast, by Application 2020 & 2033
- Table 67: Global Ballistic Composites Industry Revenue Million Forecast, by Country 2020 & 2033
- Table 68: Global Ballistic Composites Industry Volume K Tons Forecast, by Country 2020 & 2033
- Table 69: Brazil Ballistic Composites Industry Revenue (Million) Forecast, by Application 2020 & 2033
- Table 70: Brazil Ballistic Composites Industry Volume (K Tons) Forecast, by Application 2020 & 2033
- Table 71: Argentina Ballistic Composites Industry Revenue (Million) Forecast, by Application 2020 & 2033
- Table 72: Argentina Ballistic Composites Industry Volume (K Tons) Forecast, by Application 2020 & 2033
- Table 73: Rest of South America Ballistic Composites Industry Revenue (Million) Forecast, by Application 2020 & 2033
- Table 74: Rest of South America Ballistic Composites Industry Volume (K Tons) Forecast, by Application 2020 & 2033
- Table 75: Global Ballistic Composites Industry Revenue Million Forecast, by Fiber Type 2020 & 2033
- Table 76: Global Ballistic Composites Industry Volume K Tons Forecast, by Fiber Type 2020 & 2033
- Table 77: Global Ballistic Composites Industry Revenue Million Forecast, by Matrix Type 2020 & 2033
- Table 78: Global Ballistic Composites Industry Volume K Tons Forecast, by Matrix Type 2020 & 2033
- Table 79: Global Ballistic Composites Industry Revenue Million Forecast, by Application 2020 & 2033
- Table 80: Global Ballistic Composites Industry Volume K Tons Forecast, by Application 2020 & 2033
- Table 81: Global Ballistic Composites Industry Revenue Million Forecast, by Country 2020 & 2033
- Table 82: Global Ballistic Composites Industry Volume K Tons Forecast, by Country 2020 & 2033
- Table 83: Saudi Arabia Ballistic Composites Industry Revenue (Million) Forecast, by Application 2020 & 2033
- Table 84: Saudi Arabia Ballistic Composites Industry Volume (K Tons) Forecast, by Application 2020 & 2033
- Table 85: South Africa Ballistic Composites Industry Revenue (Million) Forecast, by Application 2020 & 2033
- Table 86: South Africa Ballistic Composites Industry Volume (K Tons) Forecast, by Application 2020 & 2033
- Table 87: Rest of Middle East and Africa Ballistic Composites Industry Revenue (Million) Forecast, by Application 2020 & 2033
- Table 88: Rest of Middle East and Africa Ballistic Composites Industry Volume (K Tons) Forecast, by Application 2020 & 2033
Frequently Asked Questions
1. What is the projected Compound Annual Growth Rate (CAGR) of the Ballistic Composites Industry?
The projected CAGR is approximately > 4.00%.
2. Which companies are prominent players in the Ballistic Composites Industry?
Key companies in the market include Honeywell International Inc, Teijin Limited, Plastic Reinforcement Fabrics Ltd, BAE Systems, Southern States llc, Roihu Inc, Barrday Inc, TenCate Protective Fabrics, MKU LIMITED, Coherent Corp, Integris, Morgan Advanced Materials, DSM, DuPont, Gaffco Ballistics, Gurit Holding AG, ArmorCore.
3. What are the main segments of the Ballistic Composites Industry?
The market segments include Fiber Type, Matrix Type, Application.
4. Can you provide details about the market size?
The market size is estimated to be USD 1.91 Million as of 2022.
5. What are some drivers contributing to market growth?
Rise in Defense Expenditure; Increasing Demand for Lightweight Materials in the Aerospace and Defense Industry; Other Drivers.
6. What are the notable trends driving market growth?
Increasing Demand for Vehicle Armors.
7. Are there any restraints impacting market growth?
High Processing and Manufacturing Costs; Volatile Raw Material Supply.
8. Can you provide examples of recent developments in the market?
November 2023: Integris Composites developed a new system of ballistic vest gear for law enforcement and military units and launched the company’s new Rapid Don/Doff body armor vests. It is an equipment that dramatically reduces the time for donning and doffing one’s body armor rig—by 50% or more.
9. What pricing options are available for accessing the report?
Pricing options include single-user, multi-user, and enterprise licenses priced at USD 4750, USD 5250, and USD 8750 respectively.
10. Is the market size provided in terms of value or volume?
The market size is provided in terms of value, measured in Million and volume, measured in K Tons.
11. Are there any specific market keywords associated with the report?
Yes, the market keyword associated with the report is "Ballistic Composites Industry," which aids in identifying and referencing the specific market segment covered.
12. How do I determine which pricing option suits my needs best?
The pricing options vary based on user requirements and access needs. Individual users may opt for single-user licenses, while businesses requiring broader access may choose multi-user or enterprise licenses for cost-effective access to the report.
13. Are there any additional resources or data provided in the Ballistic Composites Industry report?
While the report offers comprehensive insights, it's advisable to review the specific contents or supplementary materials provided to ascertain if additional resources or data are available.
14. How can I stay updated on further developments or reports in the Ballistic Composites Industry?
To stay informed about further developments, trends, and reports in the Ballistic Composites Industry, consider subscribing to industry newsletters, following relevant companies and organizations, or regularly checking reputable industry news sources and publications.
Methodology
Step 1 - Identification of Relevant Samples Size from Population Database


Step 2 - Approaches for Defining Global Market Size (Value, Volume* & Price*)

Note*: In applicable scenarios
Step 3 - Data Sources
Primary Research
- Web Analytics
- Survey Reports
- Research Institute
- Latest Research Reports
- Opinion Leaders
Secondary Research
- Annual Reports
- White Paper
- Latest Press Release
- Industry Association
- Paid Database
- Investor Presentations

Step 4 - Data Triangulation
Involves using different sources of information in order to increase the validity of a study
These sources are likely to be stakeholders in a program - participants, other researchers, program staff, other community members, and so on.
Then we put all data in single framework & apply various statistical tools to find out the dynamic on the market.
During the analysis stage, feedback from the stakeholder groups would be compared to determine areas of agreement as well as areas of divergence