

Key Insights
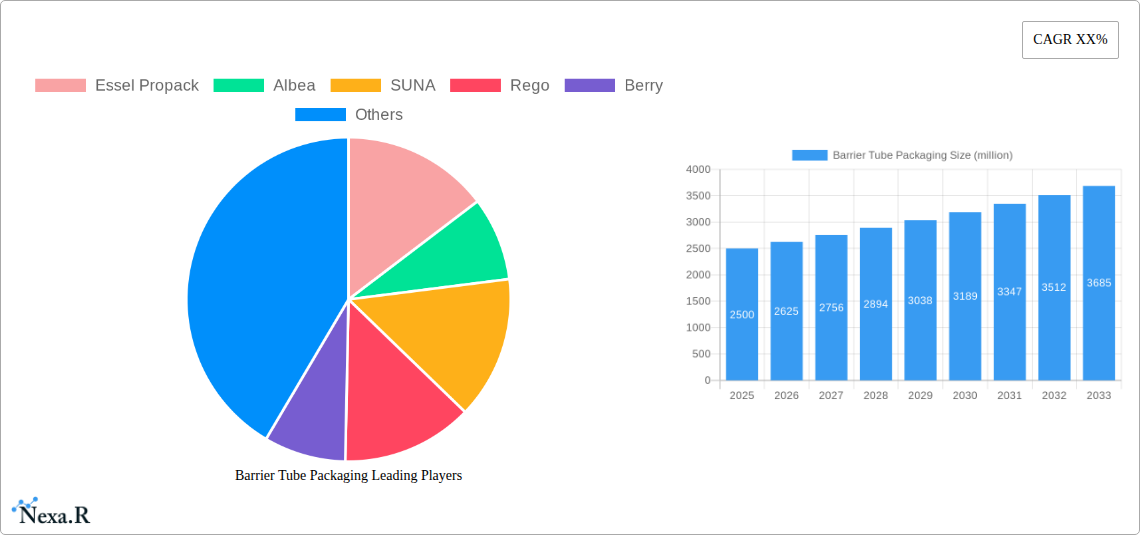
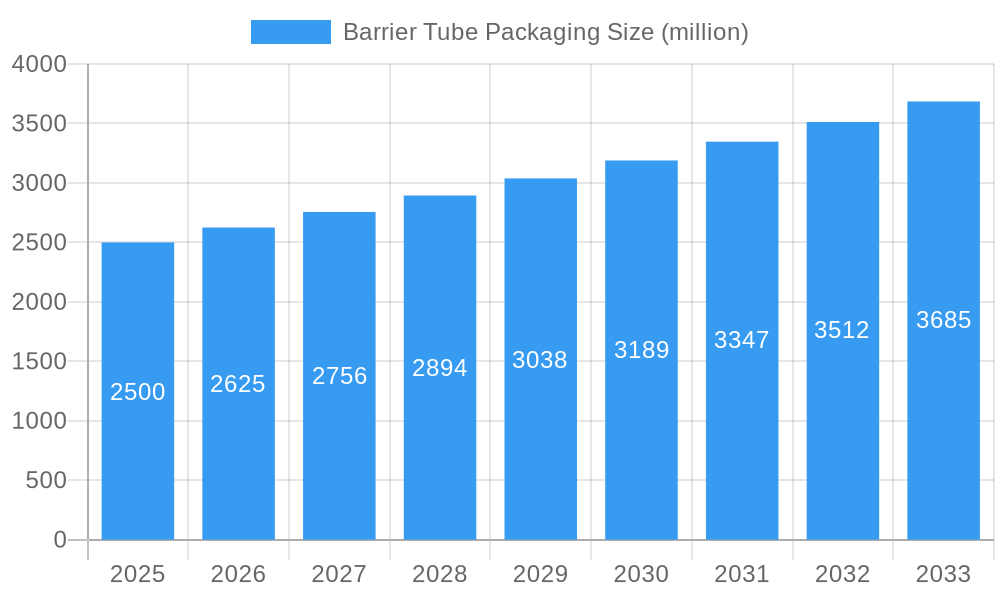
The barrier tube packaging market is experiencing robust growth, driven by increasing demand for convenient, sustainable, and tamper-evident packaging solutions across various industries. The market's expansion is fueled by several key factors, including the rising popularity of personal care and cosmetic products, the growing preference for single-use packaging, and advancements in barrier tube technology leading to improved product protection and shelf life. Furthermore, the increasing focus on sustainable packaging materials, such as recyclable and biodegradable plastics, is driving innovation and adoption within the market. We estimate the market size in 2025 to be approximately $2.5 billion, based on typical growth rates observed in similar packaging segments. A compound annual growth rate (CAGR) of around 5% is projected for the forecast period (2025-2033), resulting in substantial market expansion. Key players, including Essel Propack, Albea, SUNA, Rego, Berry, Kimpai, BeautyStar, and Abdos, are actively contributing to this growth through product innovation and strategic partnerships. However, fluctuating raw material prices and environmental concerns related to plastic waste remain significant restraints.
Barrier Tube Packaging Market Size (In Billion)
Segment analysis reveals a strong preference for laminated tubes due to their superior barrier properties and cost-effectiveness. Regional variations exist, with North America and Europe currently holding the largest market share, driven by high consumer spending and established infrastructure. However, emerging economies in Asia-Pacific are witnessing rapid growth due to rising disposable incomes and increasing demand for packaged goods. The forecast period indicates continued market penetration in these regions, propelled by increasing urbanization and changing consumer lifestyles. The market is expected to witness a shift toward more sustainable and eco-friendly packaging solutions, presenting significant opportunities for companies investing in biodegradable and compostable materials. Continuous innovation in barrier technologies, such as the integration of smart packaging features and improved recyclability, will be crucial for future market success.
Barrier Tube Packaging Company Market Share
Barrier Tube Packaging Market Report: 2019-2033
This comprehensive report provides a detailed analysis of the global barrier tube packaging market, offering invaluable insights for industry professionals, investors, and strategic decision-makers. The study period covers 2019-2033, with 2025 as the base and estimated year, and a forecast period of 2025-2033. The report meticulously examines market dynamics, growth trends, regional dominance, product innovations, key players (including Essel Propack, Albea, SUNA, Rego, Berry, Kimpai, BeautyStar, and Abdos), and future opportunities within the parent market of packaging and the child market of cosmetic & personal care packaging. Expect in-depth quantitative data and qualitative analysis, expressed in million units, for a complete understanding of this dynamic market.
Barrier Tube Packaging Market Dynamics & Structure
The barrier tube packaging market is characterized by moderate concentration, with key players holding significant market share. While precise figures for 2025 market share require detailed analysis within the full report, preliminary estimates suggest Essel Propack and Albea hold a combined xx% share. Technological innovation, driven by the need for enhanced barrier properties and sustainable materials, is a significant driver. Regulatory frameworks regarding material safety and recyclability continue to evolve, impacting product design and manufacturing processes. Competitive substitutes include alternative packaging solutions like pouches and bottles. The end-user demographics are diverse, spanning the cosmetics, pharmaceuticals, and food industries. M&A activity in the sector has been relatively consistent, with an estimated xx M&A deals concluded during the historical period (2019-2024), primarily driven by companies seeking expansion into new markets or technological capabilities.
- Market Concentration: Moderately concentrated, with leading players holding xx% of the market share in 2025.
- Technological Innovation: Focus on improved barrier properties, sustainability, and ease of use.
- Regulatory Landscape: Stringent regulations impacting material selection and recyclability.
- Competitive Substitutes: Pouches, bottles, and other flexible packaging solutions.
- End-User Demographics: Cosmetics, pharmaceuticals, food, and personal care.
- M&A Activity: xx M&A deals in the historical period (2019-2024).
Barrier Tube Packaging Growth Trends & Insights
The global barrier tube packaging market experienced robust growth during the historical period (2019-2024), expanding at a CAGR of xx%. This growth is projected to continue during the forecast period (2025-2033), albeit at a slightly moderated pace, with a projected CAGR of xx%. Increased demand from the cosmetics and personal care sector, coupled with the rising preference for convenient and aesthetically pleasing packaging, are key drivers. Technological advancements, including the introduction of sustainable and high-barrier materials, have further fueled market expansion. Consumer behavior shifts towards premium and eco-friendly products have also impacted adoption rates. Market penetration is currently at xx% and is expected to reach xx% by 2033. The report delves into specific trends affecting growth across different segments and regions. The introduction of innovative barrier technologies, such as those employing multilayer films and advanced coatings, has significantly enhanced the performance characteristics of barrier tube packaging, contributing to growth in higher-value applications.
Dominant Regions, Countries, or Segments in Barrier Tube Packaging
North America currently holds the largest market share in the barrier tube packaging market, driven by a combination of factors. Strong consumer demand for premium personal care products, coupled with the robust presence of major cosmetic and pharmaceutical companies, fuels high adoption rates. Furthermore, the region benefits from a well-established supply chain and advanced manufacturing infrastructure. However, the Asia-Pacific region is poised for significant growth, owing to rapidly expanding economies, rising disposable incomes, and increasing consumer awareness regarding hygiene and personal care.
- North America: High market share due to strong consumer demand and established manufacturing base.
- Asia-Pacific: Rapid growth potential driven by economic expansion and increasing consumer spending.
- Europe: Mature market with steady growth driven by innovation and sustainability.
- Key Drivers: Strong consumer demand, robust infrastructure, and favorable government regulations.
Barrier Tube Packaging Product Landscape
Barrier tube packaging encompasses a wide range of products, including those made from various materials like polyethylene (PE), polypropylene (PP), and laminates. These tubes are often equipped with features such as tamper-evident seals and dispensing mechanisms to enhance product safety and consumer experience. Innovations are focused on improving barrier properties against oxygen, moisture, and light, thus extending product shelf life and maintaining product integrity. Advanced printing techniques allow for customized branding and aesthetically appealing designs.
Key Drivers, Barriers & Challenges in Barrier Tube Packaging
Key Drivers: Growing demand from cosmetics & personal care, advancements in material science enabling improved barrier properties, increasing focus on sustainability and eco-friendly packaging, and the convenience offered by barrier tubes.
Key Challenges: Fluctuations in raw material prices, stringent regulations regarding material safety and recyclability, intense competition from alternative packaging options, and maintaining supply chain stability. For example, the xx% increase in resin prices during 2022 impacted manufacturing costs, leading to reduced margins for certain manufacturers.
Emerging Opportunities in Barrier Tube Packaging
Emerging opportunities include the penetration of untapped markets in developing economies, the development of biodegradable and compostable barrier tubes, the integration of smart packaging technologies (e.g., sensors), and the expansion into new application areas, such as food packaging and pharmaceutical delivery.
Growth Accelerators in the Barrier Tube Packaging Industry
Technological breakthroughs in material science and printing techniques, coupled with strategic partnerships between packaging manufacturers and brand owners, are driving long-term growth. Market expansion into new geographic regions and diversification into innovative applications, such as single-dose packaging, will also contribute to significant growth in the coming years.
Key Players Shaping the Barrier Tube Packaging Market
- Essel Propack
- Albea
- SUNA
- Rego
- Berry
- Kimpai
- BeautyStar
- Abdos
Notable Milestones in Barrier Tube Packaging Sector
- 2021: Introduction of a new recyclable barrier tube material by Essel Propack.
- 2022: Albea announces a major expansion of its manufacturing facility in Asia.
- 2023: Berry Global launches a sustainable barrier tube made from recycled content.
In-Depth Barrier Tube Packaging Market Outlook
The barrier tube packaging market is poised for continued growth, driven by factors such as increasing demand from consumer goods sectors, ongoing innovations in material science and technology, and a growing focus on sustainability. Companies that strategically leverage technological advancements, expand their product portfolios, and focus on meeting evolving consumer preferences are likely to achieve the strongest growth in the coming years. The market's potential is substantial, with significant opportunities in emerging economies and new applications.
Barrier Tube Packaging Segmentation
-
1. Application
- 1.1. Pharmaceutical industry
- 1.2. Food packaging
- 1.3. Personal care
- 1.4. Others
-
2. Types
- 2.1. Plastic
- 2.2. Metal
Barrier Tube Packaging Segmentation By Geography
-
1. North America
- 1.1. United States
- 1.2. Canada
- 1.3. Mexico
-
2. South America
- 2.1. Brazil
- 2.2. Argentina
- 2.3. Rest of South America
-
3. Europe
- 3.1. United Kingdom
- 3.2. Germany
- 3.3. France
- 3.4. Italy
- 3.5. Spain
- 3.6. Russia
- 3.7. Benelux
- 3.8. Nordics
- 3.9. Rest of Europe
-
4. Middle East & Africa
- 4.1. Turkey
- 4.2. Israel
- 4.3. GCC
- 4.4. North Africa
- 4.5. South Africa
- 4.6. Rest of Middle East & Africa
-
5. Asia Pacific
- 5.1. China
- 5.2. India
- 5.3. Japan
- 5.4. South Korea
- 5.5. ASEAN
- 5.6. Oceania
- 5.7. Rest of Asia Pacific

Barrier Tube Packaging Regional Market Share
Geographic Coverage of Barrier Tube Packaging
Barrier Tube Packaging REPORT HIGHLIGHTS
| Aspects | Details |
|---|---|
| Study Period | 2020-2034 |
| Base Year | 2025 |
| Estimated Year | 2026 |
| Forecast Period | 2026-2034 |
| Historical Period | 2020-2025 |
| Growth Rate | CAGR of 6.2% from 2020-2034 |
| Segmentation |
|
Table of Contents
- 1. Introduction
- 1.1. Research Scope
- 1.2. Market Segmentation
- 1.3. Research Methodology
- 1.4. Definitions and Assumptions
- 2. Executive Summary
- 2.1. Introduction
- 3. Market Dynamics
- 3.1. Introduction
- 3.2. Market Drivers
- 3.3. Market Restrains
- 3.4. Market Trends
- 4. Market Factor Analysis
- 4.1. Porters Five Forces
- 4.2. Supply/Value Chain
- 4.3. PESTEL analysis
- 4.4. Market Entropy
- 4.5. Patent/Trademark Analysis
- 5. Global Barrier Tube Packaging Analysis, Insights and Forecast, 2020-2032
- 5.1. Market Analysis, Insights and Forecast - by Application
- 5.1.1. Pharmaceutical industry
- 5.1.2. Food packaging
- 5.1.3. Personal care
- 5.1.4. Others
- 5.2. Market Analysis, Insights and Forecast - by Types
- 5.2.1. Plastic
- 5.2.2. Metal
- 5.3. Market Analysis, Insights and Forecast - by Region
- 5.3.1. North America
- 5.3.2. South America
- 5.3.3. Europe
- 5.3.4. Middle East & Africa
- 5.3.5. Asia Pacific
- 5.1. Market Analysis, Insights and Forecast - by Application
- 6. North America Barrier Tube Packaging Analysis, Insights and Forecast, 2020-2032
- 6.1. Market Analysis, Insights and Forecast - by Application
- 6.1.1. Pharmaceutical industry
- 6.1.2. Food packaging
- 6.1.3. Personal care
- 6.1.4. Others
- 6.2. Market Analysis, Insights and Forecast - by Types
- 6.2.1. Plastic
- 6.2.2. Metal
- 6.1. Market Analysis, Insights and Forecast - by Application
- 7. South America Barrier Tube Packaging Analysis, Insights and Forecast, 2020-2032
- 7.1. Market Analysis, Insights and Forecast - by Application
- 7.1.1. Pharmaceutical industry
- 7.1.2. Food packaging
- 7.1.3. Personal care
- 7.1.4. Others
- 7.2. Market Analysis, Insights and Forecast - by Types
- 7.2.1. Plastic
- 7.2.2. Metal
- 7.1. Market Analysis, Insights and Forecast - by Application
- 8. Europe Barrier Tube Packaging Analysis, Insights and Forecast, 2020-2032
- 8.1. Market Analysis, Insights and Forecast - by Application
- 8.1.1. Pharmaceutical industry
- 8.1.2. Food packaging
- 8.1.3. Personal care
- 8.1.4. Others
- 8.2. Market Analysis, Insights and Forecast - by Types
- 8.2.1. Plastic
- 8.2.2. Metal
- 8.1. Market Analysis, Insights and Forecast - by Application
- 9. Middle East & Africa Barrier Tube Packaging Analysis, Insights and Forecast, 2020-2032
- 9.1. Market Analysis, Insights and Forecast - by Application
- 9.1.1. Pharmaceutical industry
- 9.1.2. Food packaging
- 9.1.3. Personal care
- 9.1.4. Others
- 9.2. Market Analysis, Insights and Forecast - by Types
- 9.2.1. Plastic
- 9.2.2. Metal
- 9.1. Market Analysis, Insights and Forecast - by Application
- 10. Asia Pacific Barrier Tube Packaging Analysis, Insights and Forecast, 2020-2032
- 10.1. Market Analysis, Insights and Forecast - by Application
- 10.1.1. Pharmaceutical industry
- 10.1.2. Food packaging
- 10.1.3. Personal care
- 10.1.4. Others
- 10.2. Market Analysis, Insights and Forecast - by Types
- 10.2.1. Plastic
- 10.2.2. Metal
- 10.1. Market Analysis, Insights and Forecast - by Application
- 11. Competitive Analysis
- 11.1. Global Market Share Analysis 2025
- 11.2. Company Profiles
- 11.2.1 Essel Propack
- 11.2.1.1. Overview
- 11.2.1.2. Products
- 11.2.1.3. SWOT Analysis
- 11.2.1.4. Recent Developments
- 11.2.1.5. Financials (Based on Availability)
- 11.2.2 Albea
- 11.2.2.1. Overview
- 11.2.2.2. Products
- 11.2.2.3. SWOT Analysis
- 11.2.2.4. Recent Developments
- 11.2.2.5. Financials (Based on Availability)
- 11.2.3 SUNA
- 11.2.3.1. Overview
- 11.2.3.2. Products
- 11.2.3.3. SWOT Analysis
- 11.2.3.4. Recent Developments
- 11.2.3.5. Financials (Based on Availability)
- 11.2.4 Rego
- 11.2.4.1. Overview
- 11.2.4.2. Products
- 11.2.4.3. SWOT Analysis
- 11.2.4.4. Recent Developments
- 11.2.4.5. Financials (Based on Availability)
- 11.2.5 Berry
- 11.2.5.1. Overview
- 11.2.5.2. Products
- 11.2.5.3. SWOT Analysis
- 11.2.5.4. Recent Developments
- 11.2.5.5. Financials (Based on Availability)
- 11.2.6 Kimpai
- 11.2.6.1. Overview
- 11.2.6.2. Products
- 11.2.6.3. SWOT Analysis
- 11.2.6.4. Recent Developments
- 11.2.6.5. Financials (Based on Availability)
- 11.2.7 BeautyStar
- 11.2.7.1. Overview
- 11.2.7.2. Products
- 11.2.7.3. SWOT Analysis
- 11.2.7.4. Recent Developments
- 11.2.7.5. Financials (Based on Availability)
- 11.2.8 Abdos
- 11.2.8.1. Overview
- 11.2.8.2. Products
- 11.2.8.3. SWOT Analysis
- 11.2.8.4. Recent Developments
- 11.2.8.5. Financials (Based on Availability)
- 11.2.1 Essel Propack
List of Figures
- Figure 1: Global Barrier Tube Packaging Revenue Breakdown (undefined, %) by Region 2025 & 2033
- Figure 2: North America Barrier Tube Packaging Revenue (undefined), by Application 2025 & 2033
- Figure 3: North America Barrier Tube Packaging Revenue Share (%), by Application 2025 & 2033
- Figure 4: North America Barrier Tube Packaging Revenue (undefined), by Types 2025 & 2033
- Figure 5: North America Barrier Tube Packaging Revenue Share (%), by Types 2025 & 2033
- Figure 6: North America Barrier Tube Packaging Revenue (undefined), by Country 2025 & 2033
- Figure 7: North America Barrier Tube Packaging Revenue Share (%), by Country 2025 & 2033
- Figure 8: South America Barrier Tube Packaging Revenue (undefined), by Application 2025 & 2033
- Figure 9: South America Barrier Tube Packaging Revenue Share (%), by Application 2025 & 2033
- Figure 10: South America Barrier Tube Packaging Revenue (undefined), by Types 2025 & 2033
- Figure 11: South America Barrier Tube Packaging Revenue Share (%), by Types 2025 & 2033
- Figure 12: South America Barrier Tube Packaging Revenue (undefined), by Country 2025 & 2033
- Figure 13: South America Barrier Tube Packaging Revenue Share (%), by Country 2025 & 2033
- Figure 14: Europe Barrier Tube Packaging Revenue (undefined), by Application 2025 & 2033
- Figure 15: Europe Barrier Tube Packaging Revenue Share (%), by Application 2025 & 2033
- Figure 16: Europe Barrier Tube Packaging Revenue (undefined), by Types 2025 & 2033
- Figure 17: Europe Barrier Tube Packaging Revenue Share (%), by Types 2025 & 2033
- Figure 18: Europe Barrier Tube Packaging Revenue (undefined), by Country 2025 & 2033
- Figure 19: Europe Barrier Tube Packaging Revenue Share (%), by Country 2025 & 2033
- Figure 20: Middle East & Africa Barrier Tube Packaging Revenue (undefined), by Application 2025 & 2033
- Figure 21: Middle East & Africa Barrier Tube Packaging Revenue Share (%), by Application 2025 & 2033
- Figure 22: Middle East & Africa Barrier Tube Packaging Revenue (undefined), by Types 2025 & 2033
- Figure 23: Middle East & Africa Barrier Tube Packaging Revenue Share (%), by Types 2025 & 2033
- Figure 24: Middle East & Africa Barrier Tube Packaging Revenue (undefined), by Country 2025 & 2033
- Figure 25: Middle East & Africa Barrier Tube Packaging Revenue Share (%), by Country 2025 & 2033
- Figure 26: Asia Pacific Barrier Tube Packaging Revenue (undefined), by Application 2025 & 2033
- Figure 27: Asia Pacific Barrier Tube Packaging Revenue Share (%), by Application 2025 & 2033
- Figure 28: Asia Pacific Barrier Tube Packaging Revenue (undefined), by Types 2025 & 2033
- Figure 29: Asia Pacific Barrier Tube Packaging Revenue Share (%), by Types 2025 & 2033
- Figure 30: Asia Pacific Barrier Tube Packaging Revenue (undefined), by Country 2025 & 2033
- Figure 31: Asia Pacific Barrier Tube Packaging Revenue Share (%), by Country 2025 & 2033
List of Tables
- Table 1: Global Barrier Tube Packaging Revenue undefined Forecast, by Application 2020 & 2033
- Table 2: Global Barrier Tube Packaging Revenue undefined Forecast, by Types 2020 & 2033
- Table 3: Global Barrier Tube Packaging Revenue undefined Forecast, by Region 2020 & 2033
- Table 4: Global Barrier Tube Packaging Revenue undefined Forecast, by Application 2020 & 2033
- Table 5: Global Barrier Tube Packaging Revenue undefined Forecast, by Types 2020 & 2033
- Table 6: Global Barrier Tube Packaging Revenue undefined Forecast, by Country 2020 & 2033
- Table 7: United States Barrier Tube Packaging Revenue (undefined) Forecast, by Application 2020 & 2033
- Table 8: Canada Barrier Tube Packaging Revenue (undefined) Forecast, by Application 2020 & 2033
- Table 9: Mexico Barrier Tube Packaging Revenue (undefined) Forecast, by Application 2020 & 2033
- Table 10: Global Barrier Tube Packaging Revenue undefined Forecast, by Application 2020 & 2033
- Table 11: Global Barrier Tube Packaging Revenue undefined Forecast, by Types 2020 & 2033
- Table 12: Global Barrier Tube Packaging Revenue undefined Forecast, by Country 2020 & 2033
- Table 13: Brazil Barrier Tube Packaging Revenue (undefined) Forecast, by Application 2020 & 2033
- Table 14: Argentina Barrier Tube Packaging Revenue (undefined) Forecast, by Application 2020 & 2033
- Table 15: Rest of South America Barrier Tube Packaging Revenue (undefined) Forecast, by Application 2020 & 2033
- Table 16: Global Barrier Tube Packaging Revenue undefined Forecast, by Application 2020 & 2033
- Table 17: Global Barrier Tube Packaging Revenue undefined Forecast, by Types 2020 & 2033
- Table 18: Global Barrier Tube Packaging Revenue undefined Forecast, by Country 2020 & 2033
- Table 19: United Kingdom Barrier Tube Packaging Revenue (undefined) Forecast, by Application 2020 & 2033
- Table 20: Germany Barrier Tube Packaging Revenue (undefined) Forecast, by Application 2020 & 2033
- Table 21: France Barrier Tube Packaging Revenue (undefined) Forecast, by Application 2020 & 2033
- Table 22: Italy Barrier Tube Packaging Revenue (undefined) Forecast, by Application 2020 & 2033
- Table 23: Spain Barrier Tube Packaging Revenue (undefined) Forecast, by Application 2020 & 2033
- Table 24: Russia Barrier Tube Packaging Revenue (undefined) Forecast, by Application 2020 & 2033
- Table 25: Benelux Barrier Tube Packaging Revenue (undefined) Forecast, by Application 2020 & 2033
- Table 26: Nordics Barrier Tube Packaging Revenue (undefined) Forecast, by Application 2020 & 2033
- Table 27: Rest of Europe Barrier Tube Packaging Revenue (undefined) Forecast, by Application 2020 & 2033
- Table 28: Global Barrier Tube Packaging Revenue undefined Forecast, by Application 2020 & 2033
- Table 29: Global Barrier Tube Packaging Revenue undefined Forecast, by Types 2020 & 2033
- Table 30: Global Barrier Tube Packaging Revenue undefined Forecast, by Country 2020 & 2033
- Table 31: Turkey Barrier Tube Packaging Revenue (undefined) Forecast, by Application 2020 & 2033
- Table 32: Israel Barrier Tube Packaging Revenue (undefined) Forecast, by Application 2020 & 2033
- Table 33: GCC Barrier Tube Packaging Revenue (undefined) Forecast, by Application 2020 & 2033
- Table 34: North Africa Barrier Tube Packaging Revenue (undefined) Forecast, by Application 2020 & 2033
- Table 35: South Africa Barrier Tube Packaging Revenue (undefined) Forecast, by Application 2020 & 2033
- Table 36: Rest of Middle East & Africa Barrier Tube Packaging Revenue (undefined) Forecast, by Application 2020 & 2033
- Table 37: Global Barrier Tube Packaging Revenue undefined Forecast, by Application 2020 & 2033
- Table 38: Global Barrier Tube Packaging Revenue undefined Forecast, by Types 2020 & 2033
- Table 39: Global Barrier Tube Packaging Revenue undefined Forecast, by Country 2020 & 2033
- Table 40: China Barrier Tube Packaging Revenue (undefined) Forecast, by Application 2020 & 2033
- Table 41: India Barrier Tube Packaging Revenue (undefined) Forecast, by Application 2020 & 2033
- Table 42: Japan Barrier Tube Packaging Revenue (undefined) Forecast, by Application 2020 & 2033
- Table 43: South Korea Barrier Tube Packaging Revenue (undefined) Forecast, by Application 2020 & 2033
- Table 44: ASEAN Barrier Tube Packaging Revenue (undefined) Forecast, by Application 2020 & 2033
- Table 45: Oceania Barrier Tube Packaging Revenue (undefined) Forecast, by Application 2020 & 2033
- Table 46: Rest of Asia Pacific Barrier Tube Packaging Revenue (undefined) Forecast, by Application 2020 & 2033
Frequently Asked Questions
1. What is the projected Compound Annual Growth Rate (CAGR) of the Barrier Tube Packaging?
The projected CAGR is approximately 6.2%.
2. Which companies are prominent players in the Barrier Tube Packaging?
Key companies in the market include Essel Propack, Albea, SUNA, Rego, Berry, Kimpai, BeautyStar, Abdos.
3. What are the main segments of the Barrier Tube Packaging?
The market segments include Application, Types.
4. Can you provide details about the market size?
The market size is estimated to be USD XXX N/A as of 2022.
5. What are some drivers contributing to market growth?
N/A
6. What are the notable trends driving market growth?
N/A
7. Are there any restraints impacting market growth?
N/A
8. Can you provide examples of recent developments in the market?
N/A
9. What pricing options are available for accessing the report?
Pricing options include single-user, multi-user, and enterprise licenses priced at USD 3350.00, USD 5025.00, and USD 6700.00 respectively.
10. Is the market size provided in terms of value or volume?
The market size is provided in terms of value, measured in N/A.
11. Are there any specific market keywords associated with the report?
Yes, the market keyword associated with the report is "Barrier Tube Packaging," which aids in identifying and referencing the specific market segment covered.
12. How do I determine which pricing option suits my needs best?
The pricing options vary based on user requirements and access needs. Individual users may opt for single-user licenses, while businesses requiring broader access may choose multi-user or enterprise licenses for cost-effective access to the report.
13. Are there any additional resources or data provided in the Barrier Tube Packaging report?
While the report offers comprehensive insights, it's advisable to review the specific contents or supplementary materials provided to ascertain if additional resources or data are available.
14. How can I stay updated on further developments or reports in the Barrier Tube Packaging?
To stay informed about further developments, trends, and reports in the Barrier Tube Packaging, consider subscribing to industry newsletters, following relevant companies and organizations, or regularly checking reputable industry news sources and publications.
Methodology
Step 1 - Identification of Relevant Samples Size from Population Database


Step 2 - Approaches for Defining Global Market Size (Value, Volume* & Price*)

Note*: In applicable scenarios
Step 3 - Data Sources
Primary Research
- Web Analytics
- Survey Reports
- Research Institute
- Latest Research Reports
- Opinion Leaders
Secondary Research
- Annual Reports
- White Paper
- Latest Press Release
- Industry Association
- Paid Database
- Investor Presentations

Step 4 - Data Triangulation
Involves using different sources of information in order to increase the validity of a study
These sources are likely to be stakeholders in a program - participants, other researchers, program staff, other community members, and so on.
Then we put all data in single framework & apply various statistical tools to find out the dynamic on the market.
During the analysis stage, feedback from the stakeholder groups would be compared to determine areas of agreement as well as areas of divergence