

Key Insights
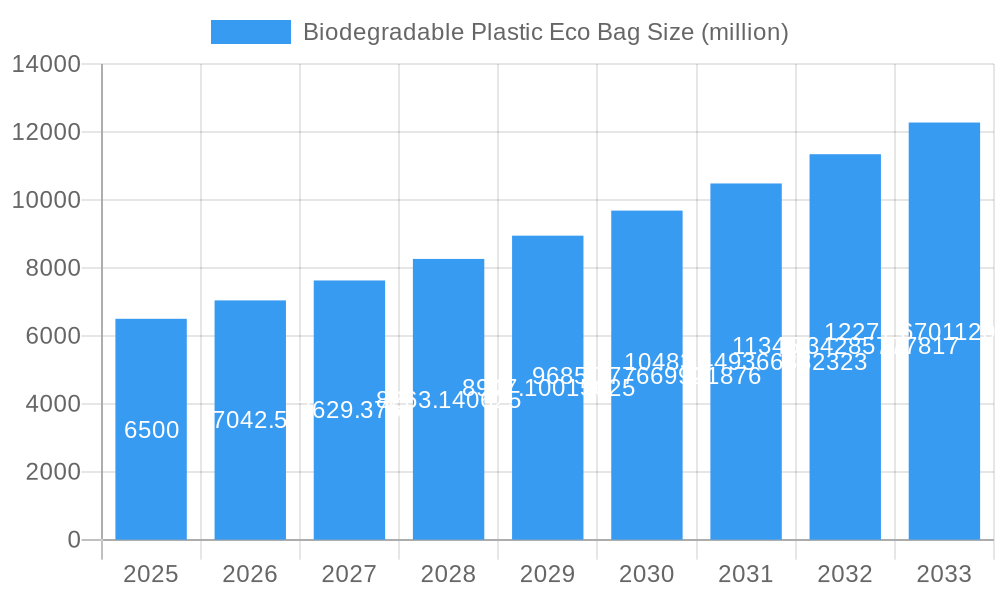
The global biodegradable plastic eco bag market is poised for significant expansion, projected to reach a substantial market size of approximately USD 6,500 million by 2025, with a robust Compound Annual Growth Rate (CAGR) of 8.5% anticipated from 2025 to 2033. This remarkable growth is propelled by a confluence of escalating environmental consciousness among consumers and stringent government regulations worldwide that favor sustainable packaging solutions. The increasing demand for alternatives to conventional petroleum-based plastics, driven by concerns over plastic pollution and its detrimental impact on ecosystems, is a primary catalyst. Furthermore, the growing adoption of these eco-friendly bags across key application segments, including supermarkets, pharmacies, and food stores, underscores their growing indispensability in everyday retail operations. Innovations in material science, leading to the development of advanced biodegradable materials like Polylactic acid (PLA), Polyhydroxyalkanoate (PHA), and Starch Blends, are also contributing to market dynamism by offering enhanced performance and cost-effectiveness.
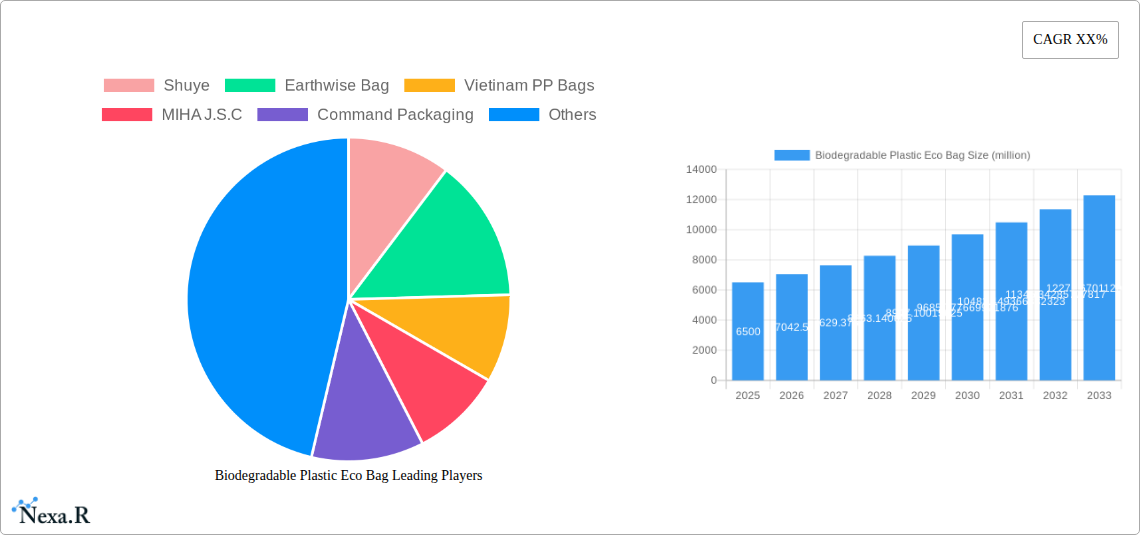
Biodegradable Plastic Eco Bag Market Size (In Billion)
Despite the promising outlook, the market faces certain restraints, primarily the higher initial cost of production compared to conventional plastic bags and challenges in widespread consumer adoption and disposal infrastructure. However, ongoing technological advancements, economies of scale, and increasing consumer education are steadily mitigating these challenges. The market is segmented by type into Polylactic acid (PLA), Polyhydroxyalkanoate (PHA), Starch Blends, and Others, with PLA and PHA segments showing particularly strong growth potential due to their superior biodegradability and performance characteristics. Geographically, the Asia Pacific region, led by China and India, is emerging as a dominant force, driven by a large population, increasing disposable income, and supportive government initiatives promoting green manufacturing. North America and Europe also represent significant markets, with established regulatory frameworks and a strong consumer base demanding sustainable products. Key players like BASF, Novolex, and BioBag are actively investing in research and development, expanding production capacities, and forging strategic partnerships to capture a larger market share in this rapidly evolving sector.
Biodegradable Plastic Eco Bag Company Market Share
This in-depth market report provides a thorough analysis of the global Biodegradable Plastic Eco Bag market, encompassing historical trends, current dynamics, and future projections. Designed for industry professionals, investors, and stakeholders, it offers critical insights into market size, growth drivers, regional dominance, competitive landscape, and emerging opportunities.
Biodegradable Plastic Eco Bag Market Dynamics & Structure
The Biodegradable Plastic Eco Bag market is characterized by a moderate to highly concentrated structure, with a blend of large established players and smaller niche manufacturers. BASF, Novolex, and Shuye are prominent entities contributing significantly to market share, estimated at over 65% combined. Technological innovation is a key driver, with continuous advancements in material science, particularly in Polylactic acid (PLA) and Polyhydroxyalkanoate (PHA), improving biodegradability rates and physical properties. Regulatory frameworks are increasingly stringent globally, with bans on single-use plastics and mandates for sustainable packaging pushing market adoption. Competitive product substitutes include reusable non-plastic bags and compostable paper bags, presenting a challenge for widespread biodegradable plastic bag penetration. End-user demographics are shifting towards environmentally conscious consumers and businesses, particularly within the Supermarket and Pharmacies and Food Stores segments, driving demand. Mergers and Acquisitions (M&A) activity is present but not dominant, with a few strategic acquisitions aimed at expanding product portfolios or market reach. For instance, a recent acquisition in the Starch Blends segment by a major player aimed to enhance their sustainable offerings. Innovation barriers include the higher cost of biodegradable materials compared to conventional plastics and the need for robust industrial composting infrastructure.
- Market Concentration: Moderate to High, with top players holding a significant market share.
- Technological Innovation: Driven by advancements in PLA, PHA, and Starch Blends for improved performance.
- Regulatory Frameworks: Increasing government bans and mandates for sustainable packaging.
- Competitive Substitutes: Reusable non-plastic bags and paper bags pose a competitive threat.
- End-User Demographics: Growing demand from environmentally aware consumers and businesses.
- M&A Trends: Strategic acquisitions for portfolio expansion and market reach.
- Innovation Barriers: Higher material costs and underdeveloped composting infrastructure.
Biodegradable Plastic Eco Bag Growth Trends & Insights
The global Biodegradable Plastic Eco Bag market is poised for robust growth, driven by a confluence of increasing environmental awareness, stringent government regulations, and corporate sustainability initiatives. The market size is projected to expand significantly from approximately $2,500 million units in the base year 2025 to an estimated $6,800 million units by the end of the forecast period in 2033, exhibiting a Compound Annual Growth Rate (CAGR) of approximately 13.5% during the forecast period. Adoption rates are accelerating across various regions, fueled by a growing understanding of the environmental impact of traditional plastics. Technological disruptions, such as the development of more cost-effective and higher-performing biodegradable polymers, are playing a crucial role in overcoming initial market entry barriers. Consumer behavior is undergoing a noticeable shift, with a greater preference for products and packaging that align with their values of environmental responsibility. This sentiment is translating into increased demand for biodegradable eco bags in retail settings, particularly in the Supermarket sector, where a substantial portion of consumers make purchasing decisions based on sustainability. Furthermore, the Pharmacies and Food Stores segment is witnessing a rise in the adoption of biodegradable bags due to health-conscious consumers increasingly seeking eco-friendly options. The "Other" application segment, encompassing various niche uses and industrial applications, is also contributing to overall market expansion as businesses across diverse sectors aim to reduce their environmental footprint. The study period of 2019–2033, with a focus on the base year of 2025 and a forecast period from 2025–2033, allows for a comprehensive understanding of market evolution. The historical period of 2019–2024 provides a foundational understanding of early market trends and adoption patterns, which are essential for projecting future growth trajectories. The estimated market size for 2025 is valued at xx million units, with a projected growth to xx million units by 2033. The market penetration is expected to increase from xx% in 2025 to xx% by 2033, indicating a substantial shift towards biodegradable alternatives. This upward trend is further supported by ongoing research and development in material science, which promises even more sustainable and economically viable biodegradable plastic solutions in the coming years. The increasing availability of biodegradable plastic eco bags in various sizes, shapes, and functionalities is catering to a wider range of consumer needs and preferences, thereby accelerating market adoption.
Dominant Regions, Countries, or Segments in Biodegradable Plastic Eco Bag
The Supermarket application segment is emerging as a dominant force in the global Biodegradable Plastic Eco Bag market, accounting for an estimated 45% of the total market share in the base year 2025. This dominance is driven by several interconnected factors, including high consumer traffic, increasing regulatory pressures on single-use plastics in retail environments, and a growing consumer demand for sustainable shopping experiences. Major supermarket chains are actively phasing out conventional plastic bags and integrating biodegradable alternatives into their operations, driven by both corporate social responsibility goals and the desire to appeal to an environmentally conscious customer base. Countries with robust retail sectors and proactive environmental policies, such as those in Europe and North America, are leading this transition. For instance, countries like Germany, France, and Canada have implemented significant legislation that directly impacts the use of single-use plastics, thereby boosting the demand for biodegradable eco bags. The Polylactic acid (PLA) type of biodegradable plastic also holds a significant leadership position, representing approximately 50% of the market share within the biodegradable bag types. PLA's popularity stems from its versatility, good printability, and a relatively well-established production infrastructure. It offers a balance of biodegradability and functional performance suitable for various supermarket applications. The growth potential for PLA bags is substantial as production scales and costs decrease. In contrast, Polyhydroxyalkanoate (PHA), while offering superior biodegradability under diverse conditions, is currently a niche player due to higher production costs, though its market share is projected to grow substantially in the coming years. Starch Blends represent another important category, contributing around 25% of the market share, often favored for their cost-effectiveness and accessibility. The "Others" type, encompassing various composite materials, holds a smaller but evolving share. The economic policies in leading regions, such as subsidies for sustainable manufacturing and tax incentives for businesses adopting eco-friendly packaging, further accelerate the adoption of biodegradable bags in supermarkets. Infrastructure development, particularly the establishment of widespread industrial composting facilities, is also crucial for the successful lifecycle management of these bags, indirectly supporting their market dominance. The market share of biodegradable plastic eco bags within the supermarket sector is expected to climb from approximately 28% in 2025 to over 55% by 2033. This growth is anticipated to be driven by continued innovation in material science, leading to more durable and affordable biodegradable bag options, and sustained regulatory pressure on conventional plastic usage.
- Dominant Application Segment: Supermarket (estimated 45% market share in 2025).
- Key Drivers for Supermarket Dominance: High consumer traffic, regulatory pressure, consumer demand for sustainability.
- Leading Regions/Countries: Europe and North America, due to proactive environmental policies.
- Dominant Biodegradable Bag Type: Polylactic acid (PLA) (estimated 50% market share).
- Growth Potential for PLA: Significant, driven by scalability and cost reduction.
- Other Notable Segments: Starch Blends (approx. 25% market share), Polyhydroxyalkanoate (PHA), and Others.
- Supporting Factors: Favorable economic policies, infrastructure development (composting facilities).
Biodegradable Plastic Eco Bag Product Landscape
The Biodegradable Plastic Eco Bag market showcases a dynamic product landscape characterized by continuous innovation in material composition and functional design. Key product developments include enhanced tensile strength, improved moisture resistance, and faster decomposition rates, catering to diverse application needs. For Supermarket applications, bags are increasingly designed with reinforced handles and larger capacities to accommodate substantial grocery loads, while maintaining their eco-friendly credentials. In the Pharmacies and Food Stores segment, smaller, more specialized biodegradable bags with transparent viewing panels are emerging, facilitating easy identification of contents while offering superior biodegradability. Polylactic acid (PLA)-based bags remain a cornerstone, offering excellent printability for branding and marketing purposes, alongside a good biodegradability profile. Innovations in PLA formulations are leading to improved heat resistance and flexibility. Polyhydroxyalkanoate (PHA) is gaining traction for its ability to biodegrade in a wider range of environments, including marine and soil, making it ideal for applications where waste management infrastructure is less developed. Starch Blends are being refined to overcome challenges related to moisture sensitivity and to offer competitive pricing, making them an attractive option for bulk purchases. The unique selling propositions of these products lie in their verifiable biodegradability, reduced carbon footprint, and compliance with evolving environmental regulations, making them increasingly sought-after alternatives to conventional plastics.
Key Drivers, Barriers & Challenges in Biodegradable Plastic Eco Bag
Key Drivers: The Biodegradable Plastic Eco Bag market is propelled by a confluence of powerful forces. Growing global environmental consciousness and consumer demand for sustainable products are primary drivers, pushing individuals and businesses towards eco-friendly alternatives. Stringent government regulations and bans on single-use conventional plastics worldwide are creating significant market opportunities and mandating shifts in packaging strategies. Corporate sustainability initiatives and a desire to enhance brand reputation by adopting green practices are also fueling demand. Technological advancements in biodegradable polymer research, leading to improved performance and cost-effectiveness, are crucial enablers for market expansion. The increasing availability of raw materials for bioplastics, such as corn starch and sugarcane, supports production scalability.
Barriers & Challenges: Despite the positive trajectory, the market faces significant challenges. The higher production cost of biodegradable plastics compared to conventional petroleum-based plastics remains a substantial barrier to widespread adoption, particularly for price-sensitive consumers and businesses. Inadequate or inconsistent industrial composting infrastructure in many regions hinders the effective disposal and biodegradation of these bags, leading to potential public perception issues. Supply chain complexities and the need for specialized manufacturing processes can also present hurdles. Competition from other sustainable alternatives, such as reusable fabric bags and paper bags, offers consumers choices that may sometimes be perceived as more convenient or cost-effective. Ensuring consistent quality and performance across different biodegradable materials and manufacturers is also a challenge. Regulatory inconsistencies across different countries can create complexity for global manufacturers.
Emerging Opportunities in Biodegradable Plastic Eco Bag
Emerging opportunities in the Biodegradable Plastic Eco Bag sector lie in the untapped potential of developing economies, where environmental regulations are still nascent but consumer awareness is growing rapidly. The development of advanced biodegradable materials with enhanced functionalities, such as increased durability and superior barrier properties for food packaging, presents a significant avenue for growth. Innovative applications beyond retail, such as in the agricultural sector for mulching films or in the medical field for specialized packaging, offer new market frontiers. The increasing trend of 'plastic-free' commitments by major corporations is creating a strong demand for truly sustainable packaging solutions, including biodegradable bags. Furthermore, the integration of smart technologies for tracking and verifying biodegradability claims could build greater consumer trust and open up new market segments.
Growth Accelerators in the Biodegradable Plastic Eco Bag Industry
Several key catalysts are accelerating the growth of the Biodegradable Plastic Eco Bag industry. Breakthroughs in biopolymer research, focusing on cost reduction and performance enhancement, are critical. Strategic partnerships between material manufacturers, bag producers, and large retailers are crucial for scaling production and distribution. Market expansion into emerging economies with a growing middle class and increasing environmental consciousness represents a significant growth avenue. Government incentives, subsidies for bioplastic production, and supportive policies for composting infrastructure development act as powerful growth accelerators. The development of standardized biodegradability certifications and labeling will further boost consumer confidence and drive adoption.
Key Players Shaping the Biodegradable Plastic Eco Bag Market
- Shuye
- Earthwise Bag
- Vietnam PP Bags
- MIHA J.S.C
- Command Packaging
- Vina Packing Films
- PVN
- 1 Bag at a Time
- Sapphirevn
- Green Bag
- Mixed Bag Designs
- True Reusable Bags
- Euro Bags
- BAGEST
- Envi Reusable Bags
- ChicoBag
- BioBag
- Novolex
- EnviGreen
- BASF
- Plastiroll
- Sahachit
- Xtex Polythene
- RKW Group
- Abbey Polythene
- Sarah Bio Plast
Notable Milestones in Biodegradable Plastic Eco Bag Sector
- 2019: Increased regulatory pressure in Europe leads to a surge in biodegradable bag adoption by major retailers.
- 2020: BASF announces significant investment in PHA production capacity to meet growing demand.
- 2021: Shuye launches a new line of high-strength biodegradable PLA bags tailored for heavy-duty supermarket use.
- 2022: Earthwise Bag secures a major partnership with a national grocery chain for exclusive biodegradable bag supply.
- 2023: Governments in North America introduce stricter single-use plastic bans, accelerating market growth.
- 2024: Advancements in starch-based bioplastics lead to more affordable and water-resistant bag options.
- 2025 (Estimated): Significant growth in PHA and advanced starch blend bags due to improved performance and cost efficiencies.
- 2026-2033 (Forecast): Continued innovation in biodegradable materials, expansion of composting infrastructure, and increasing consumer preference for sustainable packaging driving consistent market expansion.
In-Depth Biodegradable Plastic Eco Bag Market Outlook
The future of the Biodegradable Plastic Eco Bag market appears exceptionally promising, driven by a powerful combination of escalating environmental concerns and supportive regulatory landscapes. Growth accelerators such as groundbreaking advancements in biopolymer technology, promising cost reductions, and enhanced material performance will continue to shape the market. Strategic alliances between key industry players will be instrumental in optimizing supply chains and expanding market reach globally. The increasing emphasis on circular economy principles and corporate social responsibility will further fuel the demand for sustainable packaging solutions. Emerging markets present substantial untapped potential for growth, as developing nations increasingly adopt environmentally conscious policies. The market is anticipated to witness sustained growth, driven by innovation, regulatory support, and a fundamental shift in consumer and corporate values towards ecological sustainability.
Biodegradable Plastic Eco Bag Segmentation
-
1. Application
- 1.1. Supermarket
- 1.2. Pharmacies and Food Stores
- 1.3. Other
-
2. Types
- 2.1. Polylactic acid (PLA)
- 2.2. Polyhydroxyalkanoate (PHA)
- 2.3. Starch Blends
- 2.4. Others
Biodegradable Plastic Eco Bag Segmentation By Geography
-
1. North America
- 1.1. United States
- 1.2. Canada
- 1.3. Mexico
-
2. South America
- 2.1. Brazil
- 2.2. Argentina
- 2.3. Rest of South America
-
3. Europe
- 3.1. United Kingdom
- 3.2. Germany
- 3.3. France
- 3.4. Italy
- 3.5. Spain
- 3.6. Russia
- 3.7. Benelux
- 3.8. Nordics
- 3.9. Rest of Europe
-
4. Middle East & Africa
- 4.1. Turkey
- 4.2. Israel
- 4.3. GCC
- 4.4. North Africa
- 4.5. South Africa
- 4.6. Rest of Middle East & Africa
-
5. Asia Pacific
- 5.1. China
- 5.2. India
- 5.3. Japan
- 5.4. South Korea
- 5.5. ASEAN
- 5.6. Oceania
- 5.7. Rest of Asia Pacific
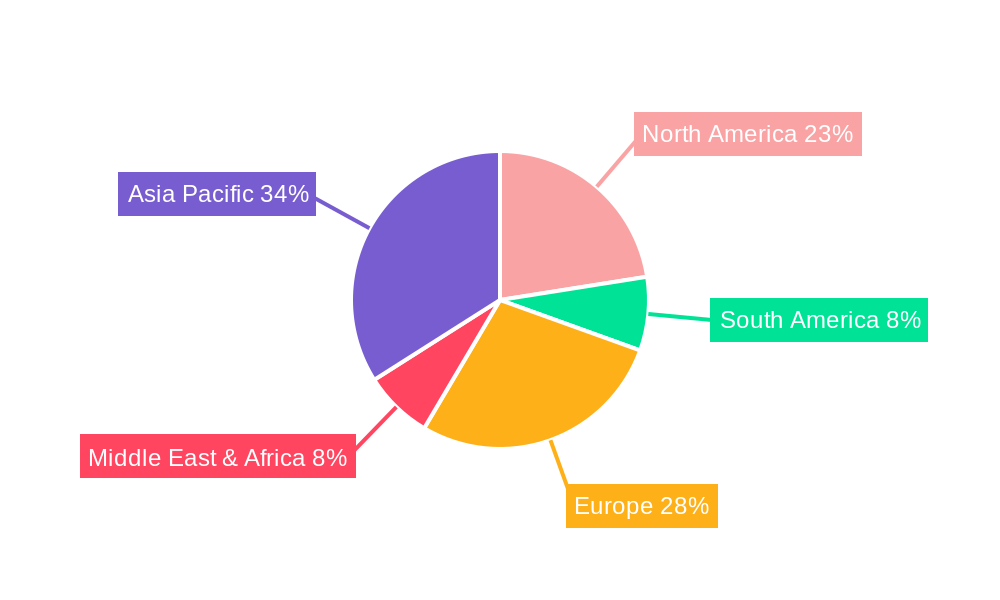
Biodegradable Plastic Eco Bag Regional Market Share
Geographic Coverage of Biodegradable Plastic Eco Bag
Biodegradable Plastic Eco Bag REPORT HIGHLIGHTS
| Aspects | Details |
|---|---|
| Study Period | 2020-2034 |
| Base Year | 2025 |
| Estimated Year | 2026 |
| Forecast Period | 2026-2034 |
| Historical Period | 2020-2025 |
| Growth Rate | CAGR of XX% from 2020-2034 |
| Segmentation |
|
Table of Contents
- 1. Introduction
- 1.1. Research Scope
- 1.2. Market Segmentation
- 1.3. Research Methodology
- 1.4. Definitions and Assumptions
- 2. Executive Summary
- 2.1. Introduction
- 3. Market Dynamics
- 3.1. Introduction
- 3.2. Market Drivers
- 3.3. Market Restrains
- 3.4. Market Trends
- 4. Market Factor Analysis
- 4.1. Porters Five Forces
- 4.2. Supply/Value Chain
- 4.3. PESTEL analysis
- 4.4. Market Entropy
- 4.5. Patent/Trademark Analysis
- 5. Global Biodegradable Plastic Eco Bag Analysis, Insights and Forecast, 2020-2032
- 5.1. Market Analysis, Insights and Forecast - by Application
- 5.1.1. Supermarket
- 5.1.2. Pharmacies and Food Stores
- 5.1.3. Other
- 5.2. Market Analysis, Insights and Forecast - by Types
- 5.2.1. Polylactic acid (PLA)
- 5.2.2. Polyhydroxyalkanoate (PHA)
- 5.2.3. Starch Blends
- 5.2.4. Others
- 5.3. Market Analysis, Insights and Forecast - by Region
- 5.3.1. North America
- 5.3.2. South America
- 5.3.3. Europe
- 5.3.4. Middle East & Africa
- 5.3.5. Asia Pacific
- 5.1. Market Analysis, Insights and Forecast - by Application
- 6. North America Biodegradable Plastic Eco Bag Analysis, Insights and Forecast, 2020-2032
- 6.1. Market Analysis, Insights and Forecast - by Application
- 6.1.1. Supermarket
- 6.1.2. Pharmacies and Food Stores
- 6.1.3. Other
- 6.2. Market Analysis, Insights and Forecast - by Types
- 6.2.1. Polylactic acid (PLA)
- 6.2.2. Polyhydroxyalkanoate (PHA)
- 6.2.3. Starch Blends
- 6.2.4. Others
- 6.1. Market Analysis, Insights and Forecast - by Application
- 7. South America Biodegradable Plastic Eco Bag Analysis, Insights and Forecast, 2020-2032
- 7.1. Market Analysis, Insights and Forecast - by Application
- 7.1.1. Supermarket
- 7.1.2. Pharmacies and Food Stores
- 7.1.3. Other
- 7.2. Market Analysis, Insights and Forecast - by Types
- 7.2.1. Polylactic acid (PLA)
- 7.2.2. Polyhydroxyalkanoate (PHA)
- 7.2.3. Starch Blends
- 7.2.4. Others
- 7.1. Market Analysis, Insights and Forecast - by Application
- 8. Europe Biodegradable Plastic Eco Bag Analysis, Insights and Forecast, 2020-2032
- 8.1. Market Analysis, Insights and Forecast - by Application
- 8.1.1. Supermarket
- 8.1.2. Pharmacies and Food Stores
- 8.1.3. Other
- 8.2. Market Analysis, Insights and Forecast - by Types
- 8.2.1. Polylactic acid (PLA)
- 8.2.2. Polyhydroxyalkanoate (PHA)
- 8.2.3. Starch Blends
- 8.2.4. Others
- 8.1. Market Analysis, Insights and Forecast - by Application
- 9. Middle East & Africa Biodegradable Plastic Eco Bag Analysis, Insights and Forecast, 2020-2032
- 9.1. Market Analysis, Insights and Forecast - by Application
- 9.1.1. Supermarket
- 9.1.2. Pharmacies and Food Stores
- 9.1.3. Other
- 9.2. Market Analysis, Insights and Forecast - by Types
- 9.2.1. Polylactic acid (PLA)
- 9.2.2. Polyhydroxyalkanoate (PHA)
- 9.2.3. Starch Blends
- 9.2.4. Others
- 9.1. Market Analysis, Insights and Forecast - by Application
- 10. Asia Pacific Biodegradable Plastic Eco Bag Analysis, Insights and Forecast, 2020-2032
- 10.1. Market Analysis, Insights and Forecast - by Application
- 10.1.1. Supermarket
- 10.1.2. Pharmacies and Food Stores
- 10.1.3. Other
- 10.2. Market Analysis, Insights and Forecast - by Types
- 10.2.1. Polylactic acid (PLA)
- 10.2.2. Polyhydroxyalkanoate (PHA)
- 10.2.3. Starch Blends
- 10.2.4. Others
- 10.1. Market Analysis, Insights and Forecast - by Application
- 11. Competitive Analysis
- 11.1. Global Market Share Analysis 2025
- 11.2. Company Profiles
- 11.2.1 Shuye
- 11.2.1.1. Overview
- 11.2.1.2. Products
- 11.2.1.3. SWOT Analysis
- 11.2.1.4. Recent Developments
- 11.2.1.5. Financials (Based on Availability)
- 11.2.2 Earthwise Bag
- 11.2.2.1. Overview
- 11.2.2.2. Products
- 11.2.2.3. SWOT Analysis
- 11.2.2.4. Recent Developments
- 11.2.2.5. Financials (Based on Availability)
- 11.2.3 Vietinam PP Bags
- 11.2.3.1. Overview
- 11.2.3.2. Products
- 11.2.3.3. SWOT Analysis
- 11.2.3.4. Recent Developments
- 11.2.3.5. Financials (Based on Availability)
- 11.2.4 MIHA J.S.C
- 11.2.4.1. Overview
- 11.2.4.2. Products
- 11.2.4.3. SWOT Analysis
- 11.2.4.4. Recent Developments
- 11.2.4.5. Financials (Based on Availability)
- 11.2.5 Command Packaging
- 11.2.5.1. Overview
- 11.2.5.2. Products
- 11.2.5.3. SWOT Analysis
- 11.2.5.4. Recent Developments
- 11.2.5.5. Financials (Based on Availability)
- 11.2.6 Vina Packing Films
- 11.2.6.1. Overview
- 11.2.6.2. Products
- 11.2.6.3. SWOT Analysis
- 11.2.6.4. Recent Developments
- 11.2.6.5. Financials (Based on Availability)
- 11.2.7 PVN
- 11.2.7.1. Overview
- 11.2.7.2. Products
- 11.2.7.3. SWOT Analysis
- 11.2.7.4. Recent Developments
- 11.2.7.5. Financials (Based on Availability)
- 11.2.8 1 Bag at a Time
- 11.2.8.1. Overview
- 11.2.8.2. Products
- 11.2.8.3. SWOT Analysis
- 11.2.8.4. Recent Developments
- 11.2.8.5. Financials (Based on Availability)
- 11.2.9 Sapphirevn
- 11.2.9.1. Overview
- 11.2.9.2. Products
- 11.2.9.3. SWOT Analysis
- 11.2.9.4. Recent Developments
- 11.2.9.5. Financials (Based on Availability)
- 11.2.10 Green Bag
- 11.2.10.1. Overview
- 11.2.10.2. Products
- 11.2.10.3. SWOT Analysis
- 11.2.10.4. Recent Developments
- 11.2.10.5. Financials (Based on Availability)
- 11.2.11 Mixed Bag Designs
- 11.2.11.1. Overview
- 11.2.11.2. Products
- 11.2.11.3. SWOT Analysis
- 11.2.11.4. Recent Developments
- 11.2.11.5. Financials (Based on Availability)
- 11.2.12 True Reusable Bags
- 11.2.12.1. Overview
- 11.2.12.2. Products
- 11.2.12.3. SWOT Analysis
- 11.2.12.4. Recent Developments
- 11.2.12.5. Financials (Based on Availability)
- 11.2.13 Euro Bags
- 11.2.13.1. Overview
- 11.2.13.2. Products
- 11.2.13.3. SWOT Analysis
- 11.2.13.4. Recent Developments
- 11.2.13.5. Financials (Based on Availability)
- 11.2.14 BAGEST
- 11.2.14.1. Overview
- 11.2.14.2. Products
- 11.2.14.3. SWOT Analysis
- 11.2.14.4. Recent Developments
- 11.2.14.5. Financials (Based on Availability)
- 11.2.15 Envi Reusable Bags
- 11.2.15.1. Overview
- 11.2.15.2. Products
- 11.2.15.3. SWOT Analysis
- 11.2.15.4. Recent Developments
- 11.2.15.5. Financials (Based on Availability)
- 11.2.16 ChicoBag
- 11.2.16.1. Overview
- 11.2.16.2. Products
- 11.2.16.3. SWOT Analysis
- 11.2.16.4. Recent Developments
- 11.2.16.5. Financials (Based on Availability)
- 11.2.17 BioBag
- 11.2.17.1. Overview
- 11.2.17.2. Products
- 11.2.17.3. SWOT Analysis
- 11.2.17.4. Recent Developments
- 11.2.17.5. Financials (Based on Availability)
- 11.2.18 Novolex
- 11.2.18.1. Overview
- 11.2.18.2. Products
- 11.2.18.3. SWOT Analysis
- 11.2.18.4. Recent Developments
- 11.2.18.5. Financials (Based on Availability)
- 11.2.19 EnviGreen
- 11.2.19.1. Overview
- 11.2.19.2. Products
- 11.2.19.3. SWOT Analysis
- 11.2.19.4. Recent Developments
- 11.2.19.5. Financials (Based on Availability)
- 11.2.20 BASF
- 11.2.20.1. Overview
- 11.2.20.2. Products
- 11.2.20.3. SWOT Analysis
- 11.2.20.4. Recent Developments
- 11.2.20.5. Financials (Based on Availability)
- 11.2.21 Plastiroll
- 11.2.21.1. Overview
- 11.2.21.2. Products
- 11.2.21.3. SWOT Analysis
- 11.2.21.4. Recent Developments
- 11.2.21.5. Financials (Based on Availability)
- 11.2.22 Sahachit
- 11.2.22.1. Overview
- 11.2.22.2. Products
- 11.2.22.3. SWOT Analysis
- 11.2.22.4. Recent Developments
- 11.2.22.5. Financials (Based on Availability)
- 11.2.23 Xtex Polythene
- 11.2.23.1. Overview
- 11.2.23.2. Products
- 11.2.23.3. SWOT Analysis
- 11.2.23.4. Recent Developments
- 11.2.23.5. Financials (Based on Availability)
- 11.2.24 RKW Group
- 11.2.24.1. Overview
- 11.2.24.2. Products
- 11.2.24.3. SWOT Analysis
- 11.2.24.4. Recent Developments
- 11.2.24.5. Financials (Based on Availability)
- 11.2.25 Abbey Polythene
- 11.2.25.1. Overview
- 11.2.25.2. Products
- 11.2.25.3. SWOT Analysis
- 11.2.25.4. Recent Developments
- 11.2.25.5. Financials (Based on Availability)
- 11.2.26 Sarah Bio Plast
- 11.2.26.1. Overview
- 11.2.26.2. Products
- 11.2.26.3. SWOT Analysis
- 11.2.26.4. Recent Developments
- 11.2.26.5. Financials (Based on Availability)
- 11.2.1 Shuye
List of Figures
- Figure 1: Global Biodegradable Plastic Eco Bag Revenue Breakdown (million, %) by Region 2025 & 2033
- Figure 2: Global Biodegradable Plastic Eco Bag Volume Breakdown (K, %) by Region 2025 & 2033
- Figure 3: North America Biodegradable Plastic Eco Bag Revenue (million), by Application 2025 & 2033
- Figure 4: North America Biodegradable Plastic Eco Bag Volume (K), by Application 2025 & 2033
- Figure 5: North America Biodegradable Plastic Eco Bag Revenue Share (%), by Application 2025 & 2033
- Figure 6: North America Biodegradable Plastic Eco Bag Volume Share (%), by Application 2025 & 2033
- Figure 7: North America Biodegradable Plastic Eco Bag Revenue (million), by Types 2025 & 2033
- Figure 8: North America Biodegradable Plastic Eco Bag Volume (K), by Types 2025 & 2033
- Figure 9: North America Biodegradable Plastic Eco Bag Revenue Share (%), by Types 2025 & 2033
- Figure 10: North America Biodegradable Plastic Eco Bag Volume Share (%), by Types 2025 & 2033
- Figure 11: North America Biodegradable Plastic Eco Bag Revenue (million), by Country 2025 & 2033
- Figure 12: North America Biodegradable Plastic Eco Bag Volume (K), by Country 2025 & 2033
- Figure 13: North America Biodegradable Plastic Eco Bag Revenue Share (%), by Country 2025 & 2033
- Figure 14: North America Biodegradable Plastic Eco Bag Volume Share (%), by Country 2025 & 2033
- Figure 15: South America Biodegradable Plastic Eco Bag Revenue (million), by Application 2025 & 2033
- Figure 16: South America Biodegradable Plastic Eco Bag Volume (K), by Application 2025 & 2033
- Figure 17: South America Biodegradable Plastic Eco Bag Revenue Share (%), by Application 2025 & 2033
- Figure 18: South America Biodegradable Plastic Eco Bag Volume Share (%), by Application 2025 & 2033
- Figure 19: South America Biodegradable Plastic Eco Bag Revenue (million), by Types 2025 & 2033
- Figure 20: South America Biodegradable Plastic Eco Bag Volume (K), by Types 2025 & 2033
- Figure 21: South America Biodegradable Plastic Eco Bag Revenue Share (%), by Types 2025 & 2033
- Figure 22: South America Biodegradable Plastic Eco Bag Volume Share (%), by Types 2025 & 2033
- Figure 23: South America Biodegradable Plastic Eco Bag Revenue (million), by Country 2025 & 2033
- Figure 24: South America Biodegradable Plastic Eco Bag Volume (K), by Country 2025 & 2033
- Figure 25: South America Biodegradable Plastic Eco Bag Revenue Share (%), by Country 2025 & 2033
- Figure 26: South America Biodegradable Plastic Eco Bag Volume Share (%), by Country 2025 & 2033
- Figure 27: Europe Biodegradable Plastic Eco Bag Revenue (million), by Application 2025 & 2033
- Figure 28: Europe Biodegradable Plastic Eco Bag Volume (K), by Application 2025 & 2033
- Figure 29: Europe Biodegradable Plastic Eco Bag Revenue Share (%), by Application 2025 & 2033
- Figure 30: Europe Biodegradable Plastic Eco Bag Volume Share (%), by Application 2025 & 2033
- Figure 31: Europe Biodegradable Plastic Eco Bag Revenue (million), by Types 2025 & 2033
- Figure 32: Europe Biodegradable Plastic Eco Bag Volume (K), by Types 2025 & 2033
- Figure 33: Europe Biodegradable Plastic Eco Bag Revenue Share (%), by Types 2025 & 2033
- Figure 34: Europe Biodegradable Plastic Eco Bag Volume Share (%), by Types 2025 & 2033
- Figure 35: Europe Biodegradable Plastic Eco Bag Revenue (million), by Country 2025 & 2033
- Figure 36: Europe Biodegradable Plastic Eco Bag Volume (K), by Country 2025 & 2033
- Figure 37: Europe Biodegradable Plastic Eco Bag Revenue Share (%), by Country 2025 & 2033
- Figure 38: Europe Biodegradable Plastic Eco Bag Volume Share (%), by Country 2025 & 2033
- Figure 39: Middle East & Africa Biodegradable Plastic Eco Bag Revenue (million), by Application 2025 & 2033
- Figure 40: Middle East & Africa Biodegradable Plastic Eco Bag Volume (K), by Application 2025 & 2033
- Figure 41: Middle East & Africa Biodegradable Plastic Eco Bag Revenue Share (%), by Application 2025 & 2033
- Figure 42: Middle East & Africa Biodegradable Plastic Eco Bag Volume Share (%), by Application 2025 & 2033
- Figure 43: Middle East & Africa Biodegradable Plastic Eco Bag Revenue (million), by Types 2025 & 2033
- Figure 44: Middle East & Africa Biodegradable Plastic Eco Bag Volume (K), by Types 2025 & 2033
- Figure 45: Middle East & Africa Biodegradable Plastic Eco Bag Revenue Share (%), by Types 2025 & 2033
- Figure 46: Middle East & Africa Biodegradable Plastic Eco Bag Volume Share (%), by Types 2025 & 2033
- Figure 47: Middle East & Africa Biodegradable Plastic Eco Bag Revenue (million), by Country 2025 & 2033
- Figure 48: Middle East & Africa Biodegradable Plastic Eco Bag Volume (K), by Country 2025 & 2033
- Figure 49: Middle East & Africa Biodegradable Plastic Eco Bag Revenue Share (%), by Country 2025 & 2033
- Figure 50: Middle East & Africa Biodegradable Plastic Eco Bag Volume Share (%), by Country 2025 & 2033
- Figure 51: Asia Pacific Biodegradable Plastic Eco Bag Revenue (million), by Application 2025 & 2033
- Figure 52: Asia Pacific Biodegradable Plastic Eco Bag Volume (K), by Application 2025 & 2033
- Figure 53: Asia Pacific Biodegradable Plastic Eco Bag Revenue Share (%), by Application 2025 & 2033
- Figure 54: Asia Pacific Biodegradable Plastic Eco Bag Volume Share (%), by Application 2025 & 2033
- Figure 55: Asia Pacific Biodegradable Plastic Eco Bag Revenue (million), by Types 2025 & 2033
- Figure 56: Asia Pacific Biodegradable Plastic Eco Bag Volume (K), by Types 2025 & 2033
- Figure 57: Asia Pacific Biodegradable Plastic Eco Bag Revenue Share (%), by Types 2025 & 2033
- Figure 58: Asia Pacific Biodegradable Plastic Eco Bag Volume Share (%), by Types 2025 & 2033
- Figure 59: Asia Pacific Biodegradable Plastic Eco Bag Revenue (million), by Country 2025 & 2033
- Figure 60: Asia Pacific Biodegradable Plastic Eco Bag Volume (K), by Country 2025 & 2033
- Figure 61: Asia Pacific Biodegradable Plastic Eco Bag Revenue Share (%), by Country 2025 & 2033
- Figure 62: Asia Pacific Biodegradable Plastic Eco Bag Volume Share (%), by Country 2025 & 2033
List of Tables
- Table 1: Global Biodegradable Plastic Eco Bag Revenue million Forecast, by Application 2020 & 2033
- Table 2: Global Biodegradable Plastic Eco Bag Volume K Forecast, by Application 2020 & 2033
- Table 3: Global Biodegradable Plastic Eco Bag Revenue million Forecast, by Types 2020 & 2033
- Table 4: Global Biodegradable Plastic Eco Bag Volume K Forecast, by Types 2020 & 2033
- Table 5: Global Biodegradable Plastic Eco Bag Revenue million Forecast, by Region 2020 & 2033
- Table 6: Global Biodegradable Plastic Eco Bag Volume K Forecast, by Region 2020 & 2033
- Table 7: Global Biodegradable Plastic Eco Bag Revenue million Forecast, by Application 2020 & 2033
- Table 8: Global Biodegradable Plastic Eco Bag Volume K Forecast, by Application 2020 & 2033
- Table 9: Global Biodegradable Plastic Eco Bag Revenue million Forecast, by Types 2020 & 2033
- Table 10: Global Biodegradable Plastic Eco Bag Volume K Forecast, by Types 2020 & 2033
- Table 11: Global Biodegradable Plastic Eco Bag Revenue million Forecast, by Country 2020 & 2033
- Table 12: Global Biodegradable Plastic Eco Bag Volume K Forecast, by Country 2020 & 2033
- Table 13: United States Biodegradable Plastic Eco Bag Revenue (million) Forecast, by Application 2020 & 2033
- Table 14: United States Biodegradable Plastic Eco Bag Volume (K) Forecast, by Application 2020 & 2033
- Table 15: Canada Biodegradable Plastic Eco Bag Revenue (million) Forecast, by Application 2020 & 2033
- Table 16: Canada Biodegradable Plastic Eco Bag Volume (K) Forecast, by Application 2020 & 2033
- Table 17: Mexico Biodegradable Plastic Eco Bag Revenue (million) Forecast, by Application 2020 & 2033
- Table 18: Mexico Biodegradable Plastic Eco Bag Volume (K) Forecast, by Application 2020 & 2033
- Table 19: Global Biodegradable Plastic Eco Bag Revenue million Forecast, by Application 2020 & 2033
- Table 20: Global Biodegradable Plastic Eco Bag Volume K Forecast, by Application 2020 & 2033
- Table 21: Global Biodegradable Plastic Eco Bag Revenue million Forecast, by Types 2020 & 2033
- Table 22: Global Biodegradable Plastic Eco Bag Volume K Forecast, by Types 2020 & 2033
- Table 23: Global Biodegradable Plastic Eco Bag Revenue million Forecast, by Country 2020 & 2033
- Table 24: Global Biodegradable Plastic Eco Bag Volume K Forecast, by Country 2020 & 2033
- Table 25: Brazil Biodegradable Plastic Eco Bag Revenue (million) Forecast, by Application 2020 & 2033
- Table 26: Brazil Biodegradable Plastic Eco Bag Volume (K) Forecast, by Application 2020 & 2033
- Table 27: Argentina Biodegradable Plastic Eco Bag Revenue (million) Forecast, by Application 2020 & 2033
- Table 28: Argentina Biodegradable Plastic Eco Bag Volume (K) Forecast, by Application 2020 & 2033
- Table 29: Rest of South America Biodegradable Plastic Eco Bag Revenue (million) Forecast, by Application 2020 & 2033
- Table 30: Rest of South America Biodegradable Plastic Eco Bag Volume (K) Forecast, by Application 2020 & 2033
- Table 31: Global Biodegradable Plastic Eco Bag Revenue million Forecast, by Application 2020 & 2033
- Table 32: Global Biodegradable Plastic Eco Bag Volume K Forecast, by Application 2020 & 2033
- Table 33: Global Biodegradable Plastic Eco Bag Revenue million Forecast, by Types 2020 & 2033
- Table 34: Global Biodegradable Plastic Eco Bag Volume K Forecast, by Types 2020 & 2033
- Table 35: Global Biodegradable Plastic Eco Bag Revenue million Forecast, by Country 2020 & 2033
- Table 36: Global Biodegradable Plastic Eco Bag Volume K Forecast, by Country 2020 & 2033
- Table 37: United Kingdom Biodegradable Plastic Eco Bag Revenue (million) Forecast, by Application 2020 & 2033
- Table 38: United Kingdom Biodegradable Plastic Eco Bag Volume (K) Forecast, by Application 2020 & 2033
- Table 39: Germany Biodegradable Plastic Eco Bag Revenue (million) Forecast, by Application 2020 & 2033
- Table 40: Germany Biodegradable Plastic Eco Bag Volume (K) Forecast, by Application 2020 & 2033
- Table 41: France Biodegradable Plastic Eco Bag Revenue (million) Forecast, by Application 2020 & 2033
- Table 42: France Biodegradable Plastic Eco Bag Volume (K) Forecast, by Application 2020 & 2033
- Table 43: Italy Biodegradable Plastic Eco Bag Revenue (million) Forecast, by Application 2020 & 2033
- Table 44: Italy Biodegradable Plastic Eco Bag Volume (K) Forecast, by Application 2020 & 2033
- Table 45: Spain Biodegradable Plastic Eco Bag Revenue (million) Forecast, by Application 2020 & 2033
- Table 46: Spain Biodegradable Plastic Eco Bag Volume (K) Forecast, by Application 2020 & 2033
- Table 47: Russia Biodegradable Plastic Eco Bag Revenue (million) Forecast, by Application 2020 & 2033
- Table 48: Russia Biodegradable Plastic Eco Bag Volume (K) Forecast, by Application 2020 & 2033
- Table 49: Benelux Biodegradable Plastic Eco Bag Revenue (million) Forecast, by Application 2020 & 2033
- Table 50: Benelux Biodegradable Plastic Eco Bag Volume (K) Forecast, by Application 2020 & 2033
- Table 51: Nordics Biodegradable Plastic Eco Bag Revenue (million) Forecast, by Application 2020 & 2033
- Table 52: Nordics Biodegradable Plastic Eco Bag Volume (K) Forecast, by Application 2020 & 2033
- Table 53: Rest of Europe Biodegradable Plastic Eco Bag Revenue (million) Forecast, by Application 2020 & 2033
- Table 54: Rest of Europe Biodegradable Plastic Eco Bag Volume (K) Forecast, by Application 2020 & 2033
- Table 55: Global Biodegradable Plastic Eco Bag Revenue million Forecast, by Application 2020 & 2033
- Table 56: Global Biodegradable Plastic Eco Bag Volume K Forecast, by Application 2020 & 2033
- Table 57: Global Biodegradable Plastic Eco Bag Revenue million Forecast, by Types 2020 & 2033
- Table 58: Global Biodegradable Plastic Eco Bag Volume K Forecast, by Types 2020 & 2033
- Table 59: Global Biodegradable Plastic Eco Bag Revenue million Forecast, by Country 2020 & 2033
- Table 60: Global Biodegradable Plastic Eco Bag Volume K Forecast, by Country 2020 & 2033
- Table 61: Turkey Biodegradable Plastic Eco Bag Revenue (million) Forecast, by Application 2020 & 2033
- Table 62: Turkey Biodegradable Plastic Eco Bag Volume (K) Forecast, by Application 2020 & 2033
- Table 63: Israel Biodegradable Plastic Eco Bag Revenue (million) Forecast, by Application 2020 & 2033
- Table 64: Israel Biodegradable Plastic Eco Bag Volume (K) Forecast, by Application 2020 & 2033
- Table 65: GCC Biodegradable Plastic Eco Bag Revenue (million) Forecast, by Application 2020 & 2033
- Table 66: GCC Biodegradable Plastic Eco Bag Volume (K) Forecast, by Application 2020 & 2033
- Table 67: North Africa Biodegradable Plastic Eco Bag Revenue (million) Forecast, by Application 2020 & 2033
- Table 68: North Africa Biodegradable Plastic Eco Bag Volume (K) Forecast, by Application 2020 & 2033
- Table 69: South Africa Biodegradable Plastic Eco Bag Revenue (million) Forecast, by Application 2020 & 2033
- Table 70: South Africa Biodegradable Plastic Eco Bag Volume (K) Forecast, by Application 2020 & 2033
- Table 71: Rest of Middle East & Africa Biodegradable Plastic Eco Bag Revenue (million) Forecast, by Application 2020 & 2033
- Table 72: Rest of Middle East & Africa Biodegradable Plastic Eco Bag Volume (K) Forecast, by Application 2020 & 2033
- Table 73: Global Biodegradable Plastic Eco Bag Revenue million Forecast, by Application 2020 & 2033
- Table 74: Global Biodegradable Plastic Eco Bag Volume K Forecast, by Application 2020 & 2033
- Table 75: Global Biodegradable Plastic Eco Bag Revenue million Forecast, by Types 2020 & 2033
- Table 76: Global Biodegradable Plastic Eco Bag Volume K Forecast, by Types 2020 & 2033
- Table 77: Global Biodegradable Plastic Eco Bag Revenue million Forecast, by Country 2020 & 2033
- Table 78: Global Biodegradable Plastic Eco Bag Volume K Forecast, by Country 2020 & 2033
- Table 79: China Biodegradable Plastic Eco Bag Revenue (million) Forecast, by Application 2020 & 2033
- Table 80: China Biodegradable Plastic Eco Bag Volume (K) Forecast, by Application 2020 & 2033
- Table 81: India Biodegradable Plastic Eco Bag Revenue (million) Forecast, by Application 2020 & 2033
- Table 82: India Biodegradable Plastic Eco Bag Volume (K) Forecast, by Application 2020 & 2033
- Table 83: Japan Biodegradable Plastic Eco Bag Revenue (million) Forecast, by Application 2020 & 2033
- Table 84: Japan Biodegradable Plastic Eco Bag Volume (K) Forecast, by Application 2020 & 2033
- Table 85: South Korea Biodegradable Plastic Eco Bag Revenue (million) Forecast, by Application 2020 & 2033
- Table 86: South Korea Biodegradable Plastic Eco Bag Volume (K) Forecast, by Application 2020 & 2033
- Table 87: ASEAN Biodegradable Plastic Eco Bag Revenue (million) Forecast, by Application 2020 & 2033
- Table 88: ASEAN Biodegradable Plastic Eco Bag Volume (K) Forecast, by Application 2020 & 2033
- Table 89: Oceania Biodegradable Plastic Eco Bag Revenue (million) Forecast, by Application 2020 & 2033
- Table 90: Oceania Biodegradable Plastic Eco Bag Volume (K) Forecast, by Application 2020 & 2033
- Table 91: Rest of Asia Pacific Biodegradable Plastic Eco Bag Revenue (million) Forecast, by Application 2020 & 2033
- Table 92: Rest of Asia Pacific Biodegradable Plastic Eco Bag Volume (K) Forecast, by Application 2020 & 2033
Frequently Asked Questions
1. What is the projected Compound Annual Growth Rate (CAGR) of the Biodegradable Plastic Eco Bag?
The projected CAGR is approximately XX%.
2. Which companies are prominent players in the Biodegradable Plastic Eco Bag?
Key companies in the market include Shuye, Earthwise Bag, Vietinam PP Bags, MIHA J.S.C, Command Packaging, Vina Packing Films, PVN, 1 Bag at a Time, Sapphirevn, Green Bag, Mixed Bag Designs, True Reusable Bags, Euro Bags, BAGEST, Envi Reusable Bags, ChicoBag, BioBag, Novolex, EnviGreen, BASF, Plastiroll, Sahachit, Xtex Polythene, RKW Group, Abbey Polythene, Sarah Bio Plast.
3. What are the main segments of the Biodegradable Plastic Eco Bag?
The market segments include Application, Types.
4. Can you provide details about the market size?
The market size is estimated to be USD XXX million as of 2022.
5. What are some drivers contributing to market growth?
N/A
6. What are the notable trends driving market growth?
N/A
7. Are there any restraints impacting market growth?
N/A
8. Can you provide examples of recent developments in the market?
N/A
9. What pricing options are available for accessing the report?
Pricing options include single-user, multi-user, and enterprise licenses priced at USD 3350.00, USD 5025.00, and USD 6700.00 respectively.
10. Is the market size provided in terms of value or volume?
The market size is provided in terms of value, measured in million and volume, measured in K.
11. Are there any specific market keywords associated with the report?
Yes, the market keyword associated with the report is "Biodegradable Plastic Eco Bag," which aids in identifying and referencing the specific market segment covered.
12. How do I determine which pricing option suits my needs best?
The pricing options vary based on user requirements and access needs. Individual users may opt for single-user licenses, while businesses requiring broader access may choose multi-user or enterprise licenses for cost-effective access to the report.
13. Are there any additional resources or data provided in the Biodegradable Plastic Eco Bag report?
While the report offers comprehensive insights, it's advisable to review the specific contents or supplementary materials provided to ascertain if additional resources or data are available.
14. How can I stay updated on further developments or reports in the Biodegradable Plastic Eco Bag?
To stay informed about further developments, trends, and reports in the Biodegradable Plastic Eco Bag, consider subscribing to industry newsletters, following relevant companies and organizations, or regularly checking reputable industry news sources and publications.
Methodology
Step 1 - Identification of Relevant Samples Size from Population Database


Step 2 - Approaches for Defining Global Market Size (Value, Volume* & Price*)

Note*: In applicable scenarios
Step 3 - Data Sources
Primary Research
- Web Analytics
- Survey Reports
- Research Institute
- Latest Research Reports
- Opinion Leaders
Secondary Research
- Annual Reports
- White Paper
- Latest Press Release
- Industry Association
- Paid Database
- Investor Presentations

Step 4 - Data Triangulation
Involves using different sources of information in order to increase the validity of a study
These sources are likely to be stakeholders in a program - participants, other researchers, program staff, other community members, and so on.
Then we put all data in single framework & apply various statistical tools to find out the dynamic on the market.
During the analysis stage, feedback from the stakeholder groups would be compared to determine areas of agreement as well as areas of divergence