

Key Insights
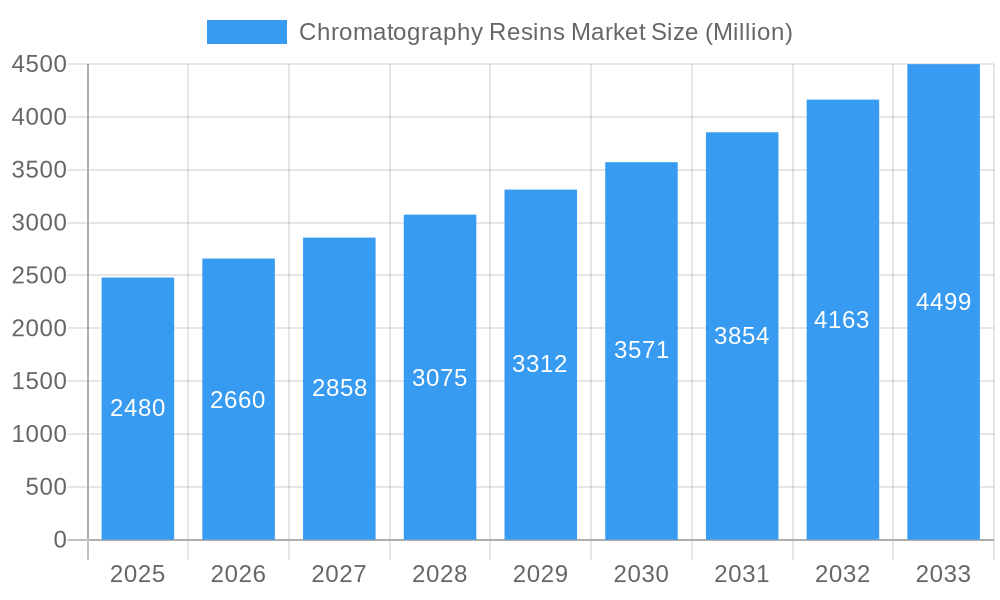
The Chromatography Resins market, currently valued at $2480 million in 2025, is projected to experience robust growth, exhibiting a Compound Annual Growth Rate (CAGR) exceeding 7% from 2025 to 2033. This expansion is driven by several key factors. The burgeoning pharmaceutical and biotechnology industries are significantly boosting demand for high-performance chromatography resins for drug discovery, development, and production. Increasing regulatory scrutiny on drug purity and efficacy further fuels the need for advanced separation techniques, thus driving market growth. Technological advancements, such as the development of novel resin materials with enhanced selectivity and efficiency, are also contributing to this market expansion. The rising adoption of chromatography resins in various end-user industries, including food and beverages for quality control and environmental agencies for water purification, further expands the market's reach. Furthermore, the growing preference for natural-based resins, due to their biocompatibility and environmental friendliness, is creating new opportunities. However, the market faces certain restraints such as high initial investment costs associated with sophisticated chromatography systems and the availability of alternative separation techniques.

Chromatography Resins Market Market Size (In Billion)
Despite these challenges, the market is expected to witness considerable growth across diverse geographic regions. North America, particularly the United States, currently holds a dominant market share due to the presence of major pharmaceutical companies and robust research infrastructure. However, the Asia-Pacific region, especially China and India, is projected to demonstrate the fastest growth rate owing to increasing investments in pharmaceutical manufacturing and expanding research activities. Europe is also expected to contribute significantly to the market's growth, driven by the strong presence of pharmaceutical and biotechnology companies and supportive regulatory frameworks. The competitive landscape is marked by the presence of both established players like Repligen Corporation, Merck KGaA, and Thermo Fisher Scientific, as well as emerging companies, leading to ongoing innovation and competition. The market's future prospects remain highly promising, driven by continuous technological advancements and the increasing demand for efficient and high-performance separation techniques across various industries.
Chromatography Resins Market Company Market Share
Chromatography Resins Market: A Comprehensive Report (2019-2033)
This comprehensive report provides an in-depth analysis of the Chromatography Resins Market, encompassing market dynamics, growth trends, regional performance, product landscape, and key players. The study period spans from 2019 to 2033, with 2025 serving as the base and estimated year. This report is invaluable for industry professionals, investors, and researchers seeking a nuanced understanding of this dynamic market. The global Chromatography Resins market is segmented by end-user industry (Pharmaceuticals, Drug Production, Water & Environmental Agencies, Food & Beverages, Other), origin (Natural-based, Synthetic-based (Dextran)), and technology (Ion Exchange, Affinity, Size Exclusion, Hydrophobic Interaction, Other).
Chromatography Resins Market Market Dynamics & Structure
The Chromatography Resins market is characterized by a moderately consolidated structure, with several key players holding significant market share. Market concentration is expected to remain relatively stable over the forecast period, with xx% held by the top 5 players in 2025. Technological innovation, driven by the need for higher efficiency and selectivity in purification processes, is a primary growth driver. Stringent regulatory frameworks, particularly within the pharmaceutical and biopharmaceutical sectors, influence product development and adoption. Competitive substitutes, such as membrane filtration techniques, exert some pressure, but the unique capabilities of chromatography resins maintain its dominant position. The market is witnessing increasing demand from emerging economies, fueled by growing investments in healthcare and life sciences. M&A activity has been notable, with deals focused on expanding product portfolios and geographical reach. For instance, the acquisition of Pall Corporation's Chromatography and Filtration business by Repligen Corporation in 2021 demonstrates the strategic importance of this sector.
- Market Concentration: xx% market share held by top 5 players in 2025.
- Technological Innovation: Continuous development of novel resin materials and improved purification techniques.
- Regulatory Framework: Stringent regulations in pharmaceutical & biopharmaceutical sectors shaping product development.
- Competitive Substitutes: Membrane filtration technologies presenting some competitive pressure.
- M&A Activity: Significant consolidation observed, exemplified by Repligen's acquisition of Pall Corporation's chromatography business. Approximately xx M&A deals were recorded between 2019 and 2024.
- Innovation Barriers: High R&D costs and lengthy regulatory approval processes hinder innovation.
Chromatography Resins Market Growth Trends & Insights
The Chromatography Resins market has experienced robust growth during the historical period (2019-2024), with a CAGR of xx%. This growth is primarily driven by increasing demand from the pharmaceutical and biotechnology industries, coupled with advancements in chromatographic techniques. The market size reached xx million units in 2024 and is projected to reach xx million units by 2033, exhibiting a CAGR of xx% during the forecast period (2025-2033). The adoption rate of advanced chromatography resins, particularly in high-throughput applications, is increasing significantly, driven by the growing need for efficient and cost-effective biopharmaceutical purification. Technological disruptions, such as the development of novel resin materials with improved selectivity and binding capacity, are further accelerating market growth. Shifts in consumer behavior, particularly towards personalized medicine and advanced therapies, are creating new opportunities for the market.
Dominant Regions, Countries, or Segments in Chromatography Resins Market
North America currently holds the largest market share in the Chromatography Resins market, driven by the strong presence of major pharmaceutical and biotechnology companies and extensive research and development activities. Europe follows as a significant market, owing to robust regulations and substantial investments in life sciences research. Asia-Pacific is anticipated to witness the fastest growth rate during the forecast period, fueled by burgeoning pharmaceutical and biotechnology industries in emerging economies.
Within segments, the Pharmaceuticals end-user industry dominates, accounting for xx% of the market in 2025, owing to the widespread use of chromatography resins in drug discovery and manufacturing. Synthetic-based resins, particularly dextran-based resins, are gaining traction due to their superior performance characteristics compared to natural-based resins. Ion exchange chromatography resins maintain a leading position due to their versatility and wide applicability.
- North America: High market share driven by strong pharmaceutical and biotech industry presence.
- Europe: Significant market share due to robust R&D investments and regulatory environment.
- Asia-Pacific: Fastest-growing region, driven by emerging economies and growing life sciences sectors.
- Pharmaceuticals End-User Industry: Dominant segment due to the high demand in drug discovery and manufacturing.
- Synthetic-based (Dextran) Resins: Growing segment due to superior performance characteristics.
- Ion Exchange Chromatography Resins: Largest technology segment due to its versatility and wide applicability.
Chromatography Resins Market Product Landscape
The Chromatography Resins market offers a diverse range of products, each tailored to specific applications and performance requirements. Recent innovations focus on enhancing resin selectivity, capacity, and stability. Advanced materials and manufacturing techniques are continuously being implemented to improve resin performance and reduce production costs. Unique selling propositions include higher resolution, faster separation speeds, and improved scalability. Technological advancements are centered around improving binding capacity, reducing non-specific binding, and increasing the longevity of the resins.
Key Drivers, Barriers & Challenges in Chromatography Resins Market
Key Drivers:
- Increasing demand from the biopharmaceutical industry for high-purity products.
- Technological advancements leading to improved resin performance and efficiency.
- Growing adoption of advanced chromatographic techniques in various industries.
Challenges and Restraints:
- High R&D costs associated with developing novel resin materials.
- Stringent regulatory requirements and lengthy approval processes.
- Intense competition from established players and emerging companies. The competition led to a price reduction of xx% in the last 5 years.
Emerging Opportunities in Chromatography Resins Market
Emerging opportunities lie in the development of novel resins tailored to specific applications, such as the purification of complex biomolecules and the treatment of water contaminants. Untapped markets in developing economies present significant growth potential. Innovative applications in areas such as personalized medicine and gene therapy are further driving market expansion.
Growth Accelerators in the Chromatography Resins Market Industry
Long-term growth will be fueled by continuous technological innovation, focusing on the development of highly selective and efficient resins. Strategic partnerships and collaborations between resin manufacturers and end-users will drive innovation and market penetration. Expansion into emerging markets and the development of tailored solutions for specific industries will further accelerate market growth.
Key Players Shaping the Chromatography Resins Market Market
- Repligen Corporation
- General Electric
- Bio-Rad Laboratories Inc
- Merck KGaA
- Mitsubishi Chemical Corporation
- Dupont
- Perkinelmer Inc
- Pall Corporation (Note: Acquired by Repligen)
- Tosoh Bioscience LLC
- Purolite
- Agilient Technologies
- Avantor Inc
- Thermo Fisher Scientific
Notable Milestones in Chromatography Resins Market Sector
- 2021: Repligen Corporation acquired Pall Corporation's Chromatography and Filtration business, significantly expanding its market presence.
- 2022: Thermo Fisher Scientific launched a new line of chromatography resins designed for high-throughput biopharmaceutical purification, enhancing purification efficiency and throughput.
In-Depth Chromatography Resins Market Market Outlook
The Chromatography Resins market is poised for continued growth, driven by the increasing demand for advanced purification technologies across various industries. Strategic partnerships, technological breakthroughs, and market expansion efforts will play crucial roles in shaping the future of this dynamic sector. The focus on developing highly specialized resins for emerging applications, such as personalized medicine and gene therapy, will unlock substantial growth opportunities.
Chromatography Resins Market Segmentation
-
1. Origin
-
1.1. Natural-based
- 1.1.1. Agarose
- 1.1.2. Dextran
-
1.2. Synthetic-based
- 1.2.1. Silica Gel
- 1.2.2. Aluminum Oxide
- 1.2.3. Polystyrene
- 1.2.4. Other Synthetic-based Resins
-
1.1. Natural-based
-
2. Technology
- 2.1. Ion Exchange Chromatography Resins
- 2.2. Affinity Chromatography Resins
- 2.3. Size Exclusion Chromatography Resins
- 2.4. Hydrophobic Interaction Chromatography Resins
- 2.5. Other Technologies
-
3. End-user Industry
-
3.1. Pharmaceuticals
- 3.1.1. Biotechnology
- 3.1.2. Drug Discovery
- 3.1.3. Drug Production
- 3.2. Water and Environmental Agencies
- 3.3. Food and Beverages
- 3.4. Other End-user Industries
-
3.1. Pharmaceuticals
Chromatography Resins Market Segmentation By Geography
-
1. Asia Pacific
- 1.1. China
- 1.2. India
- 1.3. Japan
- 1.4. Rest of Asia Pacific
-
2. North America
- 2.1. United States
- 2.2. Canada
- 2.3. Mexico
-
3. Europe
- 3.1. Germany
- 3.2. United Kingdom
- 3.3. Italy
- 3.4. France
- 3.5. Switzerland
- 3.6. Rest of Europe
-
4. Rest of the World
- 4.1. South America
- 4.2. Middle East and Africa

Chromatography Resins Market Regional Market Share
Geographic Coverage of Chromatography Resins Market
Chromatography Resins Market REPORT HIGHLIGHTS
| Aspects | Details |
|---|---|
| Study Period | 2020-2034 |
| Base Year | 2025 |
| Estimated Year | 2026 |
| Forecast Period | 2026-2034 |
| Historical Period | 2020-2025 |
| Growth Rate | CAGR of > 7.00% from 2020-2034 |
| Segmentation |
|
Table of Contents
- 1. Introduction
- 1.1. Research Scope
- 1.2. Market Segmentation
- 1.3. Research Methodology
- 1.4. Definitions and Assumptions
- 2. Executive Summary
- 2.1. Introduction
- 3. Market Dynamics
- 3.1. Introduction
- 3.2. Market Drivers
- 3.2.1. ; Rising Demand from the Pharmaceutical Sector; Technological Advancements in Chromatography Resins; Increasing Importance of Chromatography Tests in Drug Approvals
- 3.3. Market Restrains
- 3.3.1. ; Lack of Professional Expertise in the Emerging Countries; High Costs vs. Productivity of Chromatography Systems
- 3.4. Market Trends
- 3.4.1. Increasing Demand from Pharmaceutical Sector
- 4. Market Factor Analysis
- 4.1. Porters Five Forces
- 4.2. Supply/Value Chain
- 4.3. PESTEL analysis
- 4.4. Market Entropy
- 4.5. Patent/Trademark Analysis
- 5. Global Chromatography Resins Market Analysis, Insights and Forecast, 2020-2032
- 5.1. Market Analysis, Insights and Forecast - by Origin
- 5.1.1. Natural-based
- 5.1.1.1. Agarose
- 5.1.1.2. Dextran
- 5.1.2. Synthetic-based
- 5.1.2.1. Silica Gel
- 5.1.2.2. Aluminum Oxide
- 5.1.2.3. Polystyrene
- 5.1.2.4. Other Synthetic-based Resins
- 5.1.1. Natural-based
- 5.2. Market Analysis, Insights and Forecast - by Technology
- 5.2.1. Ion Exchange Chromatography Resins
- 5.2.2. Affinity Chromatography Resins
- 5.2.3. Size Exclusion Chromatography Resins
- 5.2.4. Hydrophobic Interaction Chromatography Resins
- 5.2.5. Other Technologies
- 5.3. Market Analysis, Insights and Forecast - by End-user Industry
- 5.3.1. Pharmaceuticals
- 5.3.1.1. Biotechnology
- 5.3.1.2. Drug Discovery
- 5.3.1.3. Drug Production
- 5.3.2. Water and Environmental Agencies
- 5.3.3. Food and Beverages
- 5.3.4. Other End-user Industries
- 5.3.1. Pharmaceuticals
- 5.4. Market Analysis, Insights and Forecast - by Region
- 5.4.1. Asia Pacific
- 5.4.2. North America
- 5.4.3. Europe
- 5.4.4. Rest of the World
- 5.1. Market Analysis, Insights and Forecast - by Origin
- 6. Asia Pacific Chromatography Resins Market Analysis, Insights and Forecast, 2020-2032
- 6.1. Market Analysis, Insights and Forecast - by Origin
- 6.1.1. Natural-based
- 6.1.1.1. Agarose
- 6.1.1.2. Dextran
- 6.1.2. Synthetic-based
- 6.1.2.1. Silica Gel
- 6.1.2.2. Aluminum Oxide
- 6.1.2.3. Polystyrene
- 6.1.2.4. Other Synthetic-based Resins
- 6.1.1. Natural-based
- 6.2. Market Analysis, Insights and Forecast - by Technology
- 6.2.1. Ion Exchange Chromatography Resins
- 6.2.2. Affinity Chromatography Resins
- 6.2.3. Size Exclusion Chromatography Resins
- 6.2.4. Hydrophobic Interaction Chromatography Resins
- 6.2.5. Other Technologies
- 6.3. Market Analysis, Insights and Forecast - by End-user Industry
- 6.3.1. Pharmaceuticals
- 6.3.1.1. Biotechnology
- 6.3.1.2. Drug Discovery
- 6.3.1.3. Drug Production
- 6.3.2. Water and Environmental Agencies
- 6.3.3. Food and Beverages
- 6.3.4. Other End-user Industries
- 6.3.1. Pharmaceuticals
- 6.1. Market Analysis, Insights and Forecast - by Origin
- 7. North America Chromatography Resins Market Analysis, Insights and Forecast, 2020-2032
- 7.1. Market Analysis, Insights and Forecast - by Origin
- 7.1.1. Natural-based
- 7.1.1.1. Agarose
- 7.1.1.2. Dextran
- 7.1.2. Synthetic-based
- 7.1.2.1. Silica Gel
- 7.1.2.2. Aluminum Oxide
- 7.1.2.3. Polystyrene
- 7.1.2.4. Other Synthetic-based Resins
- 7.1.1. Natural-based
- 7.2. Market Analysis, Insights and Forecast - by Technology
- 7.2.1. Ion Exchange Chromatography Resins
- 7.2.2. Affinity Chromatography Resins
- 7.2.3. Size Exclusion Chromatography Resins
- 7.2.4. Hydrophobic Interaction Chromatography Resins
- 7.2.5. Other Technologies
- 7.3. Market Analysis, Insights and Forecast - by End-user Industry
- 7.3.1. Pharmaceuticals
- 7.3.1.1. Biotechnology
- 7.3.1.2. Drug Discovery
- 7.3.1.3. Drug Production
- 7.3.2. Water and Environmental Agencies
- 7.3.3. Food and Beverages
- 7.3.4. Other End-user Industries
- 7.3.1. Pharmaceuticals
- 7.1. Market Analysis, Insights and Forecast - by Origin
- 8. Europe Chromatography Resins Market Analysis, Insights and Forecast, 2020-2032
- 8.1. Market Analysis, Insights and Forecast - by Origin
- 8.1.1. Natural-based
- 8.1.1.1. Agarose
- 8.1.1.2. Dextran
- 8.1.2. Synthetic-based
- 8.1.2.1. Silica Gel
- 8.1.2.2. Aluminum Oxide
- 8.1.2.3. Polystyrene
- 8.1.2.4. Other Synthetic-based Resins
- 8.1.1. Natural-based
- 8.2. Market Analysis, Insights and Forecast - by Technology
- 8.2.1. Ion Exchange Chromatography Resins
- 8.2.2. Affinity Chromatography Resins
- 8.2.3. Size Exclusion Chromatography Resins
- 8.2.4. Hydrophobic Interaction Chromatography Resins
- 8.2.5. Other Technologies
- 8.3. Market Analysis, Insights and Forecast - by End-user Industry
- 8.3.1. Pharmaceuticals
- 8.3.1.1. Biotechnology
- 8.3.1.2. Drug Discovery
- 8.3.1.3. Drug Production
- 8.3.2. Water and Environmental Agencies
- 8.3.3. Food and Beverages
- 8.3.4. Other End-user Industries
- 8.3.1. Pharmaceuticals
- 8.1. Market Analysis, Insights and Forecast - by Origin
- 9. Rest of the World Chromatography Resins Market Analysis, Insights and Forecast, 2020-2032
- 9.1. Market Analysis, Insights and Forecast - by Origin
- 9.1.1. Natural-based
- 9.1.1.1. Agarose
- 9.1.1.2. Dextran
- 9.1.2. Synthetic-based
- 9.1.2.1. Silica Gel
- 9.1.2.2. Aluminum Oxide
- 9.1.2.3. Polystyrene
- 9.1.2.4. Other Synthetic-based Resins
- 9.1.1. Natural-based
- 9.2. Market Analysis, Insights and Forecast - by Technology
- 9.2.1. Ion Exchange Chromatography Resins
- 9.2.2. Affinity Chromatography Resins
- 9.2.3. Size Exclusion Chromatography Resins
- 9.2.4. Hydrophobic Interaction Chromatography Resins
- 9.2.5. Other Technologies
- 9.3. Market Analysis, Insights and Forecast - by End-user Industry
- 9.3.1. Pharmaceuticals
- 9.3.1.1. Biotechnology
- 9.3.1.2. Drug Discovery
- 9.3.1.3. Drug Production
- 9.3.2. Water and Environmental Agencies
- 9.3.3. Food and Beverages
- 9.3.4. Other End-user Industries
- 9.3.1. Pharmaceuticals
- 9.1. Market Analysis, Insights and Forecast - by Origin
- 10. Competitive Analysis
- 10.1. Global Market Share Analysis 2025
- 10.2. Company Profiles
- 10.2.1 Repligen Corporation
- 10.2.1.1. Overview
- 10.2.1.2. Products
- 10.2.1.3. SWOT Analysis
- 10.2.1.4. Recent Developments
- 10.2.1.5. Financials (Based on Availability)
- 10.2.2 General Electric
- 10.2.2.1. Overview
- 10.2.2.2. Products
- 10.2.2.3. SWOT Analysis
- 10.2.2.4. Recent Developments
- 10.2.2.5. Financials (Based on Availability)
- 10.2.3 Bio-Rad Laboratories Inc
- 10.2.3.1. Overview
- 10.2.3.2. Products
- 10.2.3.3. SWOT Analysis
- 10.2.3.4. Recent Developments
- 10.2.3.5. Financials (Based on Availability)
- 10.2.4 Merck KGaA
- 10.2.4.1. Overview
- 10.2.4.2. Products
- 10.2.4.3. SWOT Analysis
- 10.2.4.4. Recent Developments
- 10.2.4.5. Financials (Based on Availability)
- 10.2.5 Mitsubishi Chemical Corporation
- 10.2.5.1. Overview
- 10.2.5.2. Products
- 10.2.5.3. SWOT Analysis
- 10.2.5.4. Recent Developments
- 10.2.5.5. Financials (Based on Availability)
- 10.2.6 Dupont
- 10.2.6.1. Overview
- 10.2.6.2. Products
- 10.2.6.3. SWOT Analysis
- 10.2.6.4. Recent Developments
- 10.2.6.5. Financials (Based on Availability)
- 10.2.7 Perkinelmer Inc
- 10.2.7.1. Overview
- 10.2.7.2. Products
- 10.2.7.3. SWOT Analysis
- 10.2.7.4. Recent Developments
- 10.2.7.5. Financials (Based on Availability)
- 10.2.8 Pall Corporation
- 10.2.8.1. Overview
- 10.2.8.2. Products
- 10.2.8.3. SWOT Analysis
- 10.2.8.4. Recent Developments
- 10.2.8.5. Financials (Based on Availability)
- 10.2.9 Tosoh Bioscience LLC*List Not Exhaustive
- 10.2.9.1. Overview
- 10.2.9.2. Products
- 10.2.9.3. SWOT Analysis
- 10.2.9.4. Recent Developments
- 10.2.9.5. Financials (Based on Availability)
- 10.2.10 Purolite
- 10.2.10.1. Overview
- 10.2.10.2. Products
- 10.2.10.3. SWOT Analysis
- 10.2.10.4. Recent Developments
- 10.2.10.5. Financials (Based on Availability)
- 10.2.11 Agilient Technologies
- 10.2.11.1. Overview
- 10.2.11.2. Products
- 10.2.11.3. SWOT Analysis
- 10.2.11.4. Recent Developments
- 10.2.11.5. Financials (Based on Availability)
- 10.2.12 Avantor Inc
- 10.2.12.1. Overview
- 10.2.12.2. Products
- 10.2.12.3. SWOT Analysis
- 10.2.12.4. Recent Developments
- 10.2.12.5. Financials (Based on Availability)
- 10.2.13 Thermo Fisher Scientific
- 10.2.13.1. Overview
- 10.2.13.2. Products
- 10.2.13.3. SWOT Analysis
- 10.2.13.4. Recent Developments
- 10.2.13.5. Financials (Based on Availability)
- 10.2.1 Repligen Corporation
List of Figures
- Figure 1: Global Chromatography Resins Market Revenue Breakdown (Million, %) by Region 2025 & 2033
- Figure 2: Global Chromatography Resins Market Volume Breakdown (K Tons, %) by Region 2025 & 2033
- Figure 3: Asia Pacific Chromatography Resins Market Revenue (Million), by Origin 2025 & 2033
- Figure 4: Asia Pacific Chromatography Resins Market Volume (K Tons), by Origin 2025 & 2033
- Figure 5: Asia Pacific Chromatography Resins Market Revenue Share (%), by Origin 2025 & 2033
- Figure 6: Asia Pacific Chromatography Resins Market Volume Share (%), by Origin 2025 & 2033
- Figure 7: Asia Pacific Chromatography Resins Market Revenue (Million), by Technology 2025 & 2033
- Figure 8: Asia Pacific Chromatography Resins Market Volume (K Tons), by Technology 2025 & 2033
- Figure 9: Asia Pacific Chromatography Resins Market Revenue Share (%), by Technology 2025 & 2033
- Figure 10: Asia Pacific Chromatography Resins Market Volume Share (%), by Technology 2025 & 2033
- Figure 11: Asia Pacific Chromatography Resins Market Revenue (Million), by End-user Industry 2025 & 2033
- Figure 12: Asia Pacific Chromatography Resins Market Volume (K Tons), by End-user Industry 2025 & 2033
- Figure 13: Asia Pacific Chromatography Resins Market Revenue Share (%), by End-user Industry 2025 & 2033
- Figure 14: Asia Pacific Chromatography Resins Market Volume Share (%), by End-user Industry 2025 & 2033
- Figure 15: Asia Pacific Chromatography Resins Market Revenue (Million), by Country 2025 & 2033
- Figure 16: Asia Pacific Chromatography Resins Market Volume (K Tons), by Country 2025 & 2033
- Figure 17: Asia Pacific Chromatography Resins Market Revenue Share (%), by Country 2025 & 2033
- Figure 18: Asia Pacific Chromatography Resins Market Volume Share (%), by Country 2025 & 2033
- Figure 19: North America Chromatography Resins Market Revenue (Million), by Origin 2025 & 2033
- Figure 20: North America Chromatography Resins Market Volume (K Tons), by Origin 2025 & 2033
- Figure 21: North America Chromatography Resins Market Revenue Share (%), by Origin 2025 & 2033
- Figure 22: North America Chromatography Resins Market Volume Share (%), by Origin 2025 & 2033
- Figure 23: North America Chromatography Resins Market Revenue (Million), by Technology 2025 & 2033
- Figure 24: North America Chromatography Resins Market Volume (K Tons), by Technology 2025 & 2033
- Figure 25: North America Chromatography Resins Market Revenue Share (%), by Technology 2025 & 2033
- Figure 26: North America Chromatography Resins Market Volume Share (%), by Technology 2025 & 2033
- Figure 27: North America Chromatography Resins Market Revenue (Million), by End-user Industry 2025 & 2033
- Figure 28: North America Chromatography Resins Market Volume (K Tons), by End-user Industry 2025 & 2033
- Figure 29: North America Chromatography Resins Market Revenue Share (%), by End-user Industry 2025 & 2033
- Figure 30: North America Chromatography Resins Market Volume Share (%), by End-user Industry 2025 & 2033
- Figure 31: North America Chromatography Resins Market Revenue (Million), by Country 2025 & 2033
- Figure 32: North America Chromatography Resins Market Volume (K Tons), by Country 2025 & 2033
- Figure 33: North America Chromatography Resins Market Revenue Share (%), by Country 2025 & 2033
- Figure 34: North America Chromatography Resins Market Volume Share (%), by Country 2025 & 2033
- Figure 35: Europe Chromatography Resins Market Revenue (Million), by Origin 2025 & 2033
- Figure 36: Europe Chromatography Resins Market Volume (K Tons), by Origin 2025 & 2033
- Figure 37: Europe Chromatography Resins Market Revenue Share (%), by Origin 2025 & 2033
- Figure 38: Europe Chromatography Resins Market Volume Share (%), by Origin 2025 & 2033
- Figure 39: Europe Chromatography Resins Market Revenue (Million), by Technology 2025 & 2033
- Figure 40: Europe Chromatography Resins Market Volume (K Tons), by Technology 2025 & 2033
- Figure 41: Europe Chromatography Resins Market Revenue Share (%), by Technology 2025 & 2033
- Figure 42: Europe Chromatography Resins Market Volume Share (%), by Technology 2025 & 2033
- Figure 43: Europe Chromatography Resins Market Revenue (Million), by End-user Industry 2025 & 2033
- Figure 44: Europe Chromatography Resins Market Volume (K Tons), by End-user Industry 2025 & 2033
- Figure 45: Europe Chromatography Resins Market Revenue Share (%), by End-user Industry 2025 & 2033
- Figure 46: Europe Chromatography Resins Market Volume Share (%), by End-user Industry 2025 & 2033
- Figure 47: Europe Chromatography Resins Market Revenue (Million), by Country 2025 & 2033
- Figure 48: Europe Chromatography Resins Market Volume (K Tons), by Country 2025 & 2033
- Figure 49: Europe Chromatography Resins Market Revenue Share (%), by Country 2025 & 2033
- Figure 50: Europe Chromatography Resins Market Volume Share (%), by Country 2025 & 2033
- Figure 51: Rest of the World Chromatography Resins Market Revenue (Million), by Origin 2025 & 2033
- Figure 52: Rest of the World Chromatography Resins Market Volume (K Tons), by Origin 2025 & 2033
- Figure 53: Rest of the World Chromatography Resins Market Revenue Share (%), by Origin 2025 & 2033
- Figure 54: Rest of the World Chromatography Resins Market Volume Share (%), by Origin 2025 & 2033
- Figure 55: Rest of the World Chromatography Resins Market Revenue (Million), by Technology 2025 & 2033
- Figure 56: Rest of the World Chromatography Resins Market Volume (K Tons), by Technology 2025 & 2033
- Figure 57: Rest of the World Chromatography Resins Market Revenue Share (%), by Technology 2025 & 2033
- Figure 58: Rest of the World Chromatography Resins Market Volume Share (%), by Technology 2025 & 2033
- Figure 59: Rest of the World Chromatography Resins Market Revenue (Million), by End-user Industry 2025 & 2033
- Figure 60: Rest of the World Chromatography Resins Market Volume (K Tons), by End-user Industry 2025 & 2033
- Figure 61: Rest of the World Chromatography Resins Market Revenue Share (%), by End-user Industry 2025 & 2033
- Figure 62: Rest of the World Chromatography Resins Market Volume Share (%), by End-user Industry 2025 & 2033
- Figure 63: Rest of the World Chromatography Resins Market Revenue (Million), by Country 2025 & 2033
- Figure 64: Rest of the World Chromatography Resins Market Volume (K Tons), by Country 2025 & 2033
- Figure 65: Rest of the World Chromatography Resins Market Revenue Share (%), by Country 2025 & 2033
- Figure 66: Rest of the World Chromatography Resins Market Volume Share (%), by Country 2025 & 2033
List of Tables
- Table 1: Global Chromatography Resins Market Revenue Million Forecast, by Origin 2020 & 2033
- Table 2: Global Chromatography Resins Market Volume K Tons Forecast, by Origin 2020 & 2033
- Table 3: Global Chromatography Resins Market Revenue Million Forecast, by Technology 2020 & 2033
- Table 4: Global Chromatography Resins Market Volume K Tons Forecast, by Technology 2020 & 2033
- Table 5: Global Chromatography Resins Market Revenue Million Forecast, by End-user Industry 2020 & 2033
- Table 6: Global Chromatography Resins Market Volume K Tons Forecast, by End-user Industry 2020 & 2033
- Table 7: Global Chromatography Resins Market Revenue Million Forecast, by Region 2020 & 2033
- Table 8: Global Chromatography Resins Market Volume K Tons Forecast, by Region 2020 & 2033
- Table 9: Global Chromatography Resins Market Revenue Million Forecast, by Origin 2020 & 2033
- Table 10: Global Chromatography Resins Market Volume K Tons Forecast, by Origin 2020 & 2033
- Table 11: Global Chromatography Resins Market Revenue Million Forecast, by Technology 2020 & 2033
- Table 12: Global Chromatography Resins Market Volume K Tons Forecast, by Technology 2020 & 2033
- Table 13: Global Chromatography Resins Market Revenue Million Forecast, by End-user Industry 2020 & 2033
- Table 14: Global Chromatography Resins Market Volume K Tons Forecast, by End-user Industry 2020 & 2033
- Table 15: Global Chromatography Resins Market Revenue Million Forecast, by Country 2020 & 2033
- Table 16: Global Chromatography Resins Market Volume K Tons Forecast, by Country 2020 & 2033
- Table 17: China Chromatography Resins Market Revenue (Million) Forecast, by Application 2020 & 2033
- Table 18: China Chromatography Resins Market Volume (K Tons) Forecast, by Application 2020 & 2033
- Table 19: India Chromatography Resins Market Revenue (Million) Forecast, by Application 2020 & 2033
- Table 20: India Chromatography Resins Market Volume (K Tons) Forecast, by Application 2020 & 2033
- Table 21: Japan Chromatography Resins Market Revenue (Million) Forecast, by Application 2020 & 2033
- Table 22: Japan Chromatography Resins Market Volume (K Tons) Forecast, by Application 2020 & 2033
- Table 23: Rest of Asia Pacific Chromatography Resins Market Revenue (Million) Forecast, by Application 2020 & 2033
- Table 24: Rest of Asia Pacific Chromatography Resins Market Volume (K Tons) Forecast, by Application 2020 & 2033
- Table 25: Global Chromatography Resins Market Revenue Million Forecast, by Origin 2020 & 2033
- Table 26: Global Chromatography Resins Market Volume K Tons Forecast, by Origin 2020 & 2033
- Table 27: Global Chromatography Resins Market Revenue Million Forecast, by Technology 2020 & 2033
- Table 28: Global Chromatography Resins Market Volume K Tons Forecast, by Technology 2020 & 2033
- Table 29: Global Chromatography Resins Market Revenue Million Forecast, by End-user Industry 2020 & 2033
- Table 30: Global Chromatography Resins Market Volume K Tons Forecast, by End-user Industry 2020 & 2033
- Table 31: Global Chromatography Resins Market Revenue Million Forecast, by Country 2020 & 2033
- Table 32: Global Chromatography Resins Market Volume K Tons Forecast, by Country 2020 & 2033
- Table 33: United States Chromatography Resins Market Revenue (Million) Forecast, by Application 2020 & 2033
- Table 34: United States Chromatography Resins Market Volume (K Tons) Forecast, by Application 2020 & 2033
- Table 35: Canada Chromatography Resins Market Revenue (Million) Forecast, by Application 2020 & 2033
- Table 36: Canada Chromatography Resins Market Volume (K Tons) Forecast, by Application 2020 & 2033
- Table 37: Mexico Chromatography Resins Market Revenue (Million) Forecast, by Application 2020 & 2033
- Table 38: Mexico Chromatography Resins Market Volume (K Tons) Forecast, by Application 2020 & 2033
- Table 39: Global Chromatography Resins Market Revenue Million Forecast, by Origin 2020 & 2033
- Table 40: Global Chromatography Resins Market Volume K Tons Forecast, by Origin 2020 & 2033
- Table 41: Global Chromatography Resins Market Revenue Million Forecast, by Technology 2020 & 2033
- Table 42: Global Chromatography Resins Market Volume K Tons Forecast, by Technology 2020 & 2033
- Table 43: Global Chromatography Resins Market Revenue Million Forecast, by End-user Industry 2020 & 2033
- Table 44: Global Chromatography Resins Market Volume K Tons Forecast, by End-user Industry 2020 & 2033
- Table 45: Global Chromatography Resins Market Revenue Million Forecast, by Country 2020 & 2033
- Table 46: Global Chromatography Resins Market Volume K Tons Forecast, by Country 2020 & 2033
- Table 47: Germany Chromatography Resins Market Revenue (Million) Forecast, by Application 2020 & 2033
- Table 48: Germany Chromatography Resins Market Volume (K Tons) Forecast, by Application 2020 & 2033
- Table 49: United Kingdom Chromatography Resins Market Revenue (Million) Forecast, by Application 2020 & 2033
- Table 50: United Kingdom Chromatography Resins Market Volume (K Tons) Forecast, by Application 2020 & 2033
- Table 51: Italy Chromatography Resins Market Revenue (Million) Forecast, by Application 2020 & 2033
- Table 52: Italy Chromatography Resins Market Volume (K Tons) Forecast, by Application 2020 & 2033
- Table 53: France Chromatography Resins Market Revenue (Million) Forecast, by Application 2020 & 2033
- Table 54: France Chromatography Resins Market Volume (K Tons) Forecast, by Application 2020 & 2033
- Table 55: Switzerland Chromatography Resins Market Revenue (Million) Forecast, by Application 2020 & 2033
- Table 56: Switzerland Chromatography Resins Market Volume (K Tons) Forecast, by Application 2020 & 2033
- Table 57: Rest of Europe Chromatography Resins Market Revenue (Million) Forecast, by Application 2020 & 2033
- Table 58: Rest of Europe Chromatography Resins Market Volume (K Tons) Forecast, by Application 2020 & 2033
- Table 59: Global Chromatography Resins Market Revenue Million Forecast, by Origin 2020 & 2033
- Table 60: Global Chromatography Resins Market Volume K Tons Forecast, by Origin 2020 & 2033
- Table 61: Global Chromatography Resins Market Revenue Million Forecast, by Technology 2020 & 2033
- Table 62: Global Chromatography Resins Market Volume K Tons Forecast, by Technology 2020 & 2033
- Table 63: Global Chromatography Resins Market Revenue Million Forecast, by End-user Industry 2020 & 2033
- Table 64: Global Chromatography Resins Market Volume K Tons Forecast, by End-user Industry 2020 & 2033
- Table 65: Global Chromatography Resins Market Revenue Million Forecast, by Country 2020 & 2033
- Table 66: Global Chromatography Resins Market Volume K Tons Forecast, by Country 2020 & 2033
- Table 67: South America Chromatography Resins Market Revenue (Million) Forecast, by Application 2020 & 2033
- Table 68: South America Chromatography Resins Market Volume (K Tons) Forecast, by Application 2020 & 2033
- Table 69: Middle East and Africa Chromatography Resins Market Revenue (Million) Forecast, by Application 2020 & 2033
- Table 70: Middle East and Africa Chromatography Resins Market Volume (K Tons) Forecast, by Application 2020 & 2033
Frequently Asked Questions
1. What is the projected Compound Annual Growth Rate (CAGR) of the Chromatography Resins Market?
The projected CAGR is approximately > 7.00%.
2. Which companies are prominent players in the Chromatography Resins Market?
Key companies in the market include Repligen Corporation, General Electric, Bio-Rad Laboratories Inc, Merck KGaA, Mitsubishi Chemical Corporation, Dupont, Perkinelmer Inc, Pall Corporation, Tosoh Bioscience LLC*List Not Exhaustive, Purolite, Agilient Technologies, Avantor Inc, Thermo Fisher Scientific.
3. What are the main segments of the Chromatography Resins Market?
The market segments include Origin, Technology, End-user Industry.
4. Can you provide details about the market size?
The market size is estimated to be USD 2480 Million as of 2022.
5. What are some drivers contributing to market growth?
; Rising Demand from the Pharmaceutical Sector; Technological Advancements in Chromatography Resins; Increasing Importance of Chromatography Tests in Drug Approvals.
6. What are the notable trends driving market growth?
Increasing Demand from Pharmaceutical Sector.
7. Are there any restraints impacting market growth?
; Lack of Professional Expertise in the Emerging Countries; High Costs vs. Productivity of Chromatography Systems.
8. Can you provide examples of recent developments in the market?
In 2021, Repligen Corporation acquired Pall Corporation's Chromatography and Filtration business. In 2022, Thermo Fisher Scientific launched a new line of chromatography resins designed for high-throughput biopharmaceutical purification.
9. What pricing options are available for accessing the report?
Pricing options include single-user, multi-user, and enterprise licenses priced at USD 4750, USD 5250, and USD 8750 respectively.
10. Is the market size provided in terms of value or volume?
The market size is provided in terms of value, measured in Million and volume, measured in K Tons.
11. Are there any specific market keywords associated with the report?
Yes, the market keyword associated with the report is "Chromatography Resins Market," which aids in identifying and referencing the specific market segment covered.
12. How do I determine which pricing option suits my needs best?
The pricing options vary based on user requirements and access needs. Individual users may opt for single-user licenses, while businesses requiring broader access may choose multi-user or enterprise licenses for cost-effective access to the report.
13. Are there any additional resources or data provided in the Chromatography Resins Market report?
While the report offers comprehensive insights, it's advisable to review the specific contents or supplementary materials provided to ascertain if additional resources or data are available.
14. How can I stay updated on further developments or reports in the Chromatography Resins Market?
To stay informed about further developments, trends, and reports in the Chromatography Resins Market, consider subscribing to industry newsletters, following relevant companies and organizations, or regularly checking reputable industry news sources and publications.
Methodology
Step 1 - Identification of Relevant Samples Size from Population Database


Step 2 - Approaches for Defining Global Market Size (Value, Volume* & Price*)

Note*: In applicable scenarios
Step 3 - Data Sources
Primary Research
- Web Analytics
- Survey Reports
- Research Institute
- Latest Research Reports
- Opinion Leaders
Secondary Research
- Annual Reports
- White Paper
- Latest Press Release
- Industry Association
- Paid Database
- Investor Presentations

Step 4 - Data Triangulation
Involves using different sources of information in order to increase the validity of a study
These sources are likely to be stakeholders in a program - participants, other researchers, program staff, other community members, and so on.
Then we put all data in single framework & apply various statistical tools to find out the dynamic on the market.
During the analysis stage, feedback from the stakeholder groups would be compared to determine areas of agreement as well as areas of divergence