

Key Insights
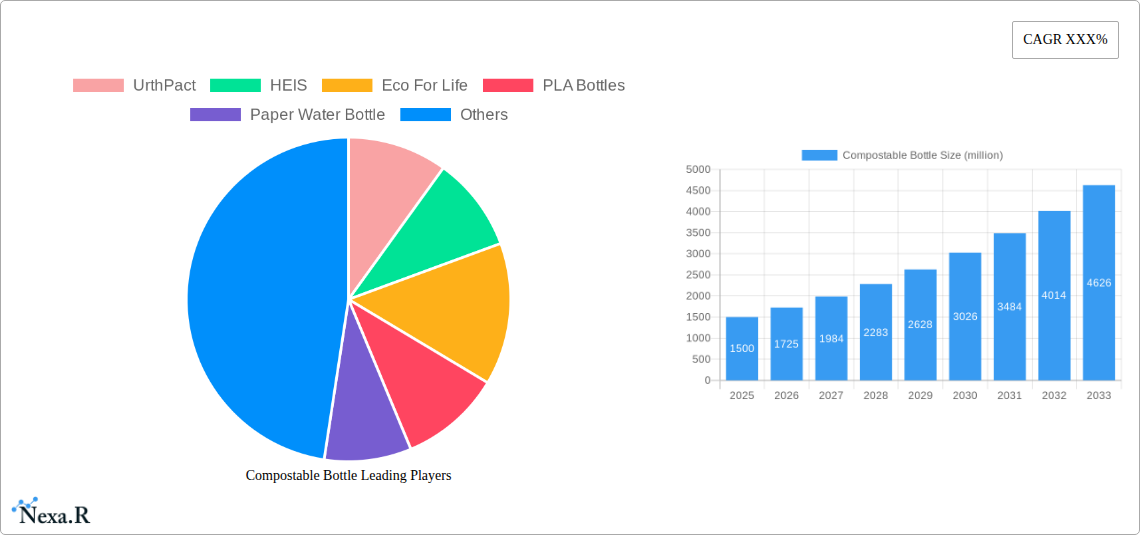
The compostable bottle market is experiencing significant growth, driven by increasing consumer awareness of environmental sustainability and the urgent need to reduce plastic waste. The market, while currently relatively nascent, is projected to expand considerably over the next decade, fueled by stringent government regulations on single-use plastics and a burgeoning demand for eco-friendly packaging solutions. Key players such as UrthPact, HEIS, Eco For Life, and others are actively innovating and expanding their product lines to cater to this growing market segment. The rising popularity of plant-based materials like PLA (polylactic acid) and paper-based alternatives is further driving market expansion. While challenges remain, including the higher production costs compared to conventional plastic bottles and potential limitations in terms of durability and scalability, the market's trajectory indicates a substantial upward trend. Technological advancements focusing on improved biodegradability and compostability, coupled with targeted consumer education campaigns, are expected to overcome these barriers and unlock even greater market potential.
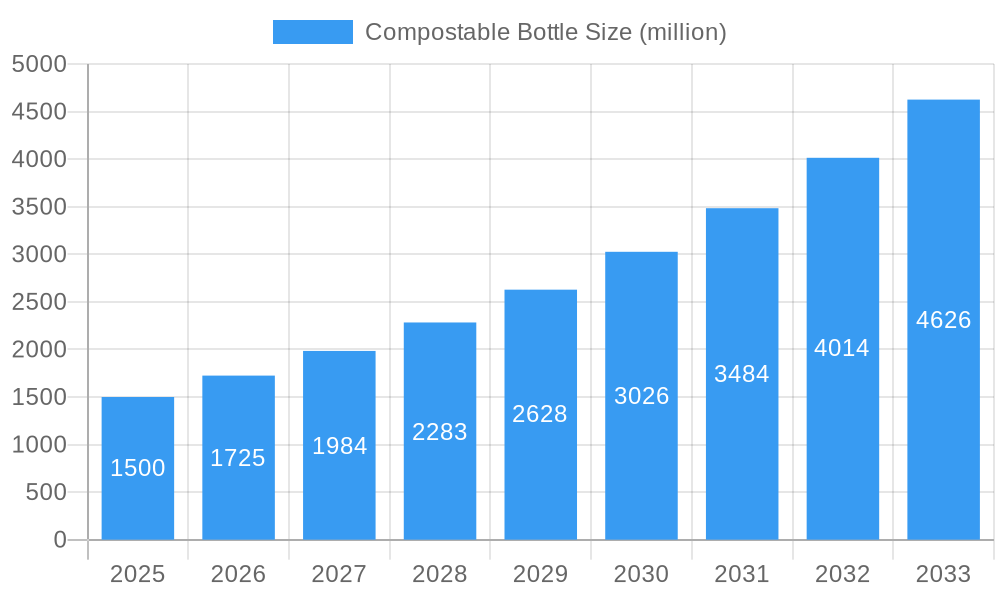
Compostable Bottle Market Size (In Billion)
The segmentation of the market likely includes variations based on material type (PLA, paper, other bioplastics), bottle size, end-use application (water, beverages, other), and distribution channels. Regional variations in consumer preferences and regulatory landscapes will also influence market growth. North America and Europe are expected to be leading regions, given their high environmental awareness and existing infrastructure for waste management and composting. However, the Asia-Pacific region holds significant potential for future growth due to its large population and rapidly developing economies. The forecast period (2025-2033) suggests considerable expansion, with a projected compound annual growth rate (CAGR) that could reasonably be estimated between 15% and 20%, considering the industry's dynamics and the factors driving its growth. This necessitates a strategic approach from companies focusing on research and development, supply chain optimization, and targeted marketing to tap into the rapidly evolving consumer demand for sustainable packaging solutions.
Compostable Bottle Company Market Share
Compostable Bottle Market Report: 2019-2033
This comprehensive report provides an in-depth analysis of the compostable bottle market, offering invaluable insights for industry professionals, investors, and strategic decision-makers. We examine market dynamics, growth trends, competitive landscapes, and future opportunities across various segments and geographies, focusing on the period 2019-2033, with a base year of 2025. The report leverages extensive primary and secondary research to provide a robust forecast and actionable recommendations. The global compostable bottle market is projected to reach xx million units by 2033, exhibiting a CAGR of xx% during the forecast period (2025-2033).
Compostable Bottle Market Dynamics & Structure
The compostable bottle market is characterized by increasing consumer demand for eco-friendly packaging solutions, driven by growing environmental awareness and stringent regulations. Market concentration is moderate, with several key players competing alongside emerging startups. Technological innovation, particularly in bio-based polymers and advanced composting technologies, is a significant driver. Regulatory frameworks, varying across regions, influence material specifications and end-of-life management. Competitive substitutes include traditional plastic bottles and other sustainable packaging options. M&A activity is expected to increase as larger companies seek to expand their portfolio and secure supply chains.
- Market Concentration: Moderately concentrated, with top 5 players holding xx% market share in 2025.
- Technological Innovation: Focus on improving biodegradability, compostability rates, and barrier properties.
- Regulatory Landscape: Varies significantly across regions, impacting material choices and labeling requirements.
- Competitive Substitutes: Traditional PET bottles, glass bottles, and other sustainable packaging materials.
- End-User Demographics: Growing adoption among environmentally conscious consumers and businesses.
- M&A Trends: Increasing consolidation expected, driven by demand for scale and technological expertise. XX M&A deals predicted in the forecast period.
Compostable Bottle Growth Trends & Insights
The compostable bottle market has experienced significant growth since 2019, driven by factors such as increasing environmental concerns, government regulations promoting sustainable packaging, and rising consumer demand for eco-friendly products. The market size has grown from xx million units in 2019 to xx million units in 2024, reflecting a strong adoption rate across various segments. Technological advancements, particularly in biopolymer development and improved compostability, have further propelled market expansion. Consumer behavior shifts towards sustainability are evident in increased willingness to pay a premium for compostable products. This trend is expected to continue, with a projected CAGR of xx% during the forecast period. Market penetration is expected to reach xx% by 2033.
Dominant Regions, Countries, or Segments in Compostable Bottle
North America and Europe currently dominate the compostable bottle market due to stringent environmental regulations, high consumer awareness, and well-established recycling infrastructure. However, Asia-Pacific is projected to exhibit the highest growth rate, driven by rapid economic growth, increasing disposable incomes, and rising environmental concerns. The food and beverage sector remains the largest segment, but increasing applications in personal care and pharmaceuticals are expected to drive future growth.
- North America: Strong regulatory framework and high consumer demand drive market growth.
- Europe: Similar to North America, high environmental awareness and regulations support market expansion.
- Asia-Pacific: Fastest-growing region due to rising disposable incomes and increasing environmental concerns.
- Key Drivers: Stringent environmental regulations, government incentives, and increasing consumer awareness of sustainability.
Compostable Bottle Product Landscape
Compostable bottles are increasingly available in various materials, including PLA (polylactic acid), PHA (polyhydroxyalkanoates), and other bio-based polymers. These materials offer varying degrees of biodegradability and compostability, depending on the specific formulation and composting conditions. Innovations focus on enhancing barrier properties to extend shelf life and improve product protection. Unique selling propositions include eco-friendliness, reduced carbon footprint, and compostability, differentiating them from traditional plastic bottles.
Key Drivers, Barriers & Challenges in Compostable Bottle
Key Drivers:
- Growing consumer preference for sustainable packaging.
- Stringent environmental regulations and bans on single-use plastics.
- Technological advancements in bio-based polymers and composting technologies.
Key Challenges & Restraints:
- Higher cost compared to traditional plastic bottles.
- Limited availability of appropriate composting infrastructure.
- Concerns about the scalability and reliability of bio-based polymer supply chains.
- Potential issues with compostability under various conditions.
Emerging Opportunities in Compostable Bottle
- Expanding into untapped markets with growing environmental awareness.
- Development of compostable bottles for specialized applications (e.g., pharmaceuticals).
- Collaboration with composting facilities to improve end-of-life management.
- Innovation in materials and designs to enhance performance and reduce cost.
Growth Accelerators in the Compostable Bottle Industry
Technological breakthroughs in biopolymer synthesis and improved barrier properties are key growth catalysts. Strategic partnerships between material suppliers, bottle manufacturers, and brands are also crucial for market expansion. Government policies promoting sustainable packaging and investments in composting infrastructure further accelerate growth.
Key Players Shaping the Compostable Bottle Market
- UrthPact
- HEIS
- Eco For Life
- PLA Bottles
- Paper Water Bottle
- Kagzi Water Bottle
- ENSO Plastics
- Steribottle
Notable Milestones in Compostable Bottle Sector
- 2020: Several major beverage companies announced commitments to using compostable bottles.
- 2021: Significant advancements in bio-based polymer technology improved barrier properties.
- 2022: Increased investment in composting infrastructure in several key markets.
- 2023: Launch of several new compostable bottle designs with enhanced performance.
In-Depth Compostable Bottle Market Outlook
The compostable bottle market is poised for sustained growth, driven by the confluence of technological advancements, changing consumer preferences, and supportive government policies. The market presents significant opportunities for companies that can innovate, scale production, and build robust supply chains. Strategic partnerships and investments in research and development will be crucial for capturing market share and achieving long-term success in this dynamic market.
Compostable Bottle Segmentation
-
1. Application
- 1.1. Residential
- 1.2. Commercial
- 1.3. Others
-
2. Type
- 2.1. Paper
- 2.2. Degradable Plastics
Compostable Bottle Segmentation By Geography
-
1. North America
- 1.1. United States
- 1.2. Canada
- 1.3. Mexico
-
2. South America
- 2.1. Brazil
- 2.2. Argentina
- 2.3. Rest of South America
-
3. Europe
- 3.1. United Kingdom
- 3.2. Germany
- 3.3. France
- 3.4. Italy
- 3.5. Spain
- 3.6. Russia
- 3.7. Benelux
- 3.8. Nordics
- 3.9. Rest of Europe
-
4. Middle East & Africa
- 4.1. Turkey
- 4.2. Israel
- 4.3. GCC
- 4.4. North Africa
- 4.5. South Africa
- 4.6. Rest of Middle East & Africa
-
5. Asia Pacific
- 5.1. China
- 5.2. India
- 5.3. Japan
- 5.4. South Korea
- 5.5. ASEAN
- 5.6. Oceania
- 5.7. Rest of Asia Pacific

Compostable Bottle Regional Market Share
Geographic Coverage of Compostable Bottle
Compostable Bottle REPORT HIGHLIGHTS
| Aspects | Details |
|---|---|
| Study Period | 2020-2034 |
| Base Year | 2025 |
| Estimated Year | 2026 |
| Forecast Period | 2026-2034 |
| Historical Period | 2020-2025 |
| Growth Rate | CAGR of 8.4% from 2020-2034 |
| Segmentation |
|
Table of Contents
- 1. Introduction
- 1.1. Research Scope
- 1.2. Market Segmentation
- 1.3. Research Methodology
- 1.4. Definitions and Assumptions
- 2. Executive Summary
- 2.1. Introduction
- 3. Market Dynamics
- 3.1. Introduction
- 3.2. Market Drivers
- 3.3. Market Restrains
- 3.4. Market Trends
- 4. Market Factor Analysis
- 4.1. Porters Five Forces
- 4.2. Supply/Value Chain
- 4.3. PESTEL analysis
- 4.4. Market Entropy
- 4.5. Patent/Trademark Analysis
- 5. Global Compostable Bottle Analysis, Insights and Forecast, 2020-2032
- 5.1. Market Analysis, Insights and Forecast - by Application
- 5.1.1. Residential
- 5.1.2. Commercial
- 5.1.3. Others
- 5.2. Market Analysis, Insights and Forecast - by Type
- 5.2.1. Paper
- 5.2.2. Degradable Plastics
- 5.3. Market Analysis, Insights and Forecast - by Region
- 5.3.1. North America
- 5.3.2. South America
- 5.3.3. Europe
- 5.3.4. Middle East & Africa
- 5.3.5. Asia Pacific
- 5.1. Market Analysis, Insights and Forecast - by Application
- 6. North America Compostable Bottle Analysis, Insights and Forecast, 2020-2032
- 6.1. Market Analysis, Insights and Forecast - by Application
- 6.1.1. Residential
- 6.1.2. Commercial
- 6.1.3. Others
- 6.2. Market Analysis, Insights and Forecast - by Type
- 6.2.1. Paper
- 6.2.2. Degradable Plastics
- 6.1. Market Analysis, Insights and Forecast - by Application
- 7. South America Compostable Bottle Analysis, Insights and Forecast, 2020-2032
- 7.1. Market Analysis, Insights and Forecast - by Application
- 7.1.1. Residential
- 7.1.2. Commercial
- 7.1.3. Others
- 7.2. Market Analysis, Insights and Forecast - by Type
- 7.2.1. Paper
- 7.2.2. Degradable Plastics
- 7.1. Market Analysis, Insights and Forecast - by Application
- 8. Europe Compostable Bottle Analysis, Insights and Forecast, 2020-2032
- 8.1. Market Analysis, Insights and Forecast - by Application
- 8.1.1. Residential
- 8.1.2. Commercial
- 8.1.3. Others
- 8.2. Market Analysis, Insights and Forecast - by Type
- 8.2.1. Paper
- 8.2.2. Degradable Plastics
- 8.1. Market Analysis, Insights and Forecast - by Application
- 9. Middle East & Africa Compostable Bottle Analysis, Insights and Forecast, 2020-2032
- 9.1. Market Analysis, Insights and Forecast - by Application
- 9.1.1. Residential
- 9.1.2. Commercial
- 9.1.3. Others
- 9.2. Market Analysis, Insights and Forecast - by Type
- 9.2.1. Paper
- 9.2.2. Degradable Plastics
- 9.1. Market Analysis, Insights and Forecast - by Application
- 10. Asia Pacific Compostable Bottle Analysis, Insights and Forecast, 2020-2032
- 10.1. Market Analysis, Insights and Forecast - by Application
- 10.1.1. Residential
- 10.1.2. Commercial
- 10.1.3. Others
- 10.2. Market Analysis, Insights and Forecast - by Type
- 10.2.1. Paper
- 10.2.2. Degradable Plastics
- 10.1. Market Analysis, Insights and Forecast - by Application
- 11. Competitive Analysis
- 11.1. Global Market Share Analysis 2025
- 11.2. Company Profiles
- 11.2.1 UrthPact
- 11.2.1.1. Overview
- 11.2.1.2. Products
- 11.2.1.3. SWOT Analysis
- 11.2.1.4. Recent Developments
- 11.2.1.5. Financials (Based on Availability)
- 11.2.2 HEIS
- 11.2.2.1. Overview
- 11.2.2.2. Products
- 11.2.2.3. SWOT Analysis
- 11.2.2.4. Recent Developments
- 11.2.2.5. Financials (Based on Availability)
- 11.2.3 Eco For Life
- 11.2.3.1. Overview
- 11.2.3.2. Products
- 11.2.3.3. SWOT Analysis
- 11.2.3.4. Recent Developments
- 11.2.3.5. Financials (Based on Availability)
- 11.2.4 PLA Bottles
- 11.2.4.1. Overview
- 11.2.4.2. Products
- 11.2.4.3. SWOT Analysis
- 11.2.4.4. Recent Developments
- 11.2.4.5. Financials (Based on Availability)
- 11.2.5 Paper Water Bottle
- 11.2.5.1. Overview
- 11.2.5.2. Products
- 11.2.5.3. SWOT Analysis
- 11.2.5.4. Recent Developments
- 11.2.5.5. Financials (Based on Availability)
- 11.2.6 Kagzi Water Bottle
- 11.2.6.1. Overview
- 11.2.6.2. Products
- 11.2.6.3. SWOT Analysis
- 11.2.6.4. Recent Developments
- 11.2.6.5. Financials (Based on Availability)
- 11.2.7 ENSO Plastics
- 11.2.7.1. Overview
- 11.2.7.2. Products
- 11.2.7.3. SWOT Analysis
- 11.2.7.4. Recent Developments
- 11.2.7.5. Financials (Based on Availability)
- 11.2.8 Steribottle
- 11.2.8.1. Overview
- 11.2.8.2. Products
- 11.2.8.3. SWOT Analysis
- 11.2.8.4. Recent Developments
- 11.2.8.5. Financials (Based on Availability)
- 11.2.1 UrthPact
List of Figures
- Figure 1: Global Compostable Bottle Revenue Breakdown (undefined, %) by Region 2025 & 2033
- Figure 2: Global Compostable Bottle Volume Breakdown (K, %) by Region 2025 & 2033
- Figure 3: North America Compostable Bottle Revenue (undefined), by Application 2025 & 2033
- Figure 4: North America Compostable Bottle Volume (K), by Application 2025 & 2033
- Figure 5: North America Compostable Bottle Revenue Share (%), by Application 2025 & 2033
- Figure 6: North America Compostable Bottle Volume Share (%), by Application 2025 & 2033
- Figure 7: North America Compostable Bottle Revenue (undefined), by Type 2025 & 2033
- Figure 8: North America Compostable Bottle Volume (K), by Type 2025 & 2033
- Figure 9: North America Compostable Bottle Revenue Share (%), by Type 2025 & 2033
- Figure 10: North America Compostable Bottle Volume Share (%), by Type 2025 & 2033
- Figure 11: North America Compostable Bottle Revenue (undefined), by Country 2025 & 2033
- Figure 12: North America Compostable Bottle Volume (K), by Country 2025 & 2033
- Figure 13: North America Compostable Bottle Revenue Share (%), by Country 2025 & 2033
- Figure 14: North America Compostable Bottle Volume Share (%), by Country 2025 & 2033
- Figure 15: South America Compostable Bottle Revenue (undefined), by Application 2025 & 2033
- Figure 16: South America Compostable Bottle Volume (K), by Application 2025 & 2033
- Figure 17: South America Compostable Bottle Revenue Share (%), by Application 2025 & 2033
- Figure 18: South America Compostable Bottle Volume Share (%), by Application 2025 & 2033
- Figure 19: South America Compostable Bottle Revenue (undefined), by Type 2025 & 2033
- Figure 20: South America Compostable Bottle Volume (K), by Type 2025 & 2033
- Figure 21: South America Compostable Bottle Revenue Share (%), by Type 2025 & 2033
- Figure 22: South America Compostable Bottle Volume Share (%), by Type 2025 & 2033
- Figure 23: South America Compostable Bottle Revenue (undefined), by Country 2025 & 2033
- Figure 24: South America Compostable Bottle Volume (K), by Country 2025 & 2033
- Figure 25: South America Compostable Bottle Revenue Share (%), by Country 2025 & 2033
- Figure 26: South America Compostable Bottle Volume Share (%), by Country 2025 & 2033
- Figure 27: Europe Compostable Bottle Revenue (undefined), by Application 2025 & 2033
- Figure 28: Europe Compostable Bottle Volume (K), by Application 2025 & 2033
- Figure 29: Europe Compostable Bottle Revenue Share (%), by Application 2025 & 2033
- Figure 30: Europe Compostable Bottle Volume Share (%), by Application 2025 & 2033
- Figure 31: Europe Compostable Bottle Revenue (undefined), by Type 2025 & 2033
- Figure 32: Europe Compostable Bottle Volume (K), by Type 2025 & 2033
- Figure 33: Europe Compostable Bottle Revenue Share (%), by Type 2025 & 2033
- Figure 34: Europe Compostable Bottle Volume Share (%), by Type 2025 & 2033
- Figure 35: Europe Compostable Bottle Revenue (undefined), by Country 2025 & 2033
- Figure 36: Europe Compostable Bottle Volume (K), by Country 2025 & 2033
- Figure 37: Europe Compostable Bottle Revenue Share (%), by Country 2025 & 2033
- Figure 38: Europe Compostable Bottle Volume Share (%), by Country 2025 & 2033
- Figure 39: Middle East & Africa Compostable Bottle Revenue (undefined), by Application 2025 & 2033
- Figure 40: Middle East & Africa Compostable Bottle Volume (K), by Application 2025 & 2033
- Figure 41: Middle East & Africa Compostable Bottle Revenue Share (%), by Application 2025 & 2033
- Figure 42: Middle East & Africa Compostable Bottle Volume Share (%), by Application 2025 & 2033
- Figure 43: Middle East & Africa Compostable Bottle Revenue (undefined), by Type 2025 & 2033
- Figure 44: Middle East & Africa Compostable Bottle Volume (K), by Type 2025 & 2033
- Figure 45: Middle East & Africa Compostable Bottle Revenue Share (%), by Type 2025 & 2033
- Figure 46: Middle East & Africa Compostable Bottle Volume Share (%), by Type 2025 & 2033
- Figure 47: Middle East & Africa Compostable Bottle Revenue (undefined), by Country 2025 & 2033
- Figure 48: Middle East & Africa Compostable Bottle Volume (K), by Country 2025 & 2033
- Figure 49: Middle East & Africa Compostable Bottle Revenue Share (%), by Country 2025 & 2033
- Figure 50: Middle East & Africa Compostable Bottle Volume Share (%), by Country 2025 & 2033
- Figure 51: Asia Pacific Compostable Bottle Revenue (undefined), by Application 2025 & 2033
- Figure 52: Asia Pacific Compostable Bottle Volume (K), by Application 2025 & 2033
- Figure 53: Asia Pacific Compostable Bottle Revenue Share (%), by Application 2025 & 2033
- Figure 54: Asia Pacific Compostable Bottle Volume Share (%), by Application 2025 & 2033
- Figure 55: Asia Pacific Compostable Bottle Revenue (undefined), by Type 2025 & 2033
- Figure 56: Asia Pacific Compostable Bottle Volume (K), by Type 2025 & 2033
- Figure 57: Asia Pacific Compostable Bottle Revenue Share (%), by Type 2025 & 2033
- Figure 58: Asia Pacific Compostable Bottle Volume Share (%), by Type 2025 & 2033
- Figure 59: Asia Pacific Compostable Bottle Revenue (undefined), by Country 2025 & 2033
- Figure 60: Asia Pacific Compostable Bottle Volume (K), by Country 2025 & 2033
- Figure 61: Asia Pacific Compostable Bottle Revenue Share (%), by Country 2025 & 2033
- Figure 62: Asia Pacific Compostable Bottle Volume Share (%), by Country 2025 & 2033
List of Tables
- Table 1: Global Compostable Bottle Revenue undefined Forecast, by Application 2020 & 2033
- Table 2: Global Compostable Bottle Volume K Forecast, by Application 2020 & 2033
- Table 3: Global Compostable Bottle Revenue undefined Forecast, by Type 2020 & 2033
- Table 4: Global Compostable Bottle Volume K Forecast, by Type 2020 & 2033
- Table 5: Global Compostable Bottle Revenue undefined Forecast, by Region 2020 & 2033
- Table 6: Global Compostable Bottle Volume K Forecast, by Region 2020 & 2033
- Table 7: Global Compostable Bottle Revenue undefined Forecast, by Application 2020 & 2033
- Table 8: Global Compostable Bottle Volume K Forecast, by Application 2020 & 2033
- Table 9: Global Compostable Bottle Revenue undefined Forecast, by Type 2020 & 2033
- Table 10: Global Compostable Bottle Volume K Forecast, by Type 2020 & 2033
- Table 11: Global Compostable Bottle Revenue undefined Forecast, by Country 2020 & 2033
- Table 12: Global Compostable Bottle Volume K Forecast, by Country 2020 & 2033
- Table 13: United States Compostable Bottle Revenue (undefined) Forecast, by Application 2020 & 2033
- Table 14: United States Compostable Bottle Volume (K) Forecast, by Application 2020 & 2033
- Table 15: Canada Compostable Bottle Revenue (undefined) Forecast, by Application 2020 & 2033
- Table 16: Canada Compostable Bottle Volume (K) Forecast, by Application 2020 & 2033
- Table 17: Mexico Compostable Bottle Revenue (undefined) Forecast, by Application 2020 & 2033
- Table 18: Mexico Compostable Bottle Volume (K) Forecast, by Application 2020 & 2033
- Table 19: Global Compostable Bottle Revenue undefined Forecast, by Application 2020 & 2033
- Table 20: Global Compostable Bottle Volume K Forecast, by Application 2020 & 2033
- Table 21: Global Compostable Bottle Revenue undefined Forecast, by Type 2020 & 2033
- Table 22: Global Compostable Bottle Volume K Forecast, by Type 2020 & 2033
- Table 23: Global Compostable Bottle Revenue undefined Forecast, by Country 2020 & 2033
- Table 24: Global Compostable Bottle Volume K Forecast, by Country 2020 & 2033
- Table 25: Brazil Compostable Bottle Revenue (undefined) Forecast, by Application 2020 & 2033
- Table 26: Brazil Compostable Bottle Volume (K) Forecast, by Application 2020 & 2033
- Table 27: Argentina Compostable Bottle Revenue (undefined) Forecast, by Application 2020 & 2033
- Table 28: Argentina Compostable Bottle Volume (K) Forecast, by Application 2020 & 2033
- Table 29: Rest of South America Compostable Bottle Revenue (undefined) Forecast, by Application 2020 & 2033
- Table 30: Rest of South America Compostable Bottle Volume (K) Forecast, by Application 2020 & 2033
- Table 31: Global Compostable Bottle Revenue undefined Forecast, by Application 2020 & 2033
- Table 32: Global Compostable Bottle Volume K Forecast, by Application 2020 & 2033
- Table 33: Global Compostable Bottle Revenue undefined Forecast, by Type 2020 & 2033
- Table 34: Global Compostable Bottle Volume K Forecast, by Type 2020 & 2033
- Table 35: Global Compostable Bottle Revenue undefined Forecast, by Country 2020 & 2033
- Table 36: Global Compostable Bottle Volume K Forecast, by Country 2020 & 2033
- Table 37: United Kingdom Compostable Bottle Revenue (undefined) Forecast, by Application 2020 & 2033
- Table 38: United Kingdom Compostable Bottle Volume (K) Forecast, by Application 2020 & 2033
- Table 39: Germany Compostable Bottle Revenue (undefined) Forecast, by Application 2020 & 2033
- Table 40: Germany Compostable Bottle Volume (K) Forecast, by Application 2020 & 2033
- Table 41: France Compostable Bottle Revenue (undefined) Forecast, by Application 2020 & 2033
- Table 42: France Compostable Bottle Volume (K) Forecast, by Application 2020 & 2033
- Table 43: Italy Compostable Bottle Revenue (undefined) Forecast, by Application 2020 & 2033
- Table 44: Italy Compostable Bottle Volume (K) Forecast, by Application 2020 & 2033
- Table 45: Spain Compostable Bottle Revenue (undefined) Forecast, by Application 2020 & 2033
- Table 46: Spain Compostable Bottle Volume (K) Forecast, by Application 2020 & 2033
- Table 47: Russia Compostable Bottle Revenue (undefined) Forecast, by Application 2020 & 2033
- Table 48: Russia Compostable Bottle Volume (K) Forecast, by Application 2020 & 2033
- Table 49: Benelux Compostable Bottle Revenue (undefined) Forecast, by Application 2020 & 2033
- Table 50: Benelux Compostable Bottle Volume (K) Forecast, by Application 2020 & 2033
- Table 51: Nordics Compostable Bottle Revenue (undefined) Forecast, by Application 2020 & 2033
- Table 52: Nordics Compostable Bottle Volume (K) Forecast, by Application 2020 & 2033
- Table 53: Rest of Europe Compostable Bottle Revenue (undefined) Forecast, by Application 2020 & 2033
- Table 54: Rest of Europe Compostable Bottle Volume (K) Forecast, by Application 2020 & 2033
- Table 55: Global Compostable Bottle Revenue undefined Forecast, by Application 2020 & 2033
- Table 56: Global Compostable Bottle Volume K Forecast, by Application 2020 & 2033
- Table 57: Global Compostable Bottle Revenue undefined Forecast, by Type 2020 & 2033
- Table 58: Global Compostable Bottle Volume K Forecast, by Type 2020 & 2033
- Table 59: Global Compostable Bottle Revenue undefined Forecast, by Country 2020 & 2033
- Table 60: Global Compostable Bottle Volume K Forecast, by Country 2020 & 2033
- Table 61: Turkey Compostable Bottle Revenue (undefined) Forecast, by Application 2020 & 2033
- Table 62: Turkey Compostable Bottle Volume (K) Forecast, by Application 2020 & 2033
- Table 63: Israel Compostable Bottle Revenue (undefined) Forecast, by Application 2020 & 2033
- Table 64: Israel Compostable Bottle Volume (K) Forecast, by Application 2020 & 2033
- Table 65: GCC Compostable Bottle Revenue (undefined) Forecast, by Application 2020 & 2033
- Table 66: GCC Compostable Bottle Volume (K) Forecast, by Application 2020 & 2033
- Table 67: North Africa Compostable Bottle Revenue (undefined) Forecast, by Application 2020 & 2033
- Table 68: North Africa Compostable Bottle Volume (K) Forecast, by Application 2020 & 2033
- Table 69: South Africa Compostable Bottle Revenue (undefined) Forecast, by Application 2020 & 2033
- Table 70: South Africa Compostable Bottle Volume (K) Forecast, by Application 2020 & 2033
- Table 71: Rest of Middle East & Africa Compostable Bottle Revenue (undefined) Forecast, by Application 2020 & 2033
- Table 72: Rest of Middle East & Africa Compostable Bottle Volume (K) Forecast, by Application 2020 & 2033
- Table 73: Global Compostable Bottle Revenue undefined Forecast, by Application 2020 & 2033
- Table 74: Global Compostable Bottle Volume K Forecast, by Application 2020 & 2033
- Table 75: Global Compostable Bottle Revenue undefined Forecast, by Type 2020 & 2033
- Table 76: Global Compostable Bottle Volume K Forecast, by Type 2020 & 2033
- Table 77: Global Compostable Bottle Revenue undefined Forecast, by Country 2020 & 2033
- Table 78: Global Compostable Bottle Volume K Forecast, by Country 2020 & 2033
- Table 79: China Compostable Bottle Revenue (undefined) Forecast, by Application 2020 & 2033
- Table 80: China Compostable Bottle Volume (K) Forecast, by Application 2020 & 2033
- Table 81: India Compostable Bottle Revenue (undefined) Forecast, by Application 2020 & 2033
- Table 82: India Compostable Bottle Volume (K) Forecast, by Application 2020 & 2033
- Table 83: Japan Compostable Bottle Revenue (undefined) Forecast, by Application 2020 & 2033
- Table 84: Japan Compostable Bottle Volume (K) Forecast, by Application 2020 & 2033
- Table 85: South Korea Compostable Bottle Revenue (undefined) Forecast, by Application 2020 & 2033
- Table 86: South Korea Compostable Bottle Volume (K) Forecast, by Application 2020 & 2033
- Table 87: ASEAN Compostable Bottle Revenue (undefined) Forecast, by Application 2020 & 2033
- Table 88: ASEAN Compostable Bottle Volume (K) Forecast, by Application 2020 & 2033
- Table 89: Oceania Compostable Bottle Revenue (undefined) Forecast, by Application 2020 & 2033
- Table 90: Oceania Compostable Bottle Volume (K) Forecast, by Application 2020 & 2033
- Table 91: Rest of Asia Pacific Compostable Bottle Revenue (undefined) Forecast, by Application 2020 & 2033
- Table 92: Rest of Asia Pacific Compostable Bottle Volume (K) Forecast, by Application 2020 & 2033
Frequently Asked Questions
1. What is the projected Compound Annual Growth Rate (CAGR) of the Compostable Bottle?
The projected CAGR is approximately 8.4%.
2. Which companies are prominent players in the Compostable Bottle?
Key companies in the market include UrthPact, HEIS, Eco For Life, PLA Bottles, Paper Water Bottle, Kagzi Water Bottle, ENSO Plastics, Steribottle.
3. What are the main segments of the Compostable Bottle?
The market segments include Application, Type.
4. Can you provide details about the market size?
The market size is estimated to be USD XXX N/A as of 2022.
5. What are some drivers contributing to market growth?
N/A
6. What are the notable trends driving market growth?
N/A
7. Are there any restraints impacting market growth?
N/A
8. Can you provide examples of recent developments in the market?
N/A
9. What pricing options are available for accessing the report?
Pricing options include single-user, multi-user, and enterprise licenses priced at USD 3950.00, USD 5925.00, and USD 7900.00 respectively.
10. Is the market size provided in terms of value or volume?
The market size is provided in terms of value, measured in N/A and volume, measured in K.
11. Are there any specific market keywords associated with the report?
Yes, the market keyword associated with the report is "Compostable Bottle," which aids in identifying and referencing the specific market segment covered.
12. How do I determine which pricing option suits my needs best?
The pricing options vary based on user requirements and access needs. Individual users may opt for single-user licenses, while businesses requiring broader access may choose multi-user or enterprise licenses for cost-effective access to the report.
13. Are there any additional resources or data provided in the Compostable Bottle report?
While the report offers comprehensive insights, it's advisable to review the specific contents or supplementary materials provided to ascertain if additional resources or data are available.
14. How can I stay updated on further developments or reports in the Compostable Bottle?
To stay informed about further developments, trends, and reports in the Compostable Bottle, consider subscribing to industry newsletters, following relevant companies and organizations, or regularly checking reputable industry news sources and publications.
Methodology
Step 1 - Identification of Relevant Samples Size from Population Database


Step 2 - Approaches for Defining Global Market Size (Value, Volume* & Price*)

Note*: In applicable scenarios
Step 3 - Data Sources
Primary Research
- Web Analytics
- Survey Reports
- Research Institute
- Latest Research Reports
- Opinion Leaders
Secondary Research
- Annual Reports
- White Paper
- Latest Press Release
- Industry Association
- Paid Database
- Investor Presentations

Step 4 - Data Triangulation
Involves using different sources of information in order to increase the validity of a study
These sources are likely to be stakeholders in a program - participants, other researchers, program staff, other community members, and so on.
Then we put all data in single framework & apply various statistical tools to find out the dynamic on the market.
During the analysis stage, feedback from the stakeholder groups would be compared to determine areas of agreement as well as areas of divergence