

Key Insights
The cosmetics anti-counterfeiting technology market is experiencing robust growth, driven by increasing consumer awareness of counterfeit products and the escalating prevalence of fraudulent cosmetics. The market's expansion is fueled by the rising demand for authentic, high-quality cosmetics and the growing adoption of advanced anti-counterfeiting technologies such as blockchain, RFID tags, and sophisticated digital watermarking. Brand protection is a significant driver, with major cosmetics companies investing heavily in these technologies to safeguard their brand reputation and prevent revenue loss due to counterfeiting. Furthermore, stringent government regulations and increased consumer pressure are pushing manufacturers to implement robust anti-counterfeiting measures. The market is segmented based on technology type (e.g., physical markers, digital technologies, and others), application (e.g., packaging, labeling, and product itself), and geographic region. This segmentation reflects the diverse approaches companies are taking to combat counterfeiting, adapting strategies to specific regional regulatory landscapes and consumer behaviors.
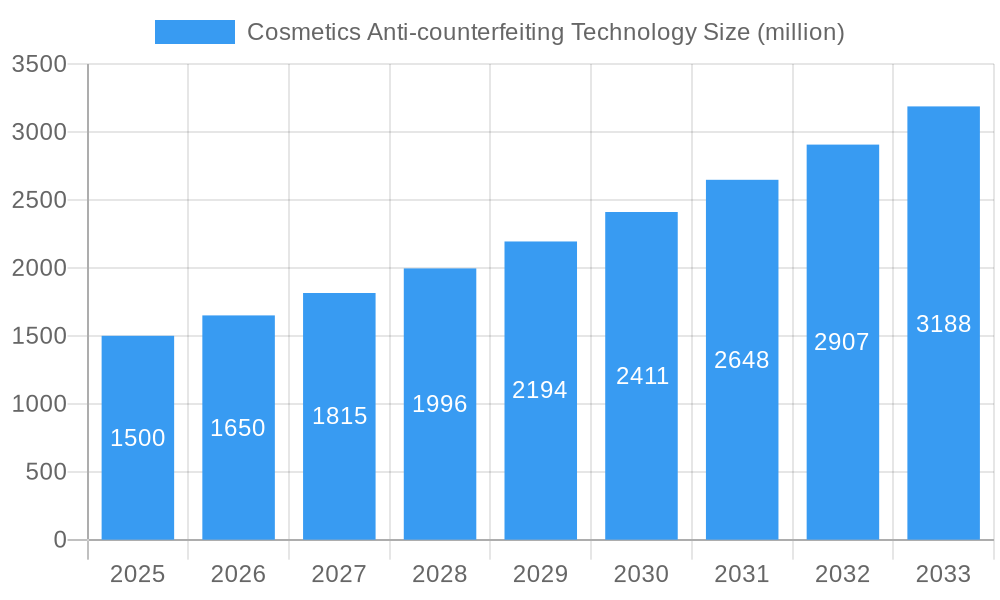
Cosmetics Anti-counterfeiting Technology Market Size (In Billion)
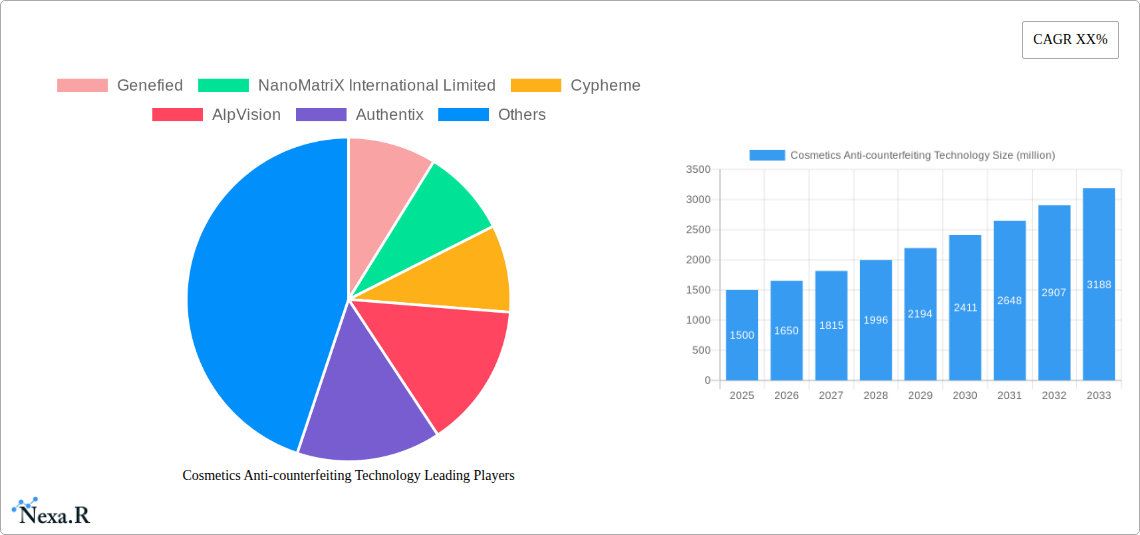
The forecast period, 2025-2033, projects continued strong growth, particularly in regions with high cosmetic consumption and a rising middle class. While the market faces challenges like the high initial investment costs associated with implementing anti-counterfeiting technologies and the potential for sophisticated counterfeiters to circumvent these measures, innovative solutions and increased collaboration across the industry are expected to mitigate these restraints. Leading companies like Genefied, NanoMatriX International Limited, and Authentix are at the forefront of technological innovation, developing and implementing new solutions to enhance the security and traceability of cosmetic products. Future growth will likely be driven by the development of more sophisticated and cost-effective technologies that offer increased ease of use and broader accessibility for companies of all sizes, thereby furthering the market's penetration.
Cosmetics Anti-counterfeiting Technology Company Market Share
Cosmetics Anti-counterfeiting Technology Market Report: 2019-2033
This comprehensive report provides an in-depth analysis of the Cosmetics Anti-counterfeiting Technology market, encompassing market dynamics, growth trends, regional insights, competitive landscape, and future outlook. The study period covers 2019-2033, with a base year of 2025 and a forecast period of 2025-2033. The report segments the market by technology type (e.g., RFID, Blockchain, Holography) and application (e.g., Packaging, Labeling). This detailed analysis caters to industry professionals, investors, and strategic decision-makers seeking a thorough understanding of this rapidly evolving market. The market is expected to reach xx million units by 2033, exhibiting a CAGR of xx% during the forecast period.
Cosmetics Anti-counterfeiting Technology Market Dynamics & Structure
The cosmetics anti-counterfeiting technology market is characterized by moderate concentration, with several key players vying for market share. Technological innovation, driven by advancements in digital security and material science, is a primary growth driver. Stringent regulatory frameworks in several regions are further propelling adoption. Competitive substitutes, such as traditional security seals, are being gradually replaced by more sophisticated solutions. The end-user demographic predominantly comprises large cosmetic manufacturers and distributors concerned about brand protection and consumer safety. M&A activity in the sector has been moderate, with xx deals recorded during the historical period (2019-2024).
- Market Concentration: Moderately concentrated, with top 5 players holding approximately xx% market share in 2025.
- Technological Innovation: Focus on AI-powered authentication, blockchain integration, and advanced serialization techniques.
- Regulatory Landscape: Increasingly stringent regulations in key markets like the EU and US driving adoption.
- Competitive Substitutes: Traditional security features facing obsolescence due to technological advancements.
- End-User Demographics: Primarily large cosmetic manufacturers and distributors.
- M&A Activity: xx deals recorded during 2019-2024, indicating moderate consolidation.
Cosmetics Anti-counterfeiting Technology Growth Trends & Insights
The cosmetics anti-counterfeiting technology market has witnessed robust growth over the past few years. The market size reached xx million units in 2024 and is projected to reach xx million units by 2033. This growth is fueled by increasing consumer awareness of counterfeit products, rising e-commerce adoption, and the growing demand for secure and traceable supply chains. Technological disruptions, including the integration of blockchain and AI, are significantly impacting adoption rates. Consumer behavior shifts toward increased preference for authenticity and brand transparency are also contributing to market expansion. The market penetration rate for anti-counterfeiting technologies within the cosmetics industry is estimated to be xx% in 2025, projected to rise to xx% by 2033. The CAGR for the forecast period (2025-2033) is estimated to be xx%.
Dominant Regions, Countries, or Segments in Cosmetics Anti-counterfeiting Technology
North America currently holds the largest market share, driven by stringent regulations, high consumer awareness of counterfeit products, and strong brand protection practices. The strong economic base and advanced technological infrastructure in the region are key contributors. Europe follows as a significant market, with a similar driver profile. The Asia-Pacific region is anticipated to experience the fastest growth due to increasing disposable incomes, rising e-commerce penetration, and growing regulatory attention.
- North America: Strong regulatory framework, high consumer awareness, and technological advancements driving market dominance.
- Europe: Similar drivers to North America, but with a slightly slower growth rate.
- Asia-Pacific: Fastest growth potential driven by increasing disposable incomes and e-commerce expansion.
- Rest of the World: Moderate growth driven by increasing awareness and regulatory efforts.
Cosmetics Anti-counterfeiting Technology Product Landscape
The market offers a wide range of anti-counterfeiting solutions, including RFID tags, holographic labels, blockchain-based traceability systems, and unique serialization codes. These technologies are integrated into various packaging formats and are designed to enhance product authentication, prevent counterfeiting, and improve supply chain transparency. Recent advancements focus on enhancing security features using AI-powered authentication and integrating these solutions with existing supply chain management systems. This leads to improved efficiency and reduced costs.
Key Drivers, Barriers & Challenges in Cosmetics Anti-counterfeiting Technology
Key Drivers: Increasing prevalence of counterfeit cosmetics, stringent government regulations, growing consumer demand for authenticity, and technological advancements.
Challenges: High implementation costs, compatibility issues across different systems, and the need for standardized industry protocols. Supply chain complexities and integration challenges can result in delays and added expenses, estimated to impact xx% of implementations. Regulatory hurdles vary across regions, posing additional challenges for global brands (impact estimated at xx% in certain markets). Competitive pressures drive constant innovation and require significant R&D investment.
Emerging Opportunities in Cosmetics Anti-counterfeiting Technology
Emerging opportunities exist in developing markets with limited anti-counterfeiting measures, expanding into the e-commerce sector, and integrating advanced technologies such as AI and machine learning for improved detection accuracy. The development of more sustainable and eco-friendly anti-counterfeiting solutions represents a substantial growth area, particularly as consumer consciousness around sustainability increases.
Growth Accelerators in the Cosmetics Anti-counterfeiting Technology Industry
Technological breakthroughs, such as improved sensor technologies and AI-driven authentication, are accelerating market growth. Strategic partnerships between technology providers and cosmetic manufacturers are fostering innovation and adoption. Expansions into untapped markets, such as developing economies and niche cosmetic segments, are also driving market expansion.
Key Players Shaping the Cosmetics Anti-counterfeiting Technology Market
- Genefied
- NanoMatriX International Limited
- Cypheme
- AlpVision
- Authentix
- Zebra Technologies Corp.
- U-NICA Solutions AG
- Alien Technology Corp.
- Hague
- Prooftag
- OpSec
Notable Milestones in Cosmetics Anti-counterfeiting Technology Sector
- 2020: Introduction of AI-powered authentication software by AlpVision.
- 2021: Partnership between Genefied and a major cosmetics manufacturer for blockchain integration.
- 2022: Launch of a new generation of RFID tags by Zebra Technologies.
- 2023: Increased regulatory scrutiny leading to heightened adoption rates.
- 2024: Several successful M&A deals consolidating market players.
In-Depth Cosmetics Anti-counterfeiting Technology Market Outlook
The cosmetics anti-counterfeiting technology market is poised for sustained growth, driven by ongoing technological advancements, increased regulatory pressure, and rising consumer demand for authentic products. Strategic opportunities exist for companies focusing on innovative solutions, efficient supply chain integration, and expansion into emerging markets. The market's future trajectory depends on several factors, including technological breakthroughs, regulatory developments, and the evolving consumer landscape. This promising market offers significant opportunities for businesses willing to navigate its complexities.
Cosmetics Anti-counterfeiting Technology Segmentation
-
1. Application
- 1.1. Online Sales
- 1.2. Offline Sales
-
2. Types
- 2.1. Authentication Technology
- 2.2. Track and Trace Technology
Cosmetics Anti-counterfeiting Technology Segmentation By Geography
-
1. North America
- 1.1. United States
- 1.2. Canada
- 1.3. Mexico
-
2. South America
- 2.1. Brazil
- 2.2. Argentina
- 2.3. Rest of South America
-
3. Europe
- 3.1. United Kingdom
- 3.2. Germany
- 3.3. France
- 3.4. Italy
- 3.5. Spain
- 3.6. Russia
- 3.7. Benelux
- 3.8. Nordics
- 3.9. Rest of Europe
-
4. Middle East & Africa
- 4.1. Turkey
- 4.2. Israel
- 4.3. GCC
- 4.4. North Africa
- 4.5. South Africa
- 4.6. Rest of Middle East & Africa
-
5. Asia Pacific
- 5.1. China
- 5.2. India
- 5.3. Japan
- 5.4. South Korea
- 5.5. ASEAN
- 5.6. Oceania
- 5.7. Rest of Asia Pacific

Cosmetics Anti-counterfeiting Technology Regional Market Share
Geographic Coverage of Cosmetics Anti-counterfeiting Technology
Cosmetics Anti-counterfeiting Technology REPORT HIGHLIGHTS
| Aspects | Details |
|---|---|
| Study Period | 2020-2034 |
| Base Year | 2025 |
| Estimated Year | 2026 |
| Forecast Period | 2026-2034 |
| Historical Period | 2020-2025 |
| Growth Rate | CAGR of 10.8% from 2020-2034 |
| Segmentation |
|
Table of Contents
- 1. Introduction
- 1.1. Research Scope
- 1.2. Market Segmentation
- 1.3. Research Methodology
- 1.4. Definitions and Assumptions
- 2. Executive Summary
- 2.1. Introduction
- 3. Market Dynamics
- 3.1. Introduction
- 3.2. Market Drivers
- 3.3. Market Restrains
- 3.4. Market Trends
- 4. Market Factor Analysis
- 4.1. Porters Five Forces
- 4.2. Supply/Value Chain
- 4.3. PESTEL analysis
- 4.4. Market Entropy
- 4.5. Patent/Trademark Analysis
- 5. Global Cosmetics Anti-counterfeiting Technology Analysis, Insights and Forecast, 2020-2032
- 5.1. Market Analysis, Insights and Forecast - by Application
- 5.1.1. Online Sales
- 5.1.2. Offline Sales
- 5.2. Market Analysis, Insights and Forecast - by Types
- 5.2.1. Authentication Technology
- 5.2.2. Track and Trace Technology
- 5.3. Market Analysis, Insights and Forecast - by Region
- 5.3.1. North America
- 5.3.2. South America
- 5.3.3. Europe
- 5.3.4. Middle East & Africa
- 5.3.5. Asia Pacific
- 5.1. Market Analysis, Insights and Forecast - by Application
- 6. North America Cosmetics Anti-counterfeiting Technology Analysis, Insights and Forecast, 2020-2032
- 6.1. Market Analysis, Insights and Forecast - by Application
- 6.1.1. Online Sales
- 6.1.2. Offline Sales
- 6.2. Market Analysis, Insights and Forecast - by Types
- 6.2.1. Authentication Technology
- 6.2.2. Track and Trace Technology
- 6.1. Market Analysis, Insights and Forecast - by Application
- 7. South America Cosmetics Anti-counterfeiting Technology Analysis, Insights and Forecast, 2020-2032
- 7.1. Market Analysis, Insights and Forecast - by Application
- 7.1.1. Online Sales
- 7.1.2. Offline Sales
- 7.2. Market Analysis, Insights and Forecast - by Types
- 7.2.1. Authentication Technology
- 7.2.2. Track and Trace Technology
- 7.1. Market Analysis, Insights and Forecast - by Application
- 8. Europe Cosmetics Anti-counterfeiting Technology Analysis, Insights and Forecast, 2020-2032
- 8.1. Market Analysis, Insights and Forecast - by Application
- 8.1.1. Online Sales
- 8.1.2. Offline Sales
- 8.2. Market Analysis, Insights and Forecast - by Types
- 8.2.1. Authentication Technology
- 8.2.2. Track and Trace Technology
- 8.1. Market Analysis, Insights and Forecast - by Application
- 9. Middle East & Africa Cosmetics Anti-counterfeiting Technology Analysis, Insights and Forecast, 2020-2032
- 9.1. Market Analysis, Insights and Forecast - by Application
- 9.1.1. Online Sales
- 9.1.2. Offline Sales
- 9.2. Market Analysis, Insights and Forecast - by Types
- 9.2.1. Authentication Technology
- 9.2.2. Track and Trace Technology
- 9.1. Market Analysis, Insights and Forecast - by Application
- 10. Asia Pacific Cosmetics Anti-counterfeiting Technology Analysis, Insights and Forecast, 2020-2032
- 10.1. Market Analysis, Insights and Forecast - by Application
- 10.1.1. Online Sales
- 10.1.2. Offline Sales
- 10.2. Market Analysis, Insights and Forecast - by Types
- 10.2.1. Authentication Technology
- 10.2.2. Track and Trace Technology
- 10.1. Market Analysis, Insights and Forecast - by Application
- 11. Competitive Analysis
- 11.1. Global Market Share Analysis 2025
- 11.2. Company Profiles
- 11.2.1 Genefied
- 11.2.1.1. Overview
- 11.2.1.2. Products
- 11.2.1.3. SWOT Analysis
- 11.2.1.4. Recent Developments
- 11.2.1.5. Financials (Based on Availability)
- 11.2.2 NanoMatriX International Limited
- 11.2.2.1. Overview
- 11.2.2.2. Products
- 11.2.2.3. SWOT Analysis
- 11.2.2.4. Recent Developments
- 11.2.2.5. Financials (Based on Availability)
- 11.2.3 Cypheme
- 11.2.3.1. Overview
- 11.2.3.2. Products
- 11.2.3.3. SWOT Analysis
- 11.2.3.4. Recent Developments
- 11.2.3.5. Financials (Based on Availability)
- 11.2.4 AlpVision
- 11.2.4.1. Overview
- 11.2.4.2. Products
- 11.2.4.3. SWOT Analysis
- 11.2.4.4. Recent Developments
- 11.2.4.5. Financials (Based on Availability)
- 11.2.5 Authentix
- 11.2.5.1. Overview
- 11.2.5.2. Products
- 11.2.5.3. SWOT Analysis
- 11.2.5.4. Recent Developments
- 11.2.5.5. Financials (Based on Availability)
- 11.2.6 Zebra Technologies Corp.
- 11.2.6.1. Overview
- 11.2.6.2. Products
- 11.2.6.3. SWOT Analysis
- 11.2.6.4. Recent Developments
- 11.2.6.5. Financials (Based on Availability)
- 11.2.7 U-NICA Solutions AG
- 11.2.7.1. Overview
- 11.2.7.2. Products
- 11.2.7.3. SWOT Analysis
- 11.2.7.4. Recent Developments
- 11.2.7.5. Financials (Based on Availability)
- 11.2.8 Alien Technology Corp.
- 11.2.8.1. Overview
- 11.2.8.2. Products
- 11.2.8.3. SWOT Analysis
- 11.2.8.4. Recent Developments
- 11.2.8.5. Financials (Based on Availability)
- 11.2.9 Hague
- 11.2.9.1. Overview
- 11.2.9.2. Products
- 11.2.9.3. SWOT Analysis
- 11.2.9.4. Recent Developments
- 11.2.9.5. Financials (Based on Availability)
- 11.2.10 Prooftag
- 11.2.10.1. Overview
- 11.2.10.2. Products
- 11.2.10.3. SWOT Analysis
- 11.2.10.4. Recent Developments
- 11.2.10.5. Financials (Based on Availability)
- 11.2.11 OpSec
- 11.2.11.1. Overview
- 11.2.11.2. Products
- 11.2.11.3. SWOT Analysis
- 11.2.11.4. Recent Developments
- 11.2.11.5. Financials (Based on Availability)
- 11.2.1 Genefied
List of Figures
- Figure 1: Global Cosmetics Anti-counterfeiting Technology Revenue Breakdown (undefined, %) by Region 2025 & 2033
- Figure 2: North America Cosmetics Anti-counterfeiting Technology Revenue (undefined), by Application 2025 & 2033
- Figure 3: North America Cosmetics Anti-counterfeiting Technology Revenue Share (%), by Application 2025 & 2033
- Figure 4: North America Cosmetics Anti-counterfeiting Technology Revenue (undefined), by Types 2025 & 2033
- Figure 5: North America Cosmetics Anti-counterfeiting Technology Revenue Share (%), by Types 2025 & 2033
- Figure 6: North America Cosmetics Anti-counterfeiting Technology Revenue (undefined), by Country 2025 & 2033
- Figure 7: North America Cosmetics Anti-counterfeiting Technology Revenue Share (%), by Country 2025 & 2033
- Figure 8: South America Cosmetics Anti-counterfeiting Technology Revenue (undefined), by Application 2025 & 2033
- Figure 9: South America Cosmetics Anti-counterfeiting Technology Revenue Share (%), by Application 2025 & 2033
- Figure 10: South America Cosmetics Anti-counterfeiting Technology Revenue (undefined), by Types 2025 & 2033
- Figure 11: South America Cosmetics Anti-counterfeiting Technology Revenue Share (%), by Types 2025 & 2033
- Figure 12: South America Cosmetics Anti-counterfeiting Technology Revenue (undefined), by Country 2025 & 2033
- Figure 13: South America Cosmetics Anti-counterfeiting Technology Revenue Share (%), by Country 2025 & 2033
- Figure 14: Europe Cosmetics Anti-counterfeiting Technology Revenue (undefined), by Application 2025 & 2033
- Figure 15: Europe Cosmetics Anti-counterfeiting Technology Revenue Share (%), by Application 2025 & 2033
- Figure 16: Europe Cosmetics Anti-counterfeiting Technology Revenue (undefined), by Types 2025 & 2033
- Figure 17: Europe Cosmetics Anti-counterfeiting Technology Revenue Share (%), by Types 2025 & 2033
- Figure 18: Europe Cosmetics Anti-counterfeiting Technology Revenue (undefined), by Country 2025 & 2033
- Figure 19: Europe Cosmetics Anti-counterfeiting Technology Revenue Share (%), by Country 2025 & 2033
- Figure 20: Middle East & Africa Cosmetics Anti-counterfeiting Technology Revenue (undefined), by Application 2025 & 2033
- Figure 21: Middle East & Africa Cosmetics Anti-counterfeiting Technology Revenue Share (%), by Application 2025 & 2033
- Figure 22: Middle East & Africa Cosmetics Anti-counterfeiting Technology Revenue (undefined), by Types 2025 & 2033
- Figure 23: Middle East & Africa Cosmetics Anti-counterfeiting Technology Revenue Share (%), by Types 2025 & 2033
- Figure 24: Middle East & Africa Cosmetics Anti-counterfeiting Technology Revenue (undefined), by Country 2025 & 2033
- Figure 25: Middle East & Africa Cosmetics Anti-counterfeiting Technology Revenue Share (%), by Country 2025 & 2033
- Figure 26: Asia Pacific Cosmetics Anti-counterfeiting Technology Revenue (undefined), by Application 2025 & 2033
- Figure 27: Asia Pacific Cosmetics Anti-counterfeiting Technology Revenue Share (%), by Application 2025 & 2033
- Figure 28: Asia Pacific Cosmetics Anti-counterfeiting Technology Revenue (undefined), by Types 2025 & 2033
- Figure 29: Asia Pacific Cosmetics Anti-counterfeiting Technology Revenue Share (%), by Types 2025 & 2033
- Figure 30: Asia Pacific Cosmetics Anti-counterfeiting Technology Revenue (undefined), by Country 2025 & 2033
- Figure 31: Asia Pacific Cosmetics Anti-counterfeiting Technology Revenue Share (%), by Country 2025 & 2033
List of Tables
- Table 1: Global Cosmetics Anti-counterfeiting Technology Revenue undefined Forecast, by Application 2020 & 2033
- Table 2: Global Cosmetics Anti-counterfeiting Technology Revenue undefined Forecast, by Types 2020 & 2033
- Table 3: Global Cosmetics Anti-counterfeiting Technology Revenue undefined Forecast, by Region 2020 & 2033
- Table 4: Global Cosmetics Anti-counterfeiting Technology Revenue undefined Forecast, by Application 2020 & 2033
- Table 5: Global Cosmetics Anti-counterfeiting Technology Revenue undefined Forecast, by Types 2020 & 2033
- Table 6: Global Cosmetics Anti-counterfeiting Technology Revenue undefined Forecast, by Country 2020 & 2033
- Table 7: United States Cosmetics Anti-counterfeiting Technology Revenue (undefined) Forecast, by Application 2020 & 2033
- Table 8: Canada Cosmetics Anti-counterfeiting Technology Revenue (undefined) Forecast, by Application 2020 & 2033
- Table 9: Mexico Cosmetics Anti-counterfeiting Technology Revenue (undefined) Forecast, by Application 2020 & 2033
- Table 10: Global Cosmetics Anti-counterfeiting Technology Revenue undefined Forecast, by Application 2020 & 2033
- Table 11: Global Cosmetics Anti-counterfeiting Technology Revenue undefined Forecast, by Types 2020 & 2033
- Table 12: Global Cosmetics Anti-counterfeiting Technology Revenue undefined Forecast, by Country 2020 & 2033
- Table 13: Brazil Cosmetics Anti-counterfeiting Technology Revenue (undefined) Forecast, by Application 2020 & 2033
- Table 14: Argentina Cosmetics Anti-counterfeiting Technology Revenue (undefined) Forecast, by Application 2020 & 2033
- Table 15: Rest of South America Cosmetics Anti-counterfeiting Technology Revenue (undefined) Forecast, by Application 2020 & 2033
- Table 16: Global Cosmetics Anti-counterfeiting Technology Revenue undefined Forecast, by Application 2020 & 2033
- Table 17: Global Cosmetics Anti-counterfeiting Technology Revenue undefined Forecast, by Types 2020 & 2033
- Table 18: Global Cosmetics Anti-counterfeiting Technology Revenue undefined Forecast, by Country 2020 & 2033
- Table 19: United Kingdom Cosmetics Anti-counterfeiting Technology Revenue (undefined) Forecast, by Application 2020 & 2033
- Table 20: Germany Cosmetics Anti-counterfeiting Technology Revenue (undefined) Forecast, by Application 2020 & 2033
- Table 21: France Cosmetics Anti-counterfeiting Technology Revenue (undefined) Forecast, by Application 2020 & 2033
- Table 22: Italy Cosmetics Anti-counterfeiting Technology Revenue (undefined) Forecast, by Application 2020 & 2033
- Table 23: Spain Cosmetics Anti-counterfeiting Technology Revenue (undefined) Forecast, by Application 2020 & 2033
- Table 24: Russia Cosmetics Anti-counterfeiting Technology Revenue (undefined) Forecast, by Application 2020 & 2033
- Table 25: Benelux Cosmetics Anti-counterfeiting Technology Revenue (undefined) Forecast, by Application 2020 & 2033
- Table 26: Nordics Cosmetics Anti-counterfeiting Technology Revenue (undefined) Forecast, by Application 2020 & 2033
- Table 27: Rest of Europe Cosmetics Anti-counterfeiting Technology Revenue (undefined) Forecast, by Application 2020 & 2033
- Table 28: Global Cosmetics Anti-counterfeiting Technology Revenue undefined Forecast, by Application 2020 & 2033
- Table 29: Global Cosmetics Anti-counterfeiting Technology Revenue undefined Forecast, by Types 2020 & 2033
- Table 30: Global Cosmetics Anti-counterfeiting Technology Revenue undefined Forecast, by Country 2020 & 2033
- Table 31: Turkey Cosmetics Anti-counterfeiting Technology Revenue (undefined) Forecast, by Application 2020 & 2033
- Table 32: Israel Cosmetics Anti-counterfeiting Technology Revenue (undefined) Forecast, by Application 2020 & 2033
- Table 33: GCC Cosmetics Anti-counterfeiting Technology Revenue (undefined) Forecast, by Application 2020 & 2033
- Table 34: North Africa Cosmetics Anti-counterfeiting Technology Revenue (undefined) Forecast, by Application 2020 & 2033
- Table 35: South Africa Cosmetics Anti-counterfeiting Technology Revenue (undefined) Forecast, by Application 2020 & 2033
- Table 36: Rest of Middle East & Africa Cosmetics Anti-counterfeiting Technology Revenue (undefined) Forecast, by Application 2020 & 2033
- Table 37: Global Cosmetics Anti-counterfeiting Technology Revenue undefined Forecast, by Application 2020 & 2033
- Table 38: Global Cosmetics Anti-counterfeiting Technology Revenue undefined Forecast, by Types 2020 & 2033
- Table 39: Global Cosmetics Anti-counterfeiting Technology Revenue undefined Forecast, by Country 2020 & 2033
- Table 40: China Cosmetics Anti-counterfeiting Technology Revenue (undefined) Forecast, by Application 2020 & 2033
- Table 41: India Cosmetics Anti-counterfeiting Technology Revenue (undefined) Forecast, by Application 2020 & 2033
- Table 42: Japan Cosmetics Anti-counterfeiting Technology Revenue (undefined) Forecast, by Application 2020 & 2033
- Table 43: South Korea Cosmetics Anti-counterfeiting Technology Revenue (undefined) Forecast, by Application 2020 & 2033
- Table 44: ASEAN Cosmetics Anti-counterfeiting Technology Revenue (undefined) Forecast, by Application 2020 & 2033
- Table 45: Oceania Cosmetics Anti-counterfeiting Technology Revenue (undefined) Forecast, by Application 2020 & 2033
- Table 46: Rest of Asia Pacific Cosmetics Anti-counterfeiting Technology Revenue (undefined) Forecast, by Application 2020 & 2033
Frequently Asked Questions
1. What is the projected Compound Annual Growth Rate (CAGR) of the Cosmetics Anti-counterfeiting Technology?
The projected CAGR is approximately 10.8%.
2. Which companies are prominent players in the Cosmetics Anti-counterfeiting Technology?
Key companies in the market include Genefied, NanoMatriX International Limited, Cypheme, AlpVision, Authentix, Zebra Technologies Corp., U-NICA Solutions AG, Alien Technology Corp., Hague, Prooftag, OpSec.
3. What are the main segments of the Cosmetics Anti-counterfeiting Technology?
The market segments include Application, Types.
4. Can you provide details about the market size?
The market size is estimated to be USD XXX N/A as of 2022.
5. What are some drivers contributing to market growth?
N/A
6. What are the notable trends driving market growth?
N/A
7. Are there any restraints impacting market growth?
N/A
8. Can you provide examples of recent developments in the market?
N/A
9. What pricing options are available for accessing the report?
Pricing options include single-user, multi-user, and enterprise licenses priced at USD 4900.00, USD 7350.00, and USD 9800.00 respectively.
10. Is the market size provided in terms of value or volume?
The market size is provided in terms of value, measured in N/A.
11. Are there any specific market keywords associated with the report?
Yes, the market keyword associated with the report is "Cosmetics Anti-counterfeiting Technology," which aids in identifying and referencing the specific market segment covered.
12. How do I determine which pricing option suits my needs best?
The pricing options vary based on user requirements and access needs. Individual users may opt for single-user licenses, while businesses requiring broader access may choose multi-user or enterprise licenses for cost-effective access to the report.
13. Are there any additional resources or data provided in the Cosmetics Anti-counterfeiting Technology report?
While the report offers comprehensive insights, it's advisable to review the specific contents or supplementary materials provided to ascertain if additional resources or data are available.
14. How can I stay updated on further developments or reports in the Cosmetics Anti-counterfeiting Technology?
To stay informed about further developments, trends, and reports in the Cosmetics Anti-counterfeiting Technology, consider subscribing to industry newsletters, following relevant companies and organizations, or regularly checking reputable industry news sources and publications.
Methodology
Step 1 - Identification of Relevant Samples Size from Population Database


Step 2 - Approaches for Defining Global Market Size (Value, Volume* & Price*)

Note*: In applicable scenarios
Step 3 - Data Sources
Primary Research
- Web Analytics
- Survey Reports
- Research Institute
- Latest Research Reports
- Opinion Leaders
Secondary Research
- Annual Reports
- White Paper
- Latest Press Release
- Industry Association
- Paid Database
- Investor Presentations

Step 4 - Data Triangulation
Involves using different sources of information in order to increase the validity of a study
These sources are likely to be stakeholders in a program - participants, other researchers, program staff, other community members, and so on.
Then we put all data in single framework & apply various statistical tools to find out the dynamic on the market.
During the analysis stage, feedback from the stakeholder groups would be compared to determine areas of agreement as well as areas of divergence