

Key Insights
The global dairy packaging solutions market is poised for significant expansion, projected to reach an estimated USD 165 billion by 2025 and exhibit a robust Compound Annual Growth Rate (CAGR) of 6.2% during the forecast period of 2025-2033. This growth is fueled by a burgeoning global demand for dairy products, driven by increasing consumer awareness of their nutritional benefits, particularly protein and calcium, coupled with evolving dietary preferences towards healthier options. The convenience factor associated with ready-to-consume dairy beverages and yogurts further bolsters this demand. Key market drivers include the rising disposable incomes in emerging economies, leading to increased per capita consumption of dairy, and the growing preference for sustainable and eco-friendly packaging alternatives, prompting manufacturers to invest in innovative materials and designs. The "shop" application segment is anticipated to dominate, reflecting the high volume of dairy products sold through retail channels, while the "factory" segment will cater to bulk processing and distribution needs.
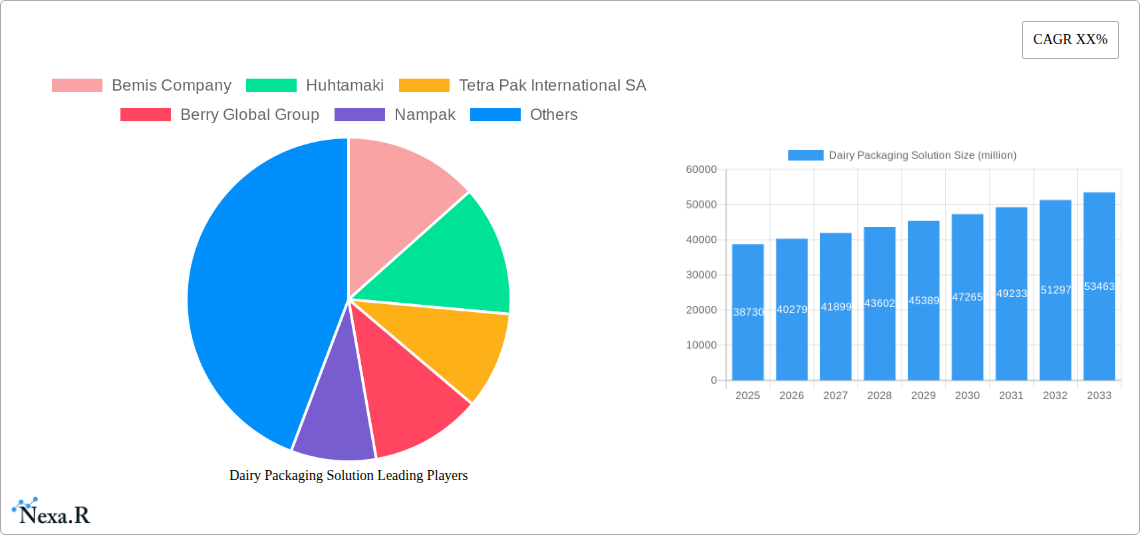
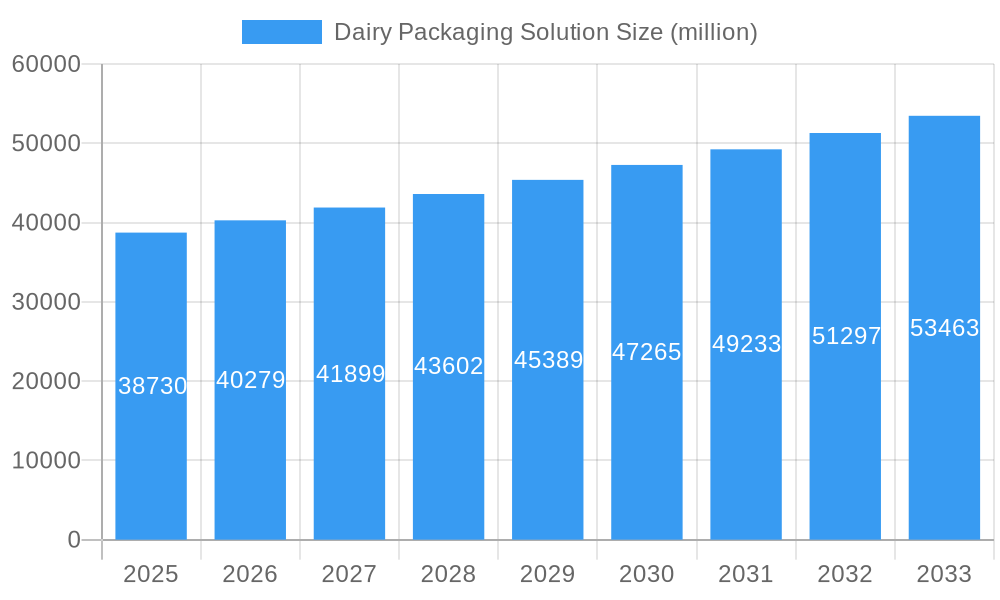
Dairy Packaging Solution Market Size (In Billion)
Further analysis of the dairy packaging solutions market reveals a dynamic landscape shaped by technological advancements and evolving consumer expectations. The market is segmented by material types, with glass material packaging gaining traction due to its perceived premium appeal, recyclability, and inertness, preserving the taste and quality of dairy products. However, plastic material packaging continues to hold a significant share due to its cost-effectiveness, lightweight properties, and versatility in design, particularly for single-serve and on-the-go consumption. Leading companies such as Amcor Limited, Berry Global Group, and Tetra Pak International SA are at the forefront of innovation, developing advanced barrier properties, extended shelf-life solutions, and tamper-evident features. The market's trajectory is influenced by stringent regulatory frameworks promoting food safety and sustainability, encouraging the adoption of recyclable, biodegradable, and compostable packaging materials. Despite these positive trends, restraints such as fluctuating raw material prices and the initial investment costs for advanced packaging technologies could present challenges.
Dairy Packaging Solution Company Market Share
Dairy Packaging Solution Market Report: Comprehensive Analysis and Forecast
This in-depth report provides a critical examination of the global Dairy Packaging Solution market, analyzing its structure, dynamics, growth trajectory, and future outlook. Covering the historical period of 2019–2024, the base year of 2025, and an extensive forecast period extending to 2033, this research offers actionable insights for stakeholders across the dairy value chain. We delve into market segmentation by Application (Shop, Factory, Others) and Type (Glass Material, Plastic Material), alongside an exploration of key industry developments. The report highlights major players such as Bemis Company, Huhtamaki, Tetra Pak International SA, Berry Global Group, Nampak, Ball Corporation, Sealed Air Corporation, WestRock Company, Mondi Group, and Amcor Limited, providing a comprehensive understanding of the competitive landscape.
Dairy Packaging Solution Market Dynamics & Structure
The global Dairy Packaging Solution market exhibits a moderately concentrated structure, with leading players like Tetra Pak International SA and Amcor Limited holding significant market shares. Technological innovation is a primary driver, with advancements in barrier properties, sustainable materials, and smart packaging solutions continuously shaping the industry. Regulatory frameworks, particularly concerning food safety, environmental impact, and recyclability, play a crucial role in dictating product development and market access. Competitive product substitutes, such as alternative protein beverages and their innovative packaging, pose a growing challenge. End-user demographics, including the rising demand for convenient, portion-controlled, and health-conscious dairy products, are influencing packaging design and functionality. Mergers and Acquisitions (M&A) trends are evident, with companies consolidating to achieve economies of scale, expand product portfolios, and gain market access. For instance, the historical period saw several strategic acquisitions aimed at bolstering capabilities in sustainable packaging technologies.
- Market Concentration: Top 5 players account for approximately 55% of the global market share.
- Technological Innovation: Focus on lightweighting, enhanced shelf-life, and tamper-evident features.
- Regulatory Frameworks: Stringent regulations on single-use plastics and increasing emphasis on recycled content.
- Competitive Substitutes: Growth in plant-based alternatives and their associated packaging innovations.
- End-User Demographics: Growing demand for single-serve, on-the-go, and premium dairy packaging.
- M&A Trends: Acquisitions focused on sustainable packaging solutions and expanded geographical reach, with an estimated xx M&A deals in the last two years.
Dairy Packaging Solution Growth Trends & Insights
The Dairy Packaging Solution market is poised for robust growth, projected to reach USD XX million units by 2033, exhibiting a Compound Annual Growth Rate (CAGR) of approximately XX% during the forecast period (2025–2033). This expansion is driven by escalating global demand for dairy products, fueled by population growth and rising disposable incomes, particularly in emerging economies. The adoption of advanced packaging technologies, such as those offering extended shelf life and improved product preservation, is a significant trend. Technological disruptions, including the development of biodegradable and compostable packaging materials, are gaining traction as consumer environmental consciousness increases. Consumer behavior shifts, characterized by a preference for convenient, safe, and aesthetically pleasing packaging, further propel market expansion. The market penetration of innovative packaging formats, like pouches and aseptic cartons, is expected to accelerate. The base year of 2025 marks a pivotal point, with an estimated market size of USD XX million units. The historical period (2019–2024) witnessed consistent growth, averaging XX% CAGR, driven by increasing urbanization and the convenience factor associated with packaged dairy.
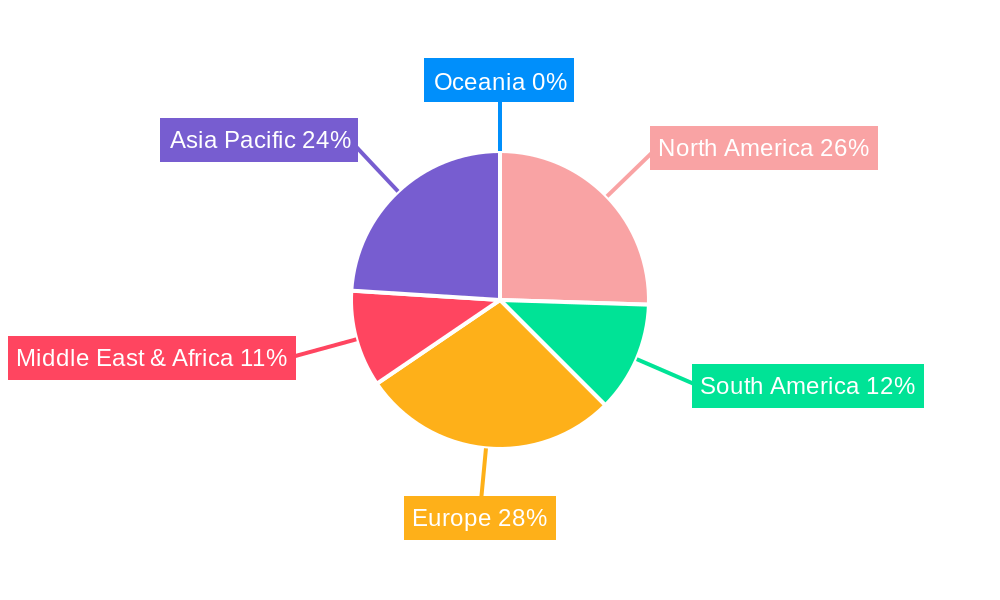
Dominant Regions, Countries, or Segments in Dairy Packaging Solution
North America and Europe currently dominate the global Dairy Packaging Solution market, driven by established dairy industries, high consumer spending, and stringent quality and safety standards. The Plastic Material segment, encompassing a wide array of solutions like PET bottles, HDPE containers, and flexible pouches, is the most significant contributor to market growth, accounting for an estimated XX% of the total market value. The Shop application segment, which includes retail packaging for consumer-ready dairy products, is also a major growth driver. Key drivers for dominance include robust economic policies supporting the food and beverage sector, advanced infrastructure for packaging manufacturing and distribution, and high consumer awareness regarding product quality and shelf life. The growing demand for convenient and portable dairy options, such as yogurt cups, cheese slices, and single-serve milk cartons, further solidifies the dominance of Plastic Material and the Shop application. Asia Pacific, however, is emerging as a rapidly growing region due to its large and expanding population, increasing urbanization, and a burgeoning middle class with a growing appetite for dairy products.
- Dominant Segment (Type): Plastic Material (approx. XX% market share)
- Key Drivers: Versatility, cost-effectiveness, and a wide range of functional properties.
- Sub-segments: PET bottles for milk and yogurt, HDPE containers for butter and cheese, flexible films for cheese and yogurt multipacks.
- Dominant Segment (Application): Shop (Retail Packaging)
- Key Drivers: Consumer convenience, product visibility, and brand promotion at the point of sale.
- Examples: Single-serve yogurt cups, multi-pack cheese wraps, ready-to-drink milk cartons.
- Leading Region: North America and Europe
- Dominance Factors: Mature dairy markets, high per capita consumption, strong regulatory oversight, and advanced packaging technology adoption.
- Emerging Region: Asia Pacific
- Growth Potential: Rapidly expanding population, increasing disposable incomes, and growing demand for convenient and safe dairy products.
Dairy Packaging Solution Product Landscape
The dairy packaging landscape is characterized by continuous product innovation focused on enhancing functionality, sustainability, and consumer appeal. This includes the development of advanced barrier films that significantly extend the shelf life of milk, yogurt, and cheese, reducing food waste. Lightweighting initiatives are prevalent, leading to reduced material usage and lower transportation costs. Smart packaging solutions, such as temperature indicators and QR codes for traceability, are emerging to enhance consumer trust and product safety. For Plastic Material, innovations include the increased use of recycled PET (rPET) and the development of bio-based plastics. Glass Material continues to see niche applications for premium dairy products, with advancements in tamper-evident closures and lightweight glass designs. The primary applications range from individual portioned items to bulk factory packaging, each demanding specific material properties and design considerations.
Key Drivers, Barriers & Challenges in Dairy Packaging Solution
Key Drivers:
- Growing Global Dairy Consumption: Increasing demand for dairy products worldwide fuels the need for effective packaging solutions.
- Consumer Demand for Convenience: Single-serve portions, resealable packaging, and easy-to-open formats are highly sought after.
- Technological Advancements: Innovations in material science, barrier technologies, and sustainable packaging are driving adoption.
- Focus on Food Safety and Shelf Life: Packaging plays a crucial role in preserving product integrity and extending shelf life, reducing spoilage.
- Sustainability Initiatives: Growing consumer and regulatory pressure for eco-friendly packaging solutions.
Barriers & Challenges:
- Fluctuating Raw Material Prices: Volatility in the cost of plastics, glass, and other packaging materials impacts profitability.
- Regulatory Hurdles for New Materials: Approval processes for novel sustainable or advanced packaging materials can be lengthy and complex.
- Recycling Infrastructure Limitations: Inadequate recycling facilities in certain regions can hinder the adoption of recyclable packaging.
- Competition from Alternative Beverages: The rise of plant-based alternatives poses a competitive threat to traditional dairy products and their packaging.
- Consumer Perception of Plastic: Negative consumer sentiment towards plastic packaging, despite ongoing efforts to improve its sustainability.
Emerging Opportunities in Dairy Packaging Solution
Emerging opportunities lie in the development and adoption of truly circular economy packaging solutions, including advanced recycling technologies and the use of high-barrier compostable materials. The integration of digital technologies, such as IoT-enabled packaging for real-time product monitoring and traceability, presents a significant growth avenue. Untapped markets in developing economies, with their rapidly growing middle class and increasing consumption of packaged dairy, offer substantial potential. Furthermore, the demand for personalized and customizable packaging solutions for niche dairy products and premium offerings is a growing trend. Innovations in aseptic packaging for extended shelf life without refrigeration also present promising opportunities, particularly in regions with limited cold chain infrastructure.
Growth Accelerators in the Dairy Packaging Solution Industry
The Dairy Packaging Solution industry is witnessing accelerated growth driven by a confluence of factors. Technological breakthroughs in biodegradable and compostable materials, alongside advancements in mechanical and chemical recycling, are rapidly addressing sustainability concerns and opening new market avenues. Strategic partnerships between packaging manufacturers and dairy producers are fostering innovation and ensuring the alignment of packaging solutions with evolving product needs and consumer preferences. Market expansion strategies, particularly into high-growth emerging economies, are significant growth accelerators, capitalizing on increasing dairy consumption. The development of smart packaging, offering enhanced traceability, freshness monitoring, and consumer engagement features, is also a key catalyst for sustained growth.
Key Players Shaping the Dairy Packaging Solution Market
- Amcor Limited
- Tetra Pak International SA
- Berry Global Group
- Huhtamaki
- Bemis Company
- Sealed Air Corporation
- WestRock Company
- Mondi Group
- Ball Corporation
- Nampak
Notable Milestones in Dairy Packaging Solution Sector
- 2019: Increased investment in R&D for biodegradable and compostable dairy packaging materials.
- 2020: Launch of innovative lightweight PET bottles for milk, reducing material usage and carbon footprint.
- 2021: Expansion of aseptic packaging capabilities to meet growing demand for shelf-stable dairy products.
- 2022: Significant M&A activity focused on acquiring companies with expertise in sustainable packaging solutions.
- 2023: Introduction of smart packaging features, including temperature-sensing labels for enhanced product quality control.
- 2024: Growing adoption of recycled content (e.g., rPET) in dairy packaging, driven by regulatory mandates and consumer demand.
In-Depth Dairy Packaging Solution Market Outlook
The future of the Dairy Packaging Solution market is exceptionally promising, driven by sustained global demand for dairy products and a strong push towards sustainability. Growth accelerators, including advancements in biodegradable materials, innovative recycling technologies, and the widespread adoption of smart packaging, will continue to shape the market. Strategic partnerships between industry leaders and emerging innovators will unlock new opportunities, particularly in regions with untapped potential. The increasing consumer preference for convenient, safe, and eco-friendly packaging ensures a dynamic and evolving market landscape. Stakeholders can anticipate significant growth and opportunities by focusing on innovation, sustainability, and expanding into high-demand geographical markets.
Dairy Packaging Solution Segmentation
-
1. Application
- 1.1. Shop
- 1.2. Factory
- 1.3. Others
-
2. Types
- 2.1. Glass Material
- 2.2. Plastic Material
Dairy Packaging Solution Segmentation By Geography
-
1. North America
- 1.1. United States
- 1.2. Canada
- 1.3. Mexico
-
2. South America
- 2.1. Brazil
- 2.2. Argentina
- 2.3. Rest of South America
-
3. Europe
- 3.1. United Kingdom
- 3.2. Germany
- 3.3. France
- 3.4. Italy
- 3.5. Spain
- 3.6. Russia
- 3.7. Benelux
- 3.8. Nordics
- 3.9. Rest of Europe
-
4. Middle East & Africa
- 4.1. Turkey
- 4.2. Israel
- 4.3. GCC
- 4.4. North Africa
- 4.5. South Africa
- 4.6. Rest of Middle East & Africa
-
5. Asia Pacific
- 5.1. China
- 5.2. India
- 5.3. Japan
- 5.4. South Korea
- 5.5. ASEAN
- 5.6. Oceania
- 5.7. Rest of Asia Pacific
Dairy Packaging Solution Regional Market Share
Geographic Coverage of Dairy Packaging Solution
Dairy Packaging Solution REPORT HIGHLIGHTS
| Aspects | Details |
|---|---|
| Study Period | 2020-2034 |
| Base Year | 2025 |
| Estimated Year | 2026 |
| Forecast Period | 2026-2034 |
| Historical Period | 2020-2025 |
| Growth Rate | CAGR of 4.3% from 2020-2034 |
| Segmentation |
|
Table of Contents
- 1. Introduction
- 1.1. Research Scope
- 1.2. Market Segmentation
- 1.3. Research Methodology
- 1.4. Definitions and Assumptions
- 2. Executive Summary
- 2.1. Introduction
- 3. Market Dynamics
- 3.1. Introduction
- 3.2. Market Drivers
- 3.3. Market Restrains
- 3.4. Market Trends
- 4. Market Factor Analysis
- 4.1. Porters Five Forces
- 4.2. Supply/Value Chain
- 4.3. PESTEL analysis
- 4.4. Market Entropy
- 4.5. Patent/Trademark Analysis
- 5. Global Dairy Packaging Solution Analysis, Insights and Forecast, 2020-2032
- 5.1. Market Analysis, Insights and Forecast - by Application
- 5.1.1. Shop
- 5.1.2. Factory
- 5.1.3. Others
- 5.2. Market Analysis, Insights and Forecast - by Types
- 5.2.1. Glass Material
- 5.2.2. Plastic Material
- 5.3. Market Analysis, Insights and Forecast - by Region
- 5.3.1. North America
- 5.3.2. South America
- 5.3.3. Europe
- 5.3.4. Middle East & Africa
- 5.3.5. Asia Pacific
- 5.1. Market Analysis, Insights and Forecast - by Application
- 6. North America Dairy Packaging Solution Analysis, Insights and Forecast, 2020-2032
- 6.1. Market Analysis, Insights and Forecast - by Application
- 6.1.1. Shop
- 6.1.2. Factory
- 6.1.3. Others
- 6.2. Market Analysis, Insights and Forecast - by Types
- 6.2.1. Glass Material
- 6.2.2. Plastic Material
- 6.1. Market Analysis, Insights and Forecast - by Application
- 7. South America Dairy Packaging Solution Analysis, Insights and Forecast, 2020-2032
- 7.1. Market Analysis, Insights and Forecast - by Application
- 7.1.1. Shop
- 7.1.2. Factory
- 7.1.3. Others
- 7.2. Market Analysis, Insights and Forecast - by Types
- 7.2.1. Glass Material
- 7.2.2. Plastic Material
- 7.1. Market Analysis, Insights and Forecast - by Application
- 8. Europe Dairy Packaging Solution Analysis, Insights and Forecast, 2020-2032
- 8.1. Market Analysis, Insights and Forecast - by Application
- 8.1.1. Shop
- 8.1.2. Factory
- 8.1.3. Others
- 8.2. Market Analysis, Insights and Forecast - by Types
- 8.2.1. Glass Material
- 8.2.2. Plastic Material
- 8.1. Market Analysis, Insights and Forecast - by Application
- 9. Middle East & Africa Dairy Packaging Solution Analysis, Insights and Forecast, 2020-2032
- 9.1. Market Analysis, Insights and Forecast - by Application
- 9.1.1. Shop
- 9.1.2. Factory
- 9.1.3. Others
- 9.2. Market Analysis, Insights and Forecast - by Types
- 9.2.1. Glass Material
- 9.2.2. Plastic Material
- 9.1. Market Analysis, Insights and Forecast - by Application
- 10. Asia Pacific Dairy Packaging Solution Analysis, Insights and Forecast, 2020-2032
- 10.1. Market Analysis, Insights and Forecast - by Application
- 10.1.1. Shop
- 10.1.2. Factory
- 10.1.3. Others
- 10.2. Market Analysis, Insights and Forecast - by Types
- 10.2.1. Glass Material
- 10.2.2. Plastic Material
- 10.1. Market Analysis, Insights and Forecast - by Application
- 11. Competitive Analysis
- 11.1. Global Market Share Analysis 2025
- 11.2. Company Profiles
- 11.2.1 Bemis Company
- 11.2.1.1. Overview
- 11.2.1.2. Products
- 11.2.1.3. SWOT Analysis
- 11.2.1.4. Recent Developments
- 11.2.1.5. Financials (Based on Availability)
- 11.2.2 Huhtamaki
- 11.2.2.1. Overview
- 11.2.2.2. Products
- 11.2.2.3. SWOT Analysis
- 11.2.2.4. Recent Developments
- 11.2.2.5. Financials (Based on Availability)
- 11.2.3 Tetra Pak International SA
- 11.2.3.1. Overview
- 11.2.3.2. Products
- 11.2.3.3. SWOT Analysis
- 11.2.3.4. Recent Developments
- 11.2.3.5. Financials (Based on Availability)
- 11.2.4 Berry Global Group
- 11.2.4.1. Overview
- 11.2.4.2. Products
- 11.2.4.3. SWOT Analysis
- 11.2.4.4. Recent Developments
- 11.2.4.5. Financials (Based on Availability)
- 11.2.5 Nampak
- 11.2.5.1. Overview
- 11.2.5.2. Products
- 11.2.5.3. SWOT Analysis
- 11.2.5.4. Recent Developments
- 11.2.5.5. Financials (Based on Availability)
- 11.2.6 Ball Corporation
- 11.2.6.1. Overview
- 11.2.6.2. Products
- 11.2.6.3. SWOT Analysis
- 11.2.6.4. Recent Developments
- 11.2.6.5. Financials (Based on Availability)
- 11.2.7 Sealed Air Corporation
- 11.2.7.1. Overview
- 11.2.7.2. Products
- 11.2.7.3. SWOT Analysis
- 11.2.7.4. Recent Developments
- 11.2.7.5. Financials (Based on Availability)
- 11.2.8 WestRock Company
- 11.2.8.1. Overview
- 11.2.8.2. Products
- 11.2.8.3. SWOT Analysis
- 11.2.8.4. Recent Developments
- 11.2.8.5. Financials (Based on Availability)
- 11.2.9 Mondi Group
- 11.2.9.1. Overview
- 11.2.9.2. Products
- 11.2.9.3. SWOT Analysis
- 11.2.9.4. Recent Developments
- 11.2.9.5. Financials (Based on Availability)
- 11.2.10 Amcor Limited
- 11.2.10.1. Overview
- 11.2.10.2. Products
- 11.2.10.3. SWOT Analysis
- 11.2.10.4. Recent Developments
- 11.2.10.5. Financials (Based on Availability)
- 11.2.1 Bemis Company
List of Figures
- Figure 1: Global Dairy Packaging Solution Revenue Breakdown (undefined, %) by Region 2025 & 2033
- Figure 2: Global Dairy Packaging Solution Volume Breakdown (K, %) by Region 2025 & 2033
- Figure 3: North America Dairy Packaging Solution Revenue (undefined), by Application 2025 & 2033
- Figure 4: North America Dairy Packaging Solution Volume (K), by Application 2025 & 2033
- Figure 5: North America Dairy Packaging Solution Revenue Share (%), by Application 2025 & 2033
- Figure 6: North America Dairy Packaging Solution Volume Share (%), by Application 2025 & 2033
- Figure 7: North America Dairy Packaging Solution Revenue (undefined), by Types 2025 & 2033
- Figure 8: North America Dairy Packaging Solution Volume (K), by Types 2025 & 2033
- Figure 9: North America Dairy Packaging Solution Revenue Share (%), by Types 2025 & 2033
- Figure 10: North America Dairy Packaging Solution Volume Share (%), by Types 2025 & 2033
- Figure 11: North America Dairy Packaging Solution Revenue (undefined), by Country 2025 & 2033
- Figure 12: North America Dairy Packaging Solution Volume (K), by Country 2025 & 2033
- Figure 13: North America Dairy Packaging Solution Revenue Share (%), by Country 2025 & 2033
- Figure 14: North America Dairy Packaging Solution Volume Share (%), by Country 2025 & 2033
- Figure 15: South America Dairy Packaging Solution Revenue (undefined), by Application 2025 & 2033
- Figure 16: South America Dairy Packaging Solution Volume (K), by Application 2025 & 2033
- Figure 17: South America Dairy Packaging Solution Revenue Share (%), by Application 2025 & 2033
- Figure 18: South America Dairy Packaging Solution Volume Share (%), by Application 2025 & 2033
- Figure 19: South America Dairy Packaging Solution Revenue (undefined), by Types 2025 & 2033
- Figure 20: South America Dairy Packaging Solution Volume (K), by Types 2025 & 2033
- Figure 21: South America Dairy Packaging Solution Revenue Share (%), by Types 2025 & 2033
- Figure 22: South America Dairy Packaging Solution Volume Share (%), by Types 2025 & 2033
- Figure 23: South America Dairy Packaging Solution Revenue (undefined), by Country 2025 & 2033
- Figure 24: South America Dairy Packaging Solution Volume (K), by Country 2025 & 2033
- Figure 25: South America Dairy Packaging Solution Revenue Share (%), by Country 2025 & 2033
- Figure 26: South America Dairy Packaging Solution Volume Share (%), by Country 2025 & 2033
- Figure 27: Europe Dairy Packaging Solution Revenue (undefined), by Application 2025 & 2033
- Figure 28: Europe Dairy Packaging Solution Volume (K), by Application 2025 & 2033
- Figure 29: Europe Dairy Packaging Solution Revenue Share (%), by Application 2025 & 2033
- Figure 30: Europe Dairy Packaging Solution Volume Share (%), by Application 2025 & 2033
- Figure 31: Europe Dairy Packaging Solution Revenue (undefined), by Types 2025 & 2033
- Figure 32: Europe Dairy Packaging Solution Volume (K), by Types 2025 & 2033
- Figure 33: Europe Dairy Packaging Solution Revenue Share (%), by Types 2025 & 2033
- Figure 34: Europe Dairy Packaging Solution Volume Share (%), by Types 2025 & 2033
- Figure 35: Europe Dairy Packaging Solution Revenue (undefined), by Country 2025 & 2033
- Figure 36: Europe Dairy Packaging Solution Volume (K), by Country 2025 & 2033
- Figure 37: Europe Dairy Packaging Solution Revenue Share (%), by Country 2025 & 2033
- Figure 38: Europe Dairy Packaging Solution Volume Share (%), by Country 2025 & 2033
- Figure 39: Middle East & Africa Dairy Packaging Solution Revenue (undefined), by Application 2025 & 2033
- Figure 40: Middle East & Africa Dairy Packaging Solution Volume (K), by Application 2025 & 2033
- Figure 41: Middle East & Africa Dairy Packaging Solution Revenue Share (%), by Application 2025 & 2033
- Figure 42: Middle East & Africa Dairy Packaging Solution Volume Share (%), by Application 2025 & 2033
- Figure 43: Middle East & Africa Dairy Packaging Solution Revenue (undefined), by Types 2025 & 2033
- Figure 44: Middle East & Africa Dairy Packaging Solution Volume (K), by Types 2025 & 2033
- Figure 45: Middle East & Africa Dairy Packaging Solution Revenue Share (%), by Types 2025 & 2033
- Figure 46: Middle East & Africa Dairy Packaging Solution Volume Share (%), by Types 2025 & 2033
- Figure 47: Middle East & Africa Dairy Packaging Solution Revenue (undefined), by Country 2025 & 2033
- Figure 48: Middle East & Africa Dairy Packaging Solution Volume (K), by Country 2025 & 2033
- Figure 49: Middle East & Africa Dairy Packaging Solution Revenue Share (%), by Country 2025 & 2033
- Figure 50: Middle East & Africa Dairy Packaging Solution Volume Share (%), by Country 2025 & 2033
- Figure 51: Asia Pacific Dairy Packaging Solution Revenue (undefined), by Application 2025 & 2033
- Figure 52: Asia Pacific Dairy Packaging Solution Volume (K), by Application 2025 & 2033
- Figure 53: Asia Pacific Dairy Packaging Solution Revenue Share (%), by Application 2025 & 2033
- Figure 54: Asia Pacific Dairy Packaging Solution Volume Share (%), by Application 2025 & 2033
- Figure 55: Asia Pacific Dairy Packaging Solution Revenue (undefined), by Types 2025 & 2033
- Figure 56: Asia Pacific Dairy Packaging Solution Volume (K), by Types 2025 & 2033
- Figure 57: Asia Pacific Dairy Packaging Solution Revenue Share (%), by Types 2025 & 2033
- Figure 58: Asia Pacific Dairy Packaging Solution Volume Share (%), by Types 2025 & 2033
- Figure 59: Asia Pacific Dairy Packaging Solution Revenue (undefined), by Country 2025 & 2033
- Figure 60: Asia Pacific Dairy Packaging Solution Volume (K), by Country 2025 & 2033
- Figure 61: Asia Pacific Dairy Packaging Solution Revenue Share (%), by Country 2025 & 2033
- Figure 62: Asia Pacific Dairy Packaging Solution Volume Share (%), by Country 2025 & 2033
List of Tables
- Table 1: Global Dairy Packaging Solution Revenue undefined Forecast, by Application 2020 & 2033
- Table 2: Global Dairy Packaging Solution Volume K Forecast, by Application 2020 & 2033
- Table 3: Global Dairy Packaging Solution Revenue undefined Forecast, by Types 2020 & 2033
- Table 4: Global Dairy Packaging Solution Volume K Forecast, by Types 2020 & 2033
- Table 5: Global Dairy Packaging Solution Revenue undefined Forecast, by Region 2020 & 2033
- Table 6: Global Dairy Packaging Solution Volume K Forecast, by Region 2020 & 2033
- Table 7: Global Dairy Packaging Solution Revenue undefined Forecast, by Application 2020 & 2033
- Table 8: Global Dairy Packaging Solution Volume K Forecast, by Application 2020 & 2033
- Table 9: Global Dairy Packaging Solution Revenue undefined Forecast, by Types 2020 & 2033
- Table 10: Global Dairy Packaging Solution Volume K Forecast, by Types 2020 & 2033
- Table 11: Global Dairy Packaging Solution Revenue undefined Forecast, by Country 2020 & 2033
- Table 12: Global Dairy Packaging Solution Volume K Forecast, by Country 2020 & 2033
- Table 13: United States Dairy Packaging Solution Revenue (undefined) Forecast, by Application 2020 & 2033
- Table 14: United States Dairy Packaging Solution Volume (K) Forecast, by Application 2020 & 2033
- Table 15: Canada Dairy Packaging Solution Revenue (undefined) Forecast, by Application 2020 & 2033
- Table 16: Canada Dairy Packaging Solution Volume (K) Forecast, by Application 2020 & 2033
- Table 17: Mexico Dairy Packaging Solution Revenue (undefined) Forecast, by Application 2020 & 2033
- Table 18: Mexico Dairy Packaging Solution Volume (K) Forecast, by Application 2020 & 2033
- Table 19: Global Dairy Packaging Solution Revenue undefined Forecast, by Application 2020 & 2033
- Table 20: Global Dairy Packaging Solution Volume K Forecast, by Application 2020 & 2033
- Table 21: Global Dairy Packaging Solution Revenue undefined Forecast, by Types 2020 & 2033
- Table 22: Global Dairy Packaging Solution Volume K Forecast, by Types 2020 & 2033
- Table 23: Global Dairy Packaging Solution Revenue undefined Forecast, by Country 2020 & 2033
- Table 24: Global Dairy Packaging Solution Volume K Forecast, by Country 2020 & 2033
- Table 25: Brazil Dairy Packaging Solution Revenue (undefined) Forecast, by Application 2020 & 2033
- Table 26: Brazil Dairy Packaging Solution Volume (K) Forecast, by Application 2020 & 2033
- Table 27: Argentina Dairy Packaging Solution Revenue (undefined) Forecast, by Application 2020 & 2033
- Table 28: Argentina Dairy Packaging Solution Volume (K) Forecast, by Application 2020 & 2033
- Table 29: Rest of South America Dairy Packaging Solution Revenue (undefined) Forecast, by Application 2020 & 2033
- Table 30: Rest of South America Dairy Packaging Solution Volume (K) Forecast, by Application 2020 & 2033
- Table 31: Global Dairy Packaging Solution Revenue undefined Forecast, by Application 2020 & 2033
- Table 32: Global Dairy Packaging Solution Volume K Forecast, by Application 2020 & 2033
- Table 33: Global Dairy Packaging Solution Revenue undefined Forecast, by Types 2020 & 2033
- Table 34: Global Dairy Packaging Solution Volume K Forecast, by Types 2020 & 2033
- Table 35: Global Dairy Packaging Solution Revenue undefined Forecast, by Country 2020 & 2033
- Table 36: Global Dairy Packaging Solution Volume K Forecast, by Country 2020 & 2033
- Table 37: United Kingdom Dairy Packaging Solution Revenue (undefined) Forecast, by Application 2020 & 2033
- Table 38: United Kingdom Dairy Packaging Solution Volume (K) Forecast, by Application 2020 & 2033
- Table 39: Germany Dairy Packaging Solution Revenue (undefined) Forecast, by Application 2020 & 2033
- Table 40: Germany Dairy Packaging Solution Volume (K) Forecast, by Application 2020 & 2033
- Table 41: France Dairy Packaging Solution Revenue (undefined) Forecast, by Application 2020 & 2033
- Table 42: France Dairy Packaging Solution Volume (K) Forecast, by Application 2020 & 2033
- Table 43: Italy Dairy Packaging Solution Revenue (undefined) Forecast, by Application 2020 & 2033
- Table 44: Italy Dairy Packaging Solution Volume (K) Forecast, by Application 2020 & 2033
- Table 45: Spain Dairy Packaging Solution Revenue (undefined) Forecast, by Application 2020 & 2033
- Table 46: Spain Dairy Packaging Solution Volume (K) Forecast, by Application 2020 & 2033
- Table 47: Russia Dairy Packaging Solution Revenue (undefined) Forecast, by Application 2020 & 2033
- Table 48: Russia Dairy Packaging Solution Volume (K) Forecast, by Application 2020 & 2033
- Table 49: Benelux Dairy Packaging Solution Revenue (undefined) Forecast, by Application 2020 & 2033
- Table 50: Benelux Dairy Packaging Solution Volume (K) Forecast, by Application 2020 & 2033
- Table 51: Nordics Dairy Packaging Solution Revenue (undefined) Forecast, by Application 2020 & 2033
- Table 52: Nordics Dairy Packaging Solution Volume (K) Forecast, by Application 2020 & 2033
- Table 53: Rest of Europe Dairy Packaging Solution Revenue (undefined) Forecast, by Application 2020 & 2033
- Table 54: Rest of Europe Dairy Packaging Solution Volume (K) Forecast, by Application 2020 & 2033
- Table 55: Global Dairy Packaging Solution Revenue undefined Forecast, by Application 2020 & 2033
- Table 56: Global Dairy Packaging Solution Volume K Forecast, by Application 2020 & 2033
- Table 57: Global Dairy Packaging Solution Revenue undefined Forecast, by Types 2020 & 2033
- Table 58: Global Dairy Packaging Solution Volume K Forecast, by Types 2020 & 2033
- Table 59: Global Dairy Packaging Solution Revenue undefined Forecast, by Country 2020 & 2033
- Table 60: Global Dairy Packaging Solution Volume K Forecast, by Country 2020 & 2033
- Table 61: Turkey Dairy Packaging Solution Revenue (undefined) Forecast, by Application 2020 & 2033
- Table 62: Turkey Dairy Packaging Solution Volume (K) Forecast, by Application 2020 & 2033
- Table 63: Israel Dairy Packaging Solution Revenue (undefined) Forecast, by Application 2020 & 2033
- Table 64: Israel Dairy Packaging Solution Volume (K) Forecast, by Application 2020 & 2033
- Table 65: GCC Dairy Packaging Solution Revenue (undefined) Forecast, by Application 2020 & 2033
- Table 66: GCC Dairy Packaging Solution Volume (K) Forecast, by Application 2020 & 2033
- Table 67: North Africa Dairy Packaging Solution Revenue (undefined) Forecast, by Application 2020 & 2033
- Table 68: North Africa Dairy Packaging Solution Volume (K) Forecast, by Application 2020 & 2033
- Table 69: South Africa Dairy Packaging Solution Revenue (undefined) Forecast, by Application 2020 & 2033
- Table 70: South Africa Dairy Packaging Solution Volume (K) Forecast, by Application 2020 & 2033
- Table 71: Rest of Middle East & Africa Dairy Packaging Solution Revenue (undefined) Forecast, by Application 2020 & 2033
- Table 72: Rest of Middle East & Africa Dairy Packaging Solution Volume (K) Forecast, by Application 2020 & 2033
- Table 73: Global Dairy Packaging Solution Revenue undefined Forecast, by Application 2020 & 2033
- Table 74: Global Dairy Packaging Solution Volume K Forecast, by Application 2020 & 2033
- Table 75: Global Dairy Packaging Solution Revenue undefined Forecast, by Types 2020 & 2033
- Table 76: Global Dairy Packaging Solution Volume K Forecast, by Types 2020 & 2033
- Table 77: Global Dairy Packaging Solution Revenue undefined Forecast, by Country 2020 & 2033
- Table 78: Global Dairy Packaging Solution Volume K Forecast, by Country 2020 & 2033
- Table 79: China Dairy Packaging Solution Revenue (undefined) Forecast, by Application 2020 & 2033
- Table 80: China Dairy Packaging Solution Volume (K) Forecast, by Application 2020 & 2033
- Table 81: India Dairy Packaging Solution Revenue (undefined) Forecast, by Application 2020 & 2033
- Table 82: India Dairy Packaging Solution Volume (K) Forecast, by Application 2020 & 2033
- Table 83: Japan Dairy Packaging Solution Revenue (undefined) Forecast, by Application 2020 & 2033
- Table 84: Japan Dairy Packaging Solution Volume (K) Forecast, by Application 2020 & 2033
- Table 85: South Korea Dairy Packaging Solution Revenue (undefined) Forecast, by Application 2020 & 2033
- Table 86: South Korea Dairy Packaging Solution Volume (K) Forecast, by Application 2020 & 2033
- Table 87: ASEAN Dairy Packaging Solution Revenue (undefined) Forecast, by Application 2020 & 2033
- Table 88: ASEAN Dairy Packaging Solution Volume (K) Forecast, by Application 2020 & 2033
- Table 89: Oceania Dairy Packaging Solution Revenue (undefined) Forecast, by Application 2020 & 2033
- Table 90: Oceania Dairy Packaging Solution Volume (K) Forecast, by Application 2020 & 2033
- Table 91: Rest of Asia Pacific Dairy Packaging Solution Revenue (undefined) Forecast, by Application 2020 & 2033
- Table 92: Rest of Asia Pacific Dairy Packaging Solution Volume (K) Forecast, by Application 2020 & 2033
Frequently Asked Questions
1. What is the projected Compound Annual Growth Rate (CAGR) of the Dairy Packaging Solution?
The projected CAGR is approximately 4.3%.
2. Which companies are prominent players in the Dairy Packaging Solution?
Key companies in the market include Bemis Company, Huhtamaki, Tetra Pak International SA, Berry Global Group, Nampak, Ball Corporation, Sealed Air Corporation, WestRock Company, Mondi Group, Amcor Limited.
3. What are the main segments of the Dairy Packaging Solution?
The market segments include Application, Types.
4. Can you provide details about the market size?
The market size is estimated to be USD XXX N/A as of 2022.
5. What are some drivers contributing to market growth?
N/A
6. What are the notable trends driving market growth?
N/A
7. Are there any restraints impacting market growth?
N/A
8. Can you provide examples of recent developments in the market?
N/A
9. What pricing options are available for accessing the report?
Pricing options include single-user, multi-user, and enterprise licenses priced at USD 3350.00, USD 5025.00, and USD 6700.00 respectively.
10. Is the market size provided in terms of value or volume?
The market size is provided in terms of value, measured in N/A and volume, measured in K.
11. Are there any specific market keywords associated with the report?
Yes, the market keyword associated with the report is "Dairy Packaging Solution," which aids in identifying and referencing the specific market segment covered.
12. How do I determine which pricing option suits my needs best?
The pricing options vary based on user requirements and access needs. Individual users may opt for single-user licenses, while businesses requiring broader access may choose multi-user or enterprise licenses for cost-effective access to the report.
13. Are there any additional resources or data provided in the Dairy Packaging Solution report?
While the report offers comprehensive insights, it's advisable to review the specific contents or supplementary materials provided to ascertain if additional resources or data are available.
14. How can I stay updated on further developments or reports in the Dairy Packaging Solution?
To stay informed about further developments, trends, and reports in the Dairy Packaging Solution, consider subscribing to industry newsletters, following relevant companies and organizations, or regularly checking reputable industry news sources and publications.
Methodology
Step 1 - Identification of Relevant Samples Size from Population Database


Step 2 - Approaches for Defining Global Market Size (Value, Volume* & Price*)

Note*: In applicable scenarios
Step 3 - Data Sources
Primary Research
- Web Analytics
- Survey Reports
- Research Institute
- Latest Research Reports
- Opinion Leaders
Secondary Research
- Annual Reports
- White Paper
- Latest Press Release
- Industry Association
- Paid Database
- Investor Presentations

Step 4 - Data Triangulation
Involves using different sources of information in order to increase the validity of a study
These sources are likely to be stakeholders in a program - participants, other researchers, program staff, other community members, and so on.
Then we put all data in single framework & apply various statistical tools to find out the dynamic on the market.
During the analysis stage, feedback from the stakeholder groups would be compared to determine areas of agreement as well as areas of divergence