

Key Insights
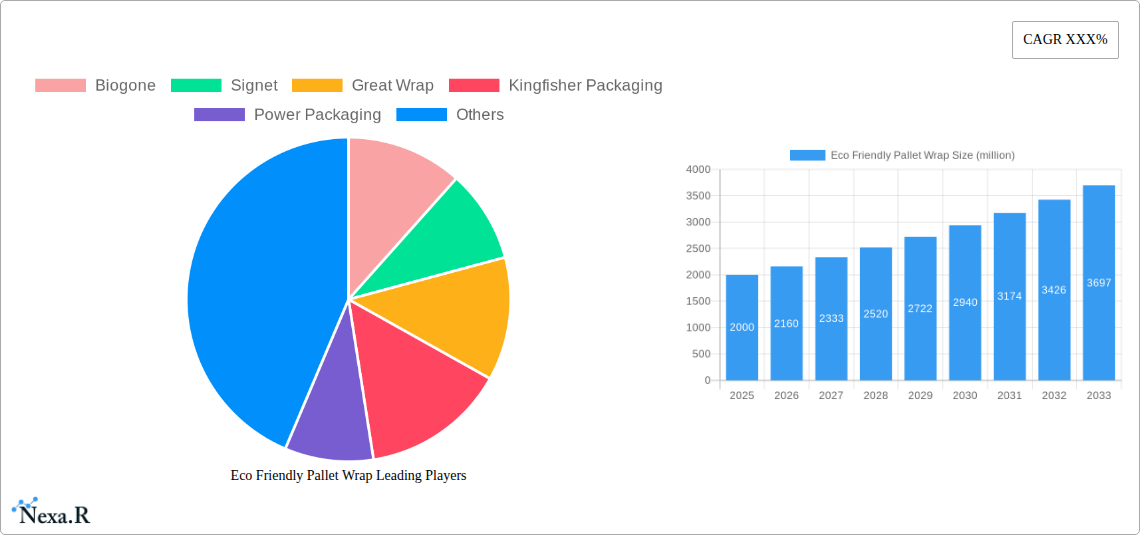
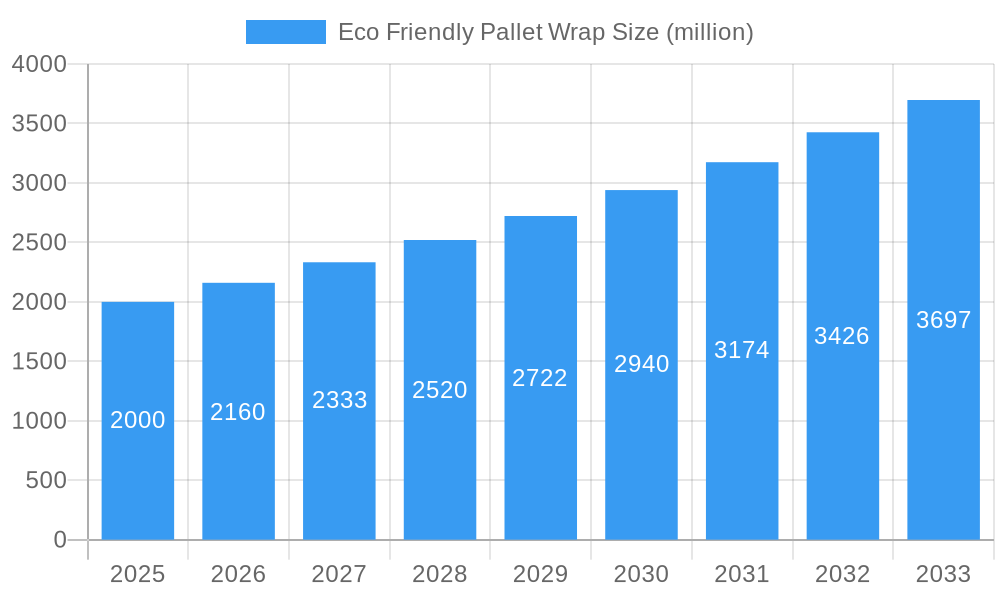
The eco-friendly pallet wrap market is experiencing robust growth, driven by increasing environmental concerns and stringent regulations regarding plastic waste. The market, currently valued at approximately $2 billion in 2025, is projected to witness a Compound Annual Growth Rate (CAGR) of 8% from 2025 to 2033, reaching an estimated market size of $3.8 billion by 2033. This expansion is fueled by several key factors, including the rising adoption of sustainable packaging solutions across various industries like food and beverage, pharmaceuticals, and manufacturing. Consumers are increasingly demanding environmentally conscious products, pushing businesses to adopt eco-friendly alternatives like biodegradable and compostable pallet wraps made from materials such as starch-based polymers, recycled paper, and renewable resources. Furthermore, governmental initiatives promoting circular economy models and reducing plastic pollution are significantly impacting market growth.
Eco Friendly Pallet Wrap Market Size (In Billion)
Significant market segments include biodegradable wraps, compostable wraps, and recycled paper wraps. While biodegradable and compostable options currently hold a larger market share, recycled paper wraps are gaining traction due to their cost-effectiveness and readily available raw materials. Leading companies like Biogone, Signet, Great Wrap, and others are actively innovating and expanding their product portfolios to meet the growing demand, further contributing to market competitiveness and expansion. However, challenges remain, including the relatively higher cost of eco-friendly alternatives compared to conventional plastic wraps and concerns regarding the durability and performance of some biodegradable materials under specific conditions. Overcoming these challenges through technological advancements and broader industry adoption will be crucial for continued market growth.
Eco Friendly Pallet Wrap Company Market Share
Eco-Friendly Pallet Wrap Market Report: 2019-2033
This comprehensive report provides an in-depth analysis of the global eco-friendly pallet wrap market, offering valuable insights for industry professionals, investors, and strategic decision-makers. The study covers the period 2019-2033, with a focus on the forecast period 2025-2033, using 2025 as the base year and estimated year. The report meticulously examines market dynamics, growth trends, leading players, and emerging opportunities within the parent market of sustainable packaging and the child market of industrial packaging solutions. The total market size in 2025 is estimated at xx million units.
Eco Friendly Pallet Wrap Market Dynamics & Structure
This section analyzes the competitive landscape of the eco-friendly pallet wrap market, examining market concentration, technological innovation, regulatory influences, and market trends. The report assesses the impact of substitutes and explores end-user demographics and M&A activity.
- Market Concentration: The market exhibits a moderately concentrated structure, with the top 5 players holding an estimated xx% market share in 2025. The remaining share is distributed among numerous smaller players and regional manufacturers.
- Technological Innovation: Key drivers include advancements in biodegradable and compostable materials (e.g., PLA, PHA), improved film strength and stretch ratios, and the development of recyclable options. Innovation barriers include high initial production costs and challenges in achieving comparable performance to traditional plastic wraps.
- Regulatory Framework: Increasingly stringent environmental regulations globally are pushing the adoption of eco-friendly alternatives. The report examines the impact of specific regulations across different regions.
- Competitive Product Substitutes: Traditional polyethylene (PE) pallet wrap remains a significant competitor, posing challenges due to its lower cost. However, the environmental concerns associated with PE are driving a shift towards sustainable alternatives.
- End-User Demographics: The primary end-users include manufacturing, food and beverage, retail, and logistics companies. Growth is driven by increasing environmental awareness and corporate sustainability initiatives among these sectors.
- M&A Trends: The report analyzes the number and value of M&A transactions in the eco-friendly pallet wrap sector during the historical period, estimating xx million units worth of deals. Consolidation is expected to continue as larger players seek to expand their market share and product portfolios.
Eco Friendly Pallet Wrap Growth Trends & Insights
This section provides a detailed analysis of market size evolution, adoption rates, and technological disruptions impacting the eco-friendly pallet wrap market. The analysis leverages a combination of primary and secondary research to provide a robust understanding of growth trajectories.
The market experienced significant growth during the historical period (2019-2024), with a CAGR of xx%. This growth is projected to continue during the forecast period (2025-2033), driven by increasing demand from environmentally conscious businesses and consumers. The market penetration rate for eco-friendly pallet wrap is currently estimated at xx% in 2025 and is expected to reach xx% by 2033. Technological advancements, such as the development of more durable and cost-effective biodegradable films, are accelerating market adoption. Shifts in consumer behavior toward sustainable products further enhance market growth.
Dominant Regions, Countries, or Segments in Eco Friendly Pallet Wrap
This section identifies the leading regions and segments driving market growth.
- Dominant Region: North America and Western Europe currently lead the market due to high environmental awareness, stringent regulations, and a strong focus on corporate social responsibility. The Asia-Pacific region is expected to experience significant growth in the forecast period due to rising industrialization and increasing adoption of eco-friendly practices.
- Key Drivers: Several factors drive regional dominance, including supportive government policies (e.g., tax incentives, subsidies), robust infrastructure for recycling and waste management, and consumer preference for environmentally friendly products. Furthermore, strong industrial sectors are driving demand within these regions.
- Market Share and Growth Potential: The report provides detailed analysis of market share by region and segment, forecasting growth potential based on factors such as economic growth, industrial development, and regulatory changes.
Eco Friendly Pallet Wrap Product Landscape
Eco-friendly pallet wrap products are characterized by their use of biodegradable and compostable materials, such as PLA, PHA, and cellulose-based films. These materials offer comparable strength and stretch properties to traditional PE wrap, while minimizing environmental impact. Innovations focus on improving film durability, reducing material usage, and enhancing recyclability through partnerships with specialized recycling companies. Unique selling propositions include claims of biodegradability, compostability, and reduced carbon footprint. Technological advancements continue to improve the performance characteristics and reduce the cost of these alternatives.
Key Drivers, Barriers & Challenges in Eco Friendly Pallet Wrap
Key Drivers:
- Growing environmental awareness and concern over plastic pollution.
- Stringent government regulations promoting sustainable packaging solutions.
- Increasing corporate social responsibility initiatives among businesses.
- Rising demand for sustainable supply chain practices.
Key Challenges & Restraints:
- Higher production costs compared to conventional PE wrap, resulting in a xx% higher price point in 2025.
- Potential performance limitations in certain applications.
- Lack of widespread recycling infrastructure for certain eco-friendly materials.
- Competition from traditional, lower-cost alternatives.
Emerging Opportunities in Eco Friendly Pallet Wrap
Emerging opportunities include:
- Expanding into developing markets with high growth potential.
- Developing specialized eco-friendly pallet wraps for specific industries (e.g., food and beverage, pharmaceuticals).
- Leveraging innovations in material science to further enhance performance and reduce costs.
- Creating strategic partnerships with recycling and waste management companies to support product lifecycle management.
Growth Accelerators in the Eco Friendly Pallet Wrap Industry
Technological breakthroughs in biodegradable materials, strategic collaborations for improving recycling capabilities, and aggressive market expansion strategies into new geographical regions are key growth accelerators in the eco-friendly pallet wrap industry. Companies are investing in R&D to enhance the performance and affordability of these sustainable alternatives.
Key Players Shaping the Eco Friendly Pallet Wrap Market
- Biogone
- Signet
- Great Wrap
- Kingfisher Packaging
- Power Packaging
- Cortec Corporation
- Springpack
- Universal Packaging
- Omni
- Sirane Group
- Green Master
- HexcelPack
- EcoEnclose
- Kilby Packaging
- KB Packaging
- Good Natured Products
- Wessex Packaging
- Duo Plast
- Biowrap
- Pacific Group
- Newpack
- Green Spider
Notable Milestones in Eco Friendly Pallet Wrap Sector
- 2020: Several major players launched new lines of compostable pallet wrap.
- 2021: Increased investment in R&D to improve bio-based film strength and durability.
- 2022: Significant increase in adoption by large multinational companies.
- 2023: First major partnerships formed between pallet wrap producers and recycling companies.
- 2024: New regulations in several key markets further incentivize eco-friendly alternatives.
In-Depth Eco Friendly Pallet Wrap Market Outlook
The eco-friendly pallet wrap market is poised for robust growth, driven by the increasing demand for sustainable packaging and stringent environmental regulations. Strategic partnerships and innovative material technologies will further propel market expansion. Companies that invest in R&D, optimize supply chain efficiency, and effectively communicate the environmental benefits of their products are expected to gain a significant competitive edge in this rapidly evolving market. The market will experience significant expansion in both existing and emerging regions, creating lucrative opportunities for established players and new entrants.
Eco Friendly Pallet Wrap Segmentation
-
1. Application
- 1.1. Electronics
- 1.2. Glassware & Ceramics
- 1.3. Food & Beverages
- 1.4. Textiles & Apparels
- 1.5. Retail
- 1.6. Others
-
2. Type
- 2.1. Recycled Plastic
- 2.2. Paper
Eco Friendly Pallet Wrap Segmentation By Geography
-
1. North America
- 1.1. United States
- 1.2. Canada
- 1.3. Mexico
-
2. South America
- 2.1. Brazil
- 2.2. Argentina
- 2.3. Rest of South America
-
3. Europe
- 3.1. United Kingdom
- 3.2. Germany
- 3.3. France
- 3.4. Italy
- 3.5. Spain
- 3.6. Russia
- 3.7. Benelux
- 3.8. Nordics
- 3.9. Rest of Europe
-
4. Middle East & Africa
- 4.1. Turkey
- 4.2. Israel
- 4.3. GCC
- 4.4. North Africa
- 4.5. South Africa
- 4.6. Rest of Middle East & Africa
-
5. Asia Pacific
- 5.1. China
- 5.2. India
- 5.3. Japan
- 5.4. South Korea
- 5.5. ASEAN
- 5.6. Oceania
- 5.7. Rest of Asia Pacific

Eco Friendly Pallet Wrap Regional Market Share
Geographic Coverage of Eco Friendly Pallet Wrap
Eco Friendly Pallet Wrap REPORT HIGHLIGHTS
| Aspects | Details |
|---|---|
| Study Period | 2020-2034 |
| Base Year | 2025 |
| Estimated Year | 2026 |
| Forecast Period | 2026-2034 |
| Historical Period | 2020-2025 |
| Growth Rate | CAGR of XXX% from 2020-2034 |
| Segmentation |
|
Table of Contents
- 1. Introduction
- 1.1. Research Scope
- 1.2. Market Segmentation
- 1.3. Research Methodology
- 1.4. Definitions and Assumptions
- 2. Executive Summary
- 2.1. Introduction
- 3. Market Dynamics
- 3.1. Introduction
- 3.2. Market Drivers
- 3.3. Market Restrains
- 3.4. Market Trends
- 4. Market Factor Analysis
- 4.1. Porters Five Forces
- 4.2. Supply/Value Chain
- 4.3. PESTEL analysis
- 4.4. Market Entropy
- 4.5. Patent/Trademark Analysis
- 5. Global Eco Friendly Pallet Wrap Analysis, Insights and Forecast, 2020-2032
- 5.1. Market Analysis, Insights and Forecast - by Application
- 5.1.1. Electronics
- 5.1.2. Glassware & Ceramics
- 5.1.3. Food & Beverages
- 5.1.4. Textiles & Apparels
- 5.1.5. Retail
- 5.1.6. Others
- 5.2. Market Analysis, Insights and Forecast - by Type
- 5.2.1. Recycled Plastic
- 5.2.2. Paper
- 5.3. Market Analysis, Insights and Forecast - by Region
- 5.3.1. North America
- 5.3.2. South America
- 5.3.3. Europe
- 5.3.4. Middle East & Africa
- 5.3.5. Asia Pacific
- 5.1. Market Analysis, Insights and Forecast - by Application
- 6. North America Eco Friendly Pallet Wrap Analysis, Insights and Forecast, 2020-2032
- 6.1. Market Analysis, Insights and Forecast - by Application
- 6.1.1. Electronics
- 6.1.2. Glassware & Ceramics
- 6.1.3. Food & Beverages
- 6.1.4. Textiles & Apparels
- 6.1.5. Retail
- 6.1.6. Others
- 6.2. Market Analysis, Insights and Forecast - by Type
- 6.2.1. Recycled Plastic
- 6.2.2. Paper
- 6.1. Market Analysis, Insights and Forecast - by Application
- 7. South America Eco Friendly Pallet Wrap Analysis, Insights and Forecast, 2020-2032
- 7.1. Market Analysis, Insights and Forecast - by Application
- 7.1.1. Electronics
- 7.1.2. Glassware & Ceramics
- 7.1.3. Food & Beverages
- 7.1.4. Textiles & Apparels
- 7.1.5. Retail
- 7.1.6. Others
- 7.2. Market Analysis, Insights and Forecast - by Type
- 7.2.1. Recycled Plastic
- 7.2.2. Paper
- 7.1. Market Analysis, Insights and Forecast - by Application
- 8. Europe Eco Friendly Pallet Wrap Analysis, Insights and Forecast, 2020-2032
- 8.1. Market Analysis, Insights and Forecast - by Application
- 8.1.1. Electronics
- 8.1.2. Glassware & Ceramics
- 8.1.3. Food & Beverages
- 8.1.4. Textiles & Apparels
- 8.1.5. Retail
- 8.1.6. Others
- 8.2. Market Analysis, Insights and Forecast - by Type
- 8.2.1. Recycled Plastic
- 8.2.2. Paper
- 8.1. Market Analysis, Insights and Forecast - by Application
- 9. Middle East & Africa Eco Friendly Pallet Wrap Analysis, Insights and Forecast, 2020-2032
- 9.1. Market Analysis, Insights and Forecast - by Application
- 9.1.1. Electronics
- 9.1.2. Glassware & Ceramics
- 9.1.3. Food & Beverages
- 9.1.4. Textiles & Apparels
- 9.1.5. Retail
- 9.1.6. Others
- 9.2. Market Analysis, Insights and Forecast - by Type
- 9.2.1. Recycled Plastic
- 9.2.2. Paper
- 9.1. Market Analysis, Insights and Forecast - by Application
- 10. Asia Pacific Eco Friendly Pallet Wrap Analysis, Insights and Forecast, 2020-2032
- 10.1. Market Analysis, Insights and Forecast - by Application
- 10.1.1. Electronics
- 10.1.2. Glassware & Ceramics
- 10.1.3. Food & Beverages
- 10.1.4. Textiles & Apparels
- 10.1.5. Retail
- 10.1.6. Others
- 10.2. Market Analysis, Insights and Forecast - by Type
- 10.2.1. Recycled Plastic
- 10.2.2. Paper
- 10.1. Market Analysis, Insights and Forecast - by Application
- 11. Competitive Analysis
- 11.1. Global Market Share Analysis 2025
- 11.2. Company Profiles
- 11.2.1 Biogone
- 11.2.1.1. Overview
- 11.2.1.2. Products
- 11.2.1.3. SWOT Analysis
- 11.2.1.4. Recent Developments
- 11.2.1.5. Financials (Based on Availability)
- 11.2.2 Signet
- 11.2.2.1. Overview
- 11.2.2.2. Products
- 11.2.2.3. SWOT Analysis
- 11.2.2.4. Recent Developments
- 11.2.2.5. Financials (Based on Availability)
- 11.2.3 Great Wrap
- 11.2.3.1. Overview
- 11.2.3.2. Products
- 11.2.3.3. SWOT Analysis
- 11.2.3.4. Recent Developments
- 11.2.3.5. Financials (Based on Availability)
- 11.2.4 Kingfisher Packaging
- 11.2.4.1. Overview
- 11.2.4.2. Products
- 11.2.4.3. SWOT Analysis
- 11.2.4.4. Recent Developments
- 11.2.4.5. Financials (Based on Availability)
- 11.2.5 Power Packaging
- 11.2.5.1. Overview
- 11.2.5.2. Products
- 11.2.5.3. SWOT Analysis
- 11.2.5.4. Recent Developments
- 11.2.5.5. Financials (Based on Availability)
- 11.2.6 Cortec Corporation
- 11.2.6.1. Overview
- 11.2.6.2. Products
- 11.2.6.3. SWOT Analysis
- 11.2.6.4. Recent Developments
- 11.2.6.5. Financials (Based on Availability)
- 11.2.7 Springpack
- 11.2.7.1. Overview
- 11.2.7.2. Products
- 11.2.7.3. SWOT Analysis
- 11.2.7.4. Recent Developments
- 11.2.7.5. Financials (Based on Availability)
- 11.2.8 Universal Packaging
- 11.2.8.1. Overview
- 11.2.8.2. Products
- 11.2.8.3. SWOT Analysis
- 11.2.8.4. Recent Developments
- 11.2.8.5. Financials (Based on Availability)
- 11.2.9 Omni
- 11.2.9.1. Overview
- 11.2.9.2. Products
- 11.2.9.3. SWOT Analysis
- 11.2.9.4. Recent Developments
- 11.2.9.5. Financials (Based on Availability)
- 11.2.10 Sirane Group
- 11.2.10.1. Overview
- 11.2.10.2. Products
- 11.2.10.3. SWOT Analysis
- 11.2.10.4. Recent Developments
- 11.2.10.5. Financials (Based on Availability)
- 11.2.11 Green Master
- 11.2.11.1. Overview
- 11.2.11.2. Products
- 11.2.11.3. SWOT Analysis
- 11.2.11.4. Recent Developments
- 11.2.11.5. Financials (Based on Availability)
- 11.2.12 HexcelPack
- 11.2.12.1. Overview
- 11.2.12.2. Products
- 11.2.12.3. SWOT Analysis
- 11.2.12.4. Recent Developments
- 11.2.12.5. Financials (Based on Availability)
- 11.2.13 EcoEnclose
- 11.2.13.1. Overview
- 11.2.13.2. Products
- 11.2.13.3. SWOT Analysis
- 11.2.13.4. Recent Developments
- 11.2.13.5. Financials (Based on Availability)
- 11.2.14 Kilby Packaging
- 11.2.14.1. Overview
- 11.2.14.2. Products
- 11.2.14.3. SWOT Analysis
- 11.2.14.4. Recent Developments
- 11.2.14.5. Financials (Based on Availability)
- 11.2.15 KB Packaging
- 11.2.15.1. Overview
- 11.2.15.2. Products
- 11.2.15.3. SWOT Analysis
- 11.2.15.4. Recent Developments
- 11.2.15.5. Financials (Based on Availability)
- 11.2.16 Good Natured Products
- 11.2.16.1. Overview
- 11.2.16.2. Products
- 11.2.16.3. SWOT Analysis
- 11.2.16.4. Recent Developments
- 11.2.16.5. Financials (Based on Availability)
- 11.2.17 Wessex Packaging
- 11.2.17.1. Overview
- 11.2.17.2. Products
- 11.2.17.3. SWOT Analysis
- 11.2.17.4. Recent Developments
- 11.2.17.5. Financials (Based on Availability)
- 11.2.18 Duo Plast
- 11.2.18.1. Overview
- 11.2.18.2. Products
- 11.2.18.3. SWOT Analysis
- 11.2.18.4. Recent Developments
- 11.2.18.5. Financials (Based on Availability)
- 11.2.19 Biowrap
- 11.2.19.1. Overview
- 11.2.19.2. Products
- 11.2.19.3. SWOT Analysis
- 11.2.19.4. Recent Developments
- 11.2.19.5. Financials (Based on Availability)
- 11.2.20 Pacific Group
- 11.2.20.1. Overview
- 11.2.20.2. Products
- 11.2.20.3. SWOT Analysis
- 11.2.20.4. Recent Developments
- 11.2.20.5. Financials (Based on Availability)
- 11.2.21 Newpack
- 11.2.21.1. Overview
- 11.2.21.2. Products
- 11.2.21.3. SWOT Analysis
- 11.2.21.4. Recent Developments
- 11.2.21.5. Financials (Based on Availability)
- 11.2.22 Green Spider
- 11.2.22.1. Overview
- 11.2.22.2. Products
- 11.2.22.3. SWOT Analysis
- 11.2.22.4. Recent Developments
- 11.2.22.5. Financials (Based on Availability)
- 11.2.1 Biogone
List of Figures
- Figure 1: Global Eco Friendly Pallet Wrap Revenue Breakdown (million, %) by Region 2025 & 2033
- Figure 2: Global Eco Friendly Pallet Wrap Volume Breakdown (K, %) by Region 2025 & 2033
- Figure 3: North America Eco Friendly Pallet Wrap Revenue (million), by Application 2025 & 2033
- Figure 4: North America Eco Friendly Pallet Wrap Volume (K), by Application 2025 & 2033
- Figure 5: North America Eco Friendly Pallet Wrap Revenue Share (%), by Application 2025 & 2033
- Figure 6: North America Eco Friendly Pallet Wrap Volume Share (%), by Application 2025 & 2033
- Figure 7: North America Eco Friendly Pallet Wrap Revenue (million), by Type 2025 & 2033
- Figure 8: North America Eco Friendly Pallet Wrap Volume (K), by Type 2025 & 2033
- Figure 9: North America Eco Friendly Pallet Wrap Revenue Share (%), by Type 2025 & 2033
- Figure 10: North America Eco Friendly Pallet Wrap Volume Share (%), by Type 2025 & 2033
- Figure 11: North America Eco Friendly Pallet Wrap Revenue (million), by Country 2025 & 2033
- Figure 12: North America Eco Friendly Pallet Wrap Volume (K), by Country 2025 & 2033
- Figure 13: North America Eco Friendly Pallet Wrap Revenue Share (%), by Country 2025 & 2033
- Figure 14: North America Eco Friendly Pallet Wrap Volume Share (%), by Country 2025 & 2033
- Figure 15: South America Eco Friendly Pallet Wrap Revenue (million), by Application 2025 & 2033
- Figure 16: South America Eco Friendly Pallet Wrap Volume (K), by Application 2025 & 2033
- Figure 17: South America Eco Friendly Pallet Wrap Revenue Share (%), by Application 2025 & 2033
- Figure 18: South America Eco Friendly Pallet Wrap Volume Share (%), by Application 2025 & 2033
- Figure 19: South America Eco Friendly Pallet Wrap Revenue (million), by Type 2025 & 2033
- Figure 20: South America Eco Friendly Pallet Wrap Volume (K), by Type 2025 & 2033
- Figure 21: South America Eco Friendly Pallet Wrap Revenue Share (%), by Type 2025 & 2033
- Figure 22: South America Eco Friendly Pallet Wrap Volume Share (%), by Type 2025 & 2033
- Figure 23: South America Eco Friendly Pallet Wrap Revenue (million), by Country 2025 & 2033
- Figure 24: South America Eco Friendly Pallet Wrap Volume (K), by Country 2025 & 2033
- Figure 25: South America Eco Friendly Pallet Wrap Revenue Share (%), by Country 2025 & 2033
- Figure 26: South America Eco Friendly Pallet Wrap Volume Share (%), by Country 2025 & 2033
- Figure 27: Europe Eco Friendly Pallet Wrap Revenue (million), by Application 2025 & 2033
- Figure 28: Europe Eco Friendly Pallet Wrap Volume (K), by Application 2025 & 2033
- Figure 29: Europe Eco Friendly Pallet Wrap Revenue Share (%), by Application 2025 & 2033
- Figure 30: Europe Eco Friendly Pallet Wrap Volume Share (%), by Application 2025 & 2033
- Figure 31: Europe Eco Friendly Pallet Wrap Revenue (million), by Type 2025 & 2033
- Figure 32: Europe Eco Friendly Pallet Wrap Volume (K), by Type 2025 & 2033
- Figure 33: Europe Eco Friendly Pallet Wrap Revenue Share (%), by Type 2025 & 2033
- Figure 34: Europe Eco Friendly Pallet Wrap Volume Share (%), by Type 2025 & 2033
- Figure 35: Europe Eco Friendly Pallet Wrap Revenue (million), by Country 2025 & 2033
- Figure 36: Europe Eco Friendly Pallet Wrap Volume (K), by Country 2025 & 2033
- Figure 37: Europe Eco Friendly Pallet Wrap Revenue Share (%), by Country 2025 & 2033
- Figure 38: Europe Eco Friendly Pallet Wrap Volume Share (%), by Country 2025 & 2033
- Figure 39: Middle East & Africa Eco Friendly Pallet Wrap Revenue (million), by Application 2025 & 2033
- Figure 40: Middle East & Africa Eco Friendly Pallet Wrap Volume (K), by Application 2025 & 2033
- Figure 41: Middle East & Africa Eco Friendly Pallet Wrap Revenue Share (%), by Application 2025 & 2033
- Figure 42: Middle East & Africa Eco Friendly Pallet Wrap Volume Share (%), by Application 2025 & 2033
- Figure 43: Middle East & Africa Eco Friendly Pallet Wrap Revenue (million), by Type 2025 & 2033
- Figure 44: Middle East & Africa Eco Friendly Pallet Wrap Volume (K), by Type 2025 & 2033
- Figure 45: Middle East & Africa Eco Friendly Pallet Wrap Revenue Share (%), by Type 2025 & 2033
- Figure 46: Middle East & Africa Eco Friendly Pallet Wrap Volume Share (%), by Type 2025 & 2033
- Figure 47: Middle East & Africa Eco Friendly Pallet Wrap Revenue (million), by Country 2025 & 2033
- Figure 48: Middle East & Africa Eco Friendly Pallet Wrap Volume (K), by Country 2025 & 2033
- Figure 49: Middle East & Africa Eco Friendly Pallet Wrap Revenue Share (%), by Country 2025 & 2033
- Figure 50: Middle East & Africa Eco Friendly Pallet Wrap Volume Share (%), by Country 2025 & 2033
- Figure 51: Asia Pacific Eco Friendly Pallet Wrap Revenue (million), by Application 2025 & 2033
- Figure 52: Asia Pacific Eco Friendly Pallet Wrap Volume (K), by Application 2025 & 2033
- Figure 53: Asia Pacific Eco Friendly Pallet Wrap Revenue Share (%), by Application 2025 & 2033
- Figure 54: Asia Pacific Eco Friendly Pallet Wrap Volume Share (%), by Application 2025 & 2033
- Figure 55: Asia Pacific Eco Friendly Pallet Wrap Revenue (million), by Type 2025 & 2033
- Figure 56: Asia Pacific Eco Friendly Pallet Wrap Volume (K), by Type 2025 & 2033
- Figure 57: Asia Pacific Eco Friendly Pallet Wrap Revenue Share (%), by Type 2025 & 2033
- Figure 58: Asia Pacific Eco Friendly Pallet Wrap Volume Share (%), by Type 2025 & 2033
- Figure 59: Asia Pacific Eco Friendly Pallet Wrap Revenue (million), by Country 2025 & 2033
- Figure 60: Asia Pacific Eco Friendly Pallet Wrap Volume (K), by Country 2025 & 2033
- Figure 61: Asia Pacific Eco Friendly Pallet Wrap Revenue Share (%), by Country 2025 & 2033
- Figure 62: Asia Pacific Eco Friendly Pallet Wrap Volume Share (%), by Country 2025 & 2033
List of Tables
- Table 1: Global Eco Friendly Pallet Wrap Revenue million Forecast, by Application 2020 & 2033
- Table 2: Global Eco Friendly Pallet Wrap Volume K Forecast, by Application 2020 & 2033
- Table 3: Global Eco Friendly Pallet Wrap Revenue million Forecast, by Type 2020 & 2033
- Table 4: Global Eco Friendly Pallet Wrap Volume K Forecast, by Type 2020 & 2033
- Table 5: Global Eco Friendly Pallet Wrap Revenue million Forecast, by Region 2020 & 2033
- Table 6: Global Eco Friendly Pallet Wrap Volume K Forecast, by Region 2020 & 2033
- Table 7: Global Eco Friendly Pallet Wrap Revenue million Forecast, by Application 2020 & 2033
- Table 8: Global Eco Friendly Pallet Wrap Volume K Forecast, by Application 2020 & 2033
- Table 9: Global Eco Friendly Pallet Wrap Revenue million Forecast, by Type 2020 & 2033
- Table 10: Global Eco Friendly Pallet Wrap Volume K Forecast, by Type 2020 & 2033
- Table 11: Global Eco Friendly Pallet Wrap Revenue million Forecast, by Country 2020 & 2033
- Table 12: Global Eco Friendly Pallet Wrap Volume K Forecast, by Country 2020 & 2033
- Table 13: United States Eco Friendly Pallet Wrap Revenue (million) Forecast, by Application 2020 & 2033
- Table 14: United States Eco Friendly Pallet Wrap Volume (K) Forecast, by Application 2020 & 2033
- Table 15: Canada Eco Friendly Pallet Wrap Revenue (million) Forecast, by Application 2020 & 2033
- Table 16: Canada Eco Friendly Pallet Wrap Volume (K) Forecast, by Application 2020 & 2033
- Table 17: Mexico Eco Friendly Pallet Wrap Revenue (million) Forecast, by Application 2020 & 2033
- Table 18: Mexico Eco Friendly Pallet Wrap Volume (K) Forecast, by Application 2020 & 2033
- Table 19: Global Eco Friendly Pallet Wrap Revenue million Forecast, by Application 2020 & 2033
- Table 20: Global Eco Friendly Pallet Wrap Volume K Forecast, by Application 2020 & 2033
- Table 21: Global Eco Friendly Pallet Wrap Revenue million Forecast, by Type 2020 & 2033
- Table 22: Global Eco Friendly Pallet Wrap Volume K Forecast, by Type 2020 & 2033
- Table 23: Global Eco Friendly Pallet Wrap Revenue million Forecast, by Country 2020 & 2033
- Table 24: Global Eco Friendly Pallet Wrap Volume K Forecast, by Country 2020 & 2033
- Table 25: Brazil Eco Friendly Pallet Wrap Revenue (million) Forecast, by Application 2020 & 2033
- Table 26: Brazil Eco Friendly Pallet Wrap Volume (K) Forecast, by Application 2020 & 2033
- Table 27: Argentina Eco Friendly Pallet Wrap Revenue (million) Forecast, by Application 2020 & 2033
- Table 28: Argentina Eco Friendly Pallet Wrap Volume (K) Forecast, by Application 2020 & 2033
- Table 29: Rest of South America Eco Friendly Pallet Wrap Revenue (million) Forecast, by Application 2020 & 2033
- Table 30: Rest of South America Eco Friendly Pallet Wrap Volume (K) Forecast, by Application 2020 & 2033
- Table 31: Global Eco Friendly Pallet Wrap Revenue million Forecast, by Application 2020 & 2033
- Table 32: Global Eco Friendly Pallet Wrap Volume K Forecast, by Application 2020 & 2033
- Table 33: Global Eco Friendly Pallet Wrap Revenue million Forecast, by Type 2020 & 2033
- Table 34: Global Eco Friendly Pallet Wrap Volume K Forecast, by Type 2020 & 2033
- Table 35: Global Eco Friendly Pallet Wrap Revenue million Forecast, by Country 2020 & 2033
- Table 36: Global Eco Friendly Pallet Wrap Volume K Forecast, by Country 2020 & 2033
- Table 37: United Kingdom Eco Friendly Pallet Wrap Revenue (million) Forecast, by Application 2020 & 2033
- Table 38: United Kingdom Eco Friendly Pallet Wrap Volume (K) Forecast, by Application 2020 & 2033
- Table 39: Germany Eco Friendly Pallet Wrap Revenue (million) Forecast, by Application 2020 & 2033
- Table 40: Germany Eco Friendly Pallet Wrap Volume (K) Forecast, by Application 2020 & 2033
- Table 41: France Eco Friendly Pallet Wrap Revenue (million) Forecast, by Application 2020 & 2033
- Table 42: France Eco Friendly Pallet Wrap Volume (K) Forecast, by Application 2020 & 2033
- Table 43: Italy Eco Friendly Pallet Wrap Revenue (million) Forecast, by Application 2020 & 2033
- Table 44: Italy Eco Friendly Pallet Wrap Volume (K) Forecast, by Application 2020 & 2033
- Table 45: Spain Eco Friendly Pallet Wrap Revenue (million) Forecast, by Application 2020 & 2033
- Table 46: Spain Eco Friendly Pallet Wrap Volume (K) Forecast, by Application 2020 & 2033
- Table 47: Russia Eco Friendly Pallet Wrap Revenue (million) Forecast, by Application 2020 & 2033
- Table 48: Russia Eco Friendly Pallet Wrap Volume (K) Forecast, by Application 2020 & 2033
- Table 49: Benelux Eco Friendly Pallet Wrap Revenue (million) Forecast, by Application 2020 & 2033
- Table 50: Benelux Eco Friendly Pallet Wrap Volume (K) Forecast, by Application 2020 & 2033
- Table 51: Nordics Eco Friendly Pallet Wrap Revenue (million) Forecast, by Application 2020 & 2033
- Table 52: Nordics Eco Friendly Pallet Wrap Volume (K) Forecast, by Application 2020 & 2033
- Table 53: Rest of Europe Eco Friendly Pallet Wrap Revenue (million) Forecast, by Application 2020 & 2033
- Table 54: Rest of Europe Eco Friendly Pallet Wrap Volume (K) Forecast, by Application 2020 & 2033
- Table 55: Global Eco Friendly Pallet Wrap Revenue million Forecast, by Application 2020 & 2033
- Table 56: Global Eco Friendly Pallet Wrap Volume K Forecast, by Application 2020 & 2033
- Table 57: Global Eco Friendly Pallet Wrap Revenue million Forecast, by Type 2020 & 2033
- Table 58: Global Eco Friendly Pallet Wrap Volume K Forecast, by Type 2020 & 2033
- Table 59: Global Eco Friendly Pallet Wrap Revenue million Forecast, by Country 2020 & 2033
- Table 60: Global Eco Friendly Pallet Wrap Volume K Forecast, by Country 2020 & 2033
- Table 61: Turkey Eco Friendly Pallet Wrap Revenue (million) Forecast, by Application 2020 & 2033
- Table 62: Turkey Eco Friendly Pallet Wrap Volume (K) Forecast, by Application 2020 & 2033
- Table 63: Israel Eco Friendly Pallet Wrap Revenue (million) Forecast, by Application 2020 & 2033
- Table 64: Israel Eco Friendly Pallet Wrap Volume (K) Forecast, by Application 2020 & 2033
- Table 65: GCC Eco Friendly Pallet Wrap Revenue (million) Forecast, by Application 2020 & 2033
- Table 66: GCC Eco Friendly Pallet Wrap Volume (K) Forecast, by Application 2020 & 2033
- Table 67: North Africa Eco Friendly Pallet Wrap Revenue (million) Forecast, by Application 2020 & 2033
- Table 68: North Africa Eco Friendly Pallet Wrap Volume (K) Forecast, by Application 2020 & 2033
- Table 69: South Africa Eco Friendly Pallet Wrap Revenue (million) Forecast, by Application 2020 & 2033
- Table 70: South Africa Eco Friendly Pallet Wrap Volume (K) Forecast, by Application 2020 & 2033
- Table 71: Rest of Middle East & Africa Eco Friendly Pallet Wrap Revenue (million) Forecast, by Application 2020 & 2033
- Table 72: Rest of Middle East & Africa Eco Friendly Pallet Wrap Volume (K) Forecast, by Application 2020 & 2033
- Table 73: Global Eco Friendly Pallet Wrap Revenue million Forecast, by Application 2020 & 2033
- Table 74: Global Eco Friendly Pallet Wrap Volume K Forecast, by Application 2020 & 2033
- Table 75: Global Eco Friendly Pallet Wrap Revenue million Forecast, by Type 2020 & 2033
- Table 76: Global Eco Friendly Pallet Wrap Volume K Forecast, by Type 2020 & 2033
- Table 77: Global Eco Friendly Pallet Wrap Revenue million Forecast, by Country 2020 & 2033
- Table 78: Global Eco Friendly Pallet Wrap Volume K Forecast, by Country 2020 & 2033
- Table 79: China Eco Friendly Pallet Wrap Revenue (million) Forecast, by Application 2020 & 2033
- Table 80: China Eco Friendly Pallet Wrap Volume (K) Forecast, by Application 2020 & 2033
- Table 81: India Eco Friendly Pallet Wrap Revenue (million) Forecast, by Application 2020 & 2033
- Table 82: India Eco Friendly Pallet Wrap Volume (K) Forecast, by Application 2020 & 2033
- Table 83: Japan Eco Friendly Pallet Wrap Revenue (million) Forecast, by Application 2020 & 2033
- Table 84: Japan Eco Friendly Pallet Wrap Volume (K) Forecast, by Application 2020 & 2033
- Table 85: South Korea Eco Friendly Pallet Wrap Revenue (million) Forecast, by Application 2020 & 2033
- Table 86: South Korea Eco Friendly Pallet Wrap Volume (K) Forecast, by Application 2020 & 2033
- Table 87: ASEAN Eco Friendly Pallet Wrap Revenue (million) Forecast, by Application 2020 & 2033
- Table 88: ASEAN Eco Friendly Pallet Wrap Volume (K) Forecast, by Application 2020 & 2033
- Table 89: Oceania Eco Friendly Pallet Wrap Revenue (million) Forecast, by Application 2020 & 2033
- Table 90: Oceania Eco Friendly Pallet Wrap Volume (K) Forecast, by Application 2020 & 2033
- Table 91: Rest of Asia Pacific Eco Friendly Pallet Wrap Revenue (million) Forecast, by Application 2020 & 2033
- Table 92: Rest of Asia Pacific Eco Friendly Pallet Wrap Volume (K) Forecast, by Application 2020 & 2033
Frequently Asked Questions
1. What is the projected Compound Annual Growth Rate (CAGR) of the Eco Friendly Pallet Wrap?
The projected CAGR is approximately XXX%.
2. Which companies are prominent players in the Eco Friendly Pallet Wrap?
Key companies in the market include Biogone, Signet, Great Wrap, Kingfisher Packaging, Power Packaging, Cortec Corporation, Springpack, Universal Packaging, Omni, Sirane Group, Green Master, HexcelPack, EcoEnclose, Kilby Packaging, KB Packaging, Good Natured Products, Wessex Packaging, Duo Plast, Biowrap, Pacific Group, Newpack, Green Spider.
3. What are the main segments of the Eco Friendly Pallet Wrap?
The market segments include Application, Type.
4. Can you provide details about the market size?
The market size is estimated to be USD XXX million as of 2022.
5. What are some drivers contributing to market growth?
N/A
6. What are the notable trends driving market growth?
N/A
7. Are there any restraints impacting market growth?
N/A
8. Can you provide examples of recent developments in the market?
N/A
9. What pricing options are available for accessing the report?
Pricing options include single-user, multi-user, and enterprise licenses priced at USD 3950.00, USD 5925.00, and USD 7900.00 respectively.
10. Is the market size provided in terms of value or volume?
The market size is provided in terms of value, measured in million and volume, measured in K.
11. Are there any specific market keywords associated with the report?
Yes, the market keyword associated with the report is "Eco Friendly Pallet Wrap," which aids in identifying and referencing the specific market segment covered.
12. How do I determine which pricing option suits my needs best?
The pricing options vary based on user requirements and access needs. Individual users may opt for single-user licenses, while businesses requiring broader access may choose multi-user or enterprise licenses for cost-effective access to the report.
13. Are there any additional resources or data provided in the Eco Friendly Pallet Wrap report?
While the report offers comprehensive insights, it's advisable to review the specific contents or supplementary materials provided to ascertain if additional resources or data are available.
14. How can I stay updated on further developments or reports in the Eco Friendly Pallet Wrap?
To stay informed about further developments, trends, and reports in the Eco Friendly Pallet Wrap, consider subscribing to industry newsletters, following relevant companies and organizations, or regularly checking reputable industry news sources and publications.
Methodology
Step 1 - Identification of Relevant Samples Size from Population Database


Step 2 - Approaches for Defining Global Market Size (Value, Volume* & Price*)

Note*: In applicable scenarios
Step 3 - Data Sources
Primary Research
- Web Analytics
- Survey Reports
- Research Institute
- Latest Research Reports
- Opinion Leaders
Secondary Research
- Annual Reports
- White Paper
- Latest Press Release
- Industry Association
- Paid Database
- Investor Presentations

Step 4 - Data Triangulation
Involves using different sources of information in order to increase the validity of a study
These sources are likely to be stakeholders in a program - participants, other researchers, program staff, other community members, and so on.
Then we put all data in single framework & apply various statistical tools to find out the dynamic on the market.
During the analysis stage, feedback from the stakeholder groups would be compared to determine areas of agreement as well as areas of divergence