

Key Insights
The global egg transport box market is experiencing significant growth, propelled by rising global egg consumption and the escalating demand for secure and efficient egg transportation solutions. Key growth drivers include the expanding poultry industry, a growing consumer preference for fresh eggs, and the increasing adoption of sustainable and eco-friendly packaging. Innovations in packaging materials, such as biodegradable and recyclable options, are further stimulating market expansion. Leading companies, including BEST, HatchTech B.V., and Smurfit Kappa, are actively pursuing product innovation and portfolio diversification to address evolving industry and consumer needs. This competitive environment encourages advancements and efficiency gains within the sector. The market is segmented by box type (e.g., pulp, plastic, cardboard), size, and application (e.g., retail, wholesale, industrial). Despite potential restraints from volatile raw material costs and stringent food safety regulations, the market exhibits a positive growth outlook, presenting substantial opportunities for businesses in the egg transport box production and distribution value chain.
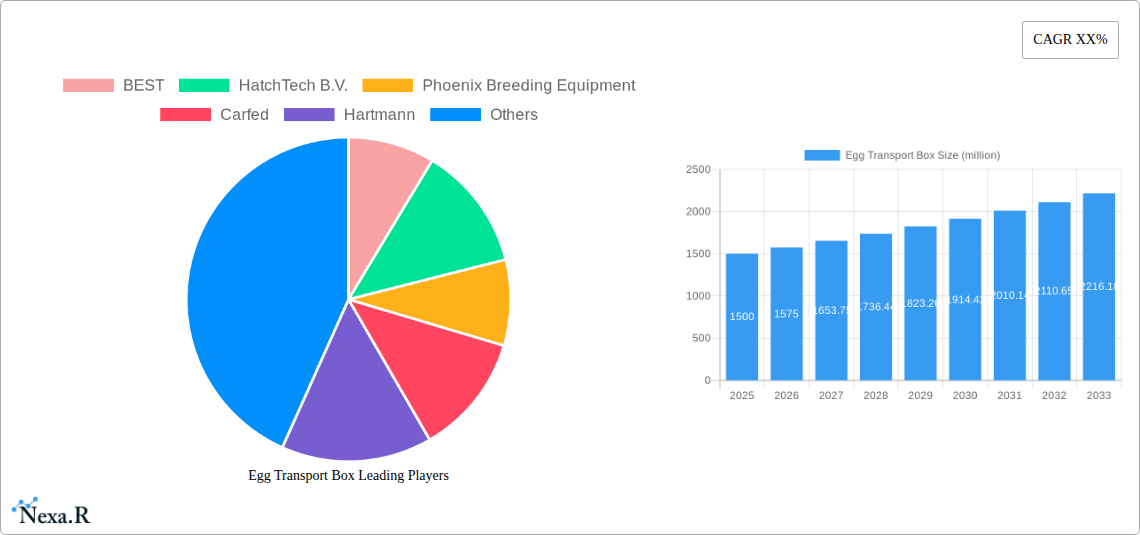
Egg Transport Box Market Size (In Billion)
The projected Compound Annual Growth Rate (CAGR) is estimated at 6.3% for the forecast period (2025-2033), indicating substantial market expansion. The market size is expected to grow from $7.75 billion in the base year 2024 to a significantly larger figure by 2033. Regional market shares are anticipated to vary, with developed economies demonstrating steady growth and emerging markets exhibiting accelerated expansion due to evolving consumption patterns. Furthermore, the intensifying focus on sustainability and eco-conscious packaging will significantly influence future market trends, driving innovation in materials and designs to minimize environmental impact. This imperative necessitates continuous adaptation from market participants to maintain competitiveness and meet evolving consumer expectations.

Egg Transport Box Company Market Share
Egg Transport Box Market Report: 2019-2033
This comprehensive report provides a detailed analysis of the global egg transport box market, offering invaluable insights for industry professionals, investors, and strategic decision-makers. The study covers the period 2019-2033, with a focus on the forecast period 2025-2033, using 2025 as the base year. The report leverages extensive primary and secondary research to deliver a precise and actionable understanding of market dynamics, growth trends, and key players. The total market size is projected to reach xx million units by 2033.
Egg Transport Box Market Dynamics & Structure
The global egg transport box market is characterized by a moderately concentrated structure, with key players like BEST, HatchTech B.V., and Smurfit Kappa holding significant market share. The market is driven by technological advancements in packaging materials (e.g., sustainable alternatives like PulPac's molded fiber solutions), increasing consumer demand for safer and more efficient egg transportation, and stringent regulatory frameworks focused on food safety and environmental sustainability. Mergers and acquisitions (M&A) activity has been relatively moderate in recent years, with a focus on expanding product portfolios and geographical reach. Innovation in the sector faces challenges due to the cost of developing and implementing new technologies and the need to meet strict industry standards. Substitute products include reusable plastic containers, however, these often lack the environmental benefits and cost-effectiveness of many current egg transport boxes.
- Market Concentration: Moderately concentrated, with top 5 players holding approximately xx% market share in 2025.
- Technological Innovation: Driven by sustainable materials (e.g., recycled paperboard, molded fiber) and improved design for shock absorption.
- Regulatory Framework: Emphasis on food safety and hygiene, impacting material selection and design standards.
- Competitive Substitutes: Reusable plastic containers, though often less cost-effective and environmentally friendly.
- End-User Demographics: Primarily poultry farms, egg packing plants, wholesalers, and retailers.
- M&A Trends: Moderate activity focused on geographic expansion and product diversification; xx M&A deals recorded between 2019-2024.
Egg Transport Box Growth Trends & Insights
The global egg transport box market has exhibited steady growth over the historical period (2019-2024), driven by rising global egg consumption and increasing demand for efficient and safe egg transportation. The market is expected to maintain a healthy Compound Annual Growth Rate (CAGR) of xx% during the forecast period (2025-2033), reaching an estimated xx million units by 2033. This growth is fueled by several factors, including the rising adoption of automated egg handling systems, increasing awareness of sustainable packaging solutions, and the growth of the e-commerce industry, which demands robust packaging solutions for fragile goods. Technological advancements, particularly in the area of lightweight, durable materials, are contributing to increased market penetration and adoption rates. Consumer behavior shifts towards premium and sustainable packaging solutions are further supporting market expansion.
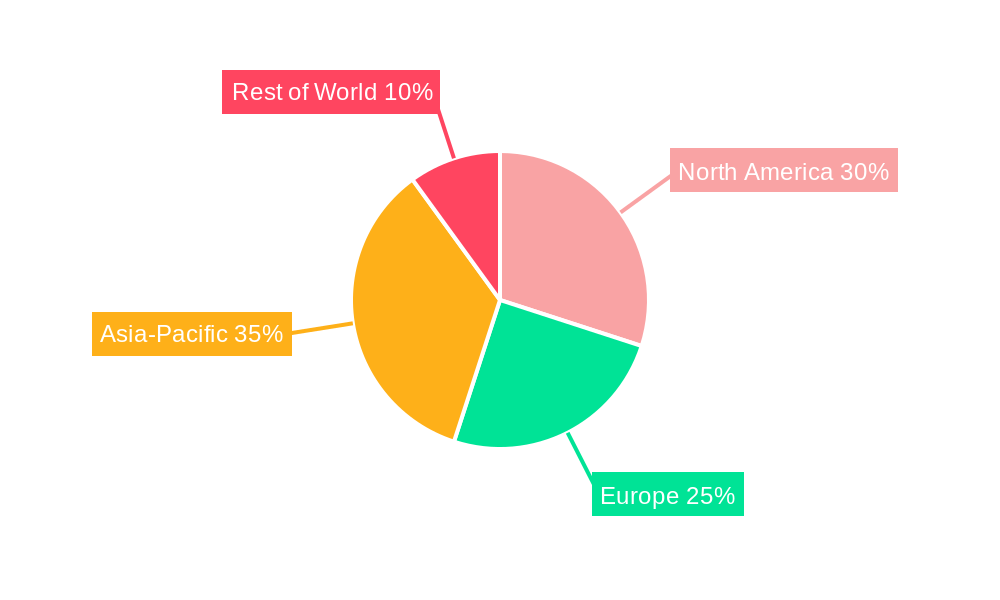
Dominant Regions, Countries, or Segments in Egg Transport Box
The [Dominant Region/Country, e.g., North America] is currently the leading region in the egg transport box market, accounting for approximately xx% of the global market share in 2025. This dominance is primarily attributed to:
- High Egg Production and Consumption: The region has a substantial poultry industry and high per capita egg consumption.
- Well-Developed Infrastructure: Efficient logistics and supply chains facilitate easy distribution of egg transport boxes.
- Favorable Economic Policies: Government support for the agricultural sector encourages industry growth.
- Stringent Food Safety Regulations: Drive demand for high-quality and safe packaging materials.
Other regions, like [Region 2, e.g., Europe] and [Region 3, e.g., Asia-Pacific], are also exhibiting significant growth potential, driven by factors such as increasing urbanization, rising disposable incomes, and expanding poultry industries.
Egg Transport Box Product Landscape
The egg transport box market offers a diverse range of products, encompassing various materials, designs, and sizes to cater to different needs. These include traditional cardboard boxes, plastic containers, and increasingly, innovative sustainable solutions like molded fiber and pulp-based packaging. Key innovations focus on enhanced shock absorption, improved stacking capabilities, and reduced environmental impact. Unique selling propositions often include superior protection against breakage, ease of use, and eco-friendly certifications. Technological advancements are driving the development of lighter, stronger, and more cost-effective egg transport boxes.
Key Drivers, Barriers & Challenges in Egg Transport Box
Key Drivers:
- Rising global egg consumption and production.
- Growing demand for sustainable and eco-friendly packaging.
- Technological advancements leading to improved designs and materials.
- Stringent food safety regulations.
Key Challenges & Restraints:
- Fluctuations in raw material prices, particularly for pulp and paper.
- Intense competition among established and emerging players.
- Supply chain disruptions impacting raw material availability and timely delivery.
- Regulatory compliance requirements and potential changes in environmental regulations. These factors may contribute to approximately xx% increase in production costs by 2030.
Emerging Opportunities in Egg Transport Box
- Growing demand for customized and specialized egg transport boxes for niche markets (e.g., organic eggs).
- Expansion into emerging economies with developing poultry industries.
- Increasing adoption of smart packaging technologies (e.g., temperature sensors) to enhance egg freshness and safety.
- Development of biodegradable and compostable packaging solutions to meet environmental sustainability goals.
Growth Accelerators in the Egg Transport Box Industry
Strategic partnerships between packaging manufacturers and poultry producers can lead to the development of innovative and cost-effective egg transport solutions. Technological advancements in material science and packaging design will continue to fuel market growth. Furthermore, expansion into new markets and geographical regions, especially developing countries with burgeoning poultry industries, present lucrative growth opportunities.
Key Players Shaping the Egg Transport Box Market
- BEST
- HatchTech B.V.
- Phoenix Breeding Equipment
- Carfed
- Hartmann
- Huhtamaki
- CKF
- HOLLANDIA
- Pactiv Evergreen
- PulPac
- Cellulose de la Loire
- GI-OVO
- Smurfit Kappa
Notable Milestones in Egg Transport Box Sector
- 2020: PulPac launched its innovative molded fiber egg carton, highlighting sustainable packaging solutions.
- 2022: Smurfit Kappa invested in a new production line for egg cartons, expanding its capacity.
- 2023: A significant merger between two major egg packaging companies resulted in expanded market share. (Specific details unavailable - xx)
In-Depth Egg Transport Box Market Outlook
The future of the egg transport box market is bright, driven by the continuous rise in global egg consumption and the ongoing quest for sustainable and innovative packaging solutions. Strategic partnerships, technological advancements, and expansion into emerging markets will be key drivers of growth. The market presents significant opportunities for companies that can adapt to evolving consumer preferences, regulatory requirements, and environmental concerns. The projected market size, combined with these growth accelerators, suggests a robust and expanding sector ripe for further investment and innovation.
Egg Transport Box Segmentation
-
1. Application
- 1.1. Transportation and Logistics
- 1.2. Egg Packing Station
- 1.3. Other
-
2. Types
- 2.1. Paper Box
- 2.2. Plastic Box
- 2.3. Polystyrene Box
- 2.4. Other
Egg Transport Box Segmentation By Geography
-
1. North America
- 1.1. United States
- 1.2. Canada
- 1.3. Mexico
-
2. South America
- 2.1. Brazil
- 2.2. Argentina
- 2.3. Rest of South America
-
3. Europe
- 3.1. United Kingdom
- 3.2. Germany
- 3.3. France
- 3.4. Italy
- 3.5. Spain
- 3.6. Russia
- 3.7. Benelux
- 3.8. Nordics
- 3.9. Rest of Europe
-
4. Middle East & Africa
- 4.1. Turkey
- 4.2. Israel
- 4.3. GCC
- 4.4. North Africa
- 4.5. South Africa
- 4.6. Rest of Middle East & Africa
-
5. Asia Pacific
- 5.1. China
- 5.2. India
- 5.3. Japan
- 5.4. South Korea
- 5.5. ASEAN
- 5.6. Oceania
- 5.7. Rest of Asia Pacific
Egg Transport Box Regional Market Share
Geographic Coverage of Egg Transport Box
Egg Transport Box REPORT HIGHLIGHTS
| Aspects | Details |
|---|---|
| Study Period | 2020-2034 |
| Base Year | 2025 |
| Estimated Year | 2026 |
| Forecast Period | 2026-2034 |
| Historical Period | 2020-2025 |
| Growth Rate | CAGR of 6.3% from 2020-2034 |
| Segmentation |
|
Table of Contents
- 1. Introduction
- 1.1. Research Scope
- 1.2. Market Segmentation
- 1.3. Research Methodology
- 1.4. Definitions and Assumptions
- 2. Executive Summary
- 2.1. Introduction
- 3. Market Dynamics
- 3.1. Introduction
- 3.2. Market Drivers
- 3.3. Market Restrains
- 3.4. Market Trends
- 4. Market Factor Analysis
- 4.1. Porters Five Forces
- 4.2. Supply/Value Chain
- 4.3. PESTEL analysis
- 4.4. Market Entropy
- 4.5. Patent/Trademark Analysis
- 5. Global Egg Transport Box Analysis, Insights and Forecast, 2020-2032
- 5.1. Market Analysis, Insights and Forecast - by Application
- 5.1.1. Transportation and Logistics
- 5.1.2. Egg Packing Station
- 5.1.3. Other
- 5.2. Market Analysis, Insights and Forecast - by Types
- 5.2.1. Paper Box
- 5.2.2. Plastic Box
- 5.2.3. Polystyrene Box
- 5.2.4. Other
- 5.3. Market Analysis, Insights and Forecast - by Region
- 5.3.1. North America
- 5.3.2. South America
- 5.3.3. Europe
- 5.3.4. Middle East & Africa
- 5.3.5. Asia Pacific
- 5.1. Market Analysis, Insights and Forecast - by Application
- 6. North America Egg Transport Box Analysis, Insights and Forecast, 2020-2032
- 6.1. Market Analysis, Insights and Forecast - by Application
- 6.1.1. Transportation and Logistics
- 6.1.2. Egg Packing Station
- 6.1.3. Other
- 6.2. Market Analysis, Insights and Forecast - by Types
- 6.2.1. Paper Box
- 6.2.2. Plastic Box
- 6.2.3. Polystyrene Box
- 6.2.4. Other
- 6.1. Market Analysis, Insights and Forecast - by Application
- 7. South America Egg Transport Box Analysis, Insights and Forecast, 2020-2032
- 7.1. Market Analysis, Insights and Forecast - by Application
- 7.1.1. Transportation and Logistics
- 7.1.2. Egg Packing Station
- 7.1.3. Other
- 7.2. Market Analysis, Insights and Forecast - by Types
- 7.2.1. Paper Box
- 7.2.2. Plastic Box
- 7.2.3. Polystyrene Box
- 7.2.4. Other
- 7.1. Market Analysis, Insights and Forecast - by Application
- 8. Europe Egg Transport Box Analysis, Insights and Forecast, 2020-2032
- 8.1. Market Analysis, Insights and Forecast - by Application
- 8.1.1. Transportation and Logistics
- 8.1.2. Egg Packing Station
- 8.1.3. Other
- 8.2. Market Analysis, Insights and Forecast - by Types
- 8.2.1. Paper Box
- 8.2.2. Plastic Box
- 8.2.3. Polystyrene Box
- 8.2.4. Other
- 8.1. Market Analysis, Insights and Forecast - by Application
- 9. Middle East & Africa Egg Transport Box Analysis, Insights and Forecast, 2020-2032
- 9.1. Market Analysis, Insights and Forecast - by Application
- 9.1.1. Transportation and Logistics
- 9.1.2. Egg Packing Station
- 9.1.3. Other
- 9.2. Market Analysis, Insights and Forecast - by Types
- 9.2.1. Paper Box
- 9.2.2. Plastic Box
- 9.2.3. Polystyrene Box
- 9.2.4. Other
- 9.1. Market Analysis, Insights and Forecast - by Application
- 10. Asia Pacific Egg Transport Box Analysis, Insights and Forecast, 2020-2032
- 10.1. Market Analysis, Insights and Forecast - by Application
- 10.1.1. Transportation and Logistics
- 10.1.2. Egg Packing Station
- 10.1.3. Other
- 10.2. Market Analysis, Insights and Forecast - by Types
- 10.2.1. Paper Box
- 10.2.2. Plastic Box
- 10.2.3. Polystyrene Box
- 10.2.4. Other
- 10.1. Market Analysis, Insights and Forecast - by Application
- 11. Competitive Analysis
- 11.1. Global Market Share Analysis 2025
- 11.2. Company Profiles
- 11.2.1 BEST
- 11.2.1.1. Overview
- 11.2.1.2. Products
- 11.2.1.3. SWOT Analysis
- 11.2.1.4. Recent Developments
- 11.2.1.5. Financials (Based on Availability)
- 11.2.2 HatchTech B.V.
- 11.2.2.1. Overview
- 11.2.2.2. Products
- 11.2.2.3. SWOT Analysis
- 11.2.2.4. Recent Developments
- 11.2.2.5. Financials (Based on Availability)
- 11.2.3 Phoenix Breeding Equipment
- 11.2.3.1. Overview
- 11.2.3.2. Products
- 11.2.3.3. SWOT Analysis
- 11.2.3.4. Recent Developments
- 11.2.3.5. Financials (Based on Availability)
- 11.2.4 Carfed
- 11.2.4.1. Overview
- 11.2.4.2. Products
- 11.2.4.3. SWOT Analysis
- 11.2.4.4. Recent Developments
- 11.2.4.5. Financials (Based on Availability)
- 11.2.5 Hartmann
- 11.2.5.1. Overview
- 11.2.5.2. Products
- 11.2.5.3. SWOT Analysis
- 11.2.5.4. Recent Developments
- 11.2.5.5. Financials (Based on Availability)
- 11.2.6 Huhtamaki
- 11.2.6.1. Overview
- 11.2.6.2. Products
- 11.2.6.3. SWOT Analysis
- 11.2.6.4. Recent Developments
- 11.2.6.5. Financials (Based on Availability)
- 11.2.7 CKF
- 11.2.7.1. Overview
- 11.2.7.2. Products
- 11.2.7.3. SWOT Analysis
- 11.2.7.4. Recent Developments
- 11.2.7.5. Financials (Based on Availability)
- 11.2.8 HOLLANDIA
- 11.2.8.1. Overview
- 11.2.8.2. Products
- 11.2.8.3. SWOT Analysis
- 11.2.8.4. Recent Developments
- 11.2.8.5. Financials (Based on Availability)
- 11.2.9 Pactiv Evergreen
- 11.2.9.1. Overview
- 11.2.9.2. Products
- 11.2.9.3. SWOT Analysis
- 11.2.9.4. Recent Developments
- 11.2.9.5. Financials (Based on Availability)
- 11.2.10 PulPac
- 11.2.10.1. Overview
- 11.2.10.2. Products
- 11.2.10.3. SWOT Analysis
- 11.2.10.4. Recent Developments
- 11.2.10.5. Financials (Based on Availability)
- 11.2.11 Cellulose de la Loire
- 11.2.11.1. Overview
- 11.2.11.2. Products
- 11.2.11.3. SWOT Analysis
- 11.2.11.4. Recent Developments
- 11.2.11.5. Financials (Based on Availability)
- 11.2.12 GI-OVO
- 11.2.12.1. Overview
- 11.2.12.2. Products
- 11.2.12.3. SWOT Analysis
- 11.2.12.4. Recent Developments
- 11.2.12.5. Financials (Based on Availability)
- 11.2.13 Smurfit Kappa
- 11.2.13.1. Overview
- 11.2.13.2. Products
- 11.2.13.3. SWOT Analysis
- 11.2.13.4. Recent Developments
- 11.2.13.5. Financials (Based on Availability)
- 11.2.1 BEST
List of Figures
- Figure 1: Global Egg Transport Box Revenue Breakdown (billion, %) by Region 2025 & 2033
- Figure 2: Global Egg Transport Box Volume Breakdown (K, %) by Region 2025 & 2033
- Figure 3: North America Egg Transport Box Revenue (billion), by Application 2025 & 2033
- Figure 4: North America Egg Transport Box Volume (K), by Application 2025 & 2033
- Figure 5: North America Egg Transport Box Revenue Share (%), by Application 2025 & 2033
- Figure 6: North America Egg Transport Box Volume Share (%), by Application 2025 & 2033
- Figure 7: North America Egg Transport Box Revenue (billion), by Types 2025 & 2033
- Figure 8: North America Egg Transport Box Volume (K), by Types 2025 & 2033
- Figure 9: North America Egg Transport Box Revenue Share (%), by Types 2025 & 2033
- Figure 10: North America Egg Transport Box Volume Share (%), by Types 2025 & 2033
- Figure 11: North America Egg Transport Box Revenue (billion), by Country 2025 & 2033
- Figure 12: North America Egg Transport Box Volume (K), by Country 2025 & 2033
- Figure 13: North America Egg Transport Box Revenue Share (%), by Country 2025 & 2033
- Figure 14: North America Egg Transport Box Volume Share (%), by Country 2025 & 2033
- Figure 15: South America Egg Transport Box Revenue (billion), by Application 2025 & 2033
- Figure 16: South America Egg Transport Box Volume (K), by Application 2025 & 2033
- Figure 17: South America Egg Transport Box Revenue Share (%), by Application 2025 & 2033
- Figure 18: South America Egg Transport Box Volume Share (%), by Application 2025 & 2033
- Figure 19: South America Egg Transport Box Revenue (billion), by Types 2025 & 2033
- Figure 20: South America Egg Transport Box Volume (K), by Types 2025 & 2033
- Figure 21: South America Egg Transport Box Revenue Share (%), by Types 2025 & 2033
- Figure 22: South America Egg Transport Box Volume Share (%), by Types 2025 & 2033
- Figure 23: South America Egg Transport Box Revenue (billion), by Country 2025 & 2033
- Figure 24: South America Egg Transport Box Volume (K), by Country 2025 & 2033
- Figure 25: South America Egg Transport Box Revenue Share (%), by Country 2025 & 2033
- Figure 26: South America Egg Transport Box Volume Share (%), by Country 2025 & 2033
- Figure 27: Europe Egg Transport Box Revenue (billion), by Application 2025 & 2033
- Figure 28: Europe Egg Transport Box Volume (K), by Application 2025 & 2033
- Figure 29: Europe Egg Transport Box Revenue Share (%), by Application 2025 & 2033
- Figure 30: Europe Egg Transport Box Volume Share (%), by Application 2025 & 2033
- Figure 31: Europe Egg Transport Box Revenue (billion), by Types 2025 & 2033
- Figure 32: Europe Egg Transport Box Volume (K), by Types 2025 & 2033
- Figure 33: Europe Egg Transport Box Revenue Share (%), by Types 2025 & 2033
- Figure 34: Europe Egg Transport Box Volume Share (%), by Types 2025 & 2033
- Figure 35: Europe Egg Transport Box Revenue (billion), by Country 2025 & 2033
- Figure 36: Europe Egg Transport Box Volume (K), by Country 2025 & 2033
- Figure 37: Europe Egg Transport Box Revenue Share (%), by Country 2025 & 2033
- Figure 38: Europe Egg Transport Box Volume Share (%), by Country 2025 & 2033
- Figure 39: Middle East & Africa Egg Transport Box Revenue (billion), by Application 2025 & 2033
- Figure 40: Middle East & Africa Egg Transport Box Volume (K), by Application 2025 & 2033
- Figure 41: Middle East & Africa Egg Transport Box Revenue Share (%), by Application 2025 & 2033
- Figure 42: Middle East & Africa Egg Transport Box Volume Share (%), by Application 2025 & 2033
- Figure 43: Middle East & Africa Egg Transport Box Revenue (billion), by Types 2025 & 2033
- Figure 44: Middle East & Africa Egg Transport Box Volume (K), by Types 2025 & 2033
- Figure 45: Middle East & Africa Egg Transport Box Revenue Share (%), by Types 2025 & 2033
- Figure 46: Middle East & Africa Egg Transport Box Volume Share (%), by Types 2025 & 2033
- Figure 47: Middle East & Africa Egg Transport Box Revenue (billion), by Country 2025 & 2033
- Figure 48: Middle East & Africa Egg Transport Box Volume (K), by Country 2025 & 2033
- Figure 49: Middle East & Africa Egg Transport Box Revenue Share (%), by Country 2025 & 2033
- Figure 50: Middle East & Africa Egg Transport Box Volume Share (%), by Country 2025 & 2033
- Figure 51: Asia Pacific Egg Transport Box Revenue (billion), by Application 2025 & 2033
- Figure 52: Asia Pacific Egg Transport Box Volume (K), by Application 2025 & 2033
- Figure 53: Asia Pacific Egg Transport Box Revenue Share (%), by Application 2025 & 2033
- Figure 54: Asia Pacific Egg Transport Box Volume Share (%), by Application 2025 & 2033
- Figure 55: Asia Pacific Egg Transport Box Revenue (billion), by Types 2025 & 2033
- Figure 56: Asia Pacific Egg Transport Box Volume (K), by Types 2025 & 2033
- Figure 57: Asia Pacific Egg Transport Box Revenue Share (%), by Types 2025 & 2033
- Figure 58: Asia Pacific Egg Transport Box Volume Share (%), by Types 2025 & 2033
- Figure 59: Asia Pacific Egg Transport Box Revenue (billion), by Country 2025 & 2033
- Figure 60: Asia Pacific Egg Transport Box Volume (K), by Country 2025 & 2033
- Figure 61: Asia Pacific Egg Transport Box Revenue Share (%), by Country 2025 & 2033
- Figure 62: Asia Pacific Egg Transport Box Volume Share (%), by Country 2025 & 2033
List of Tables
- Table 1: Global Egg Transport Box Revenue billion Forecast, by Application 2020 & 2033
- Table 2: Global Egg Transport Box Volume K Forecast, by Application 2020 & 2033
- Table 3: Global Egg Transport Box Revenue billion Forecast, by Types 2020 & 2033
- Table 4: Global Egg Transport Box Volume K Forecast, by Types 2020 & 2033
- Table 5: Global Egg Transport Box Revenue billion Forecast, by Region 2020 & 2033
- Table 6: Global Egg Transport Box Volume K Forecast, by Region 2020 & 2033
- Table 7: Global Egg Transport Box Revenue billion Forecast, by Application 2020 & 2033
- Table 8: Global Egg Transport Box Volume K Forecast, by Application 2020 & 2033
- Table 9: Global Egg Transport Box Revenue billion Forecast, by Types 2020 & 2033
- Table 10: Global Egg Transport Box Volume K Forecast, by Types 2020 & 2033
- Table 11: Global Egg Transport Box Revenue billion Forecast, by Country 2020 & 2033
- Table 12: Global Egg Transport Box Volume K Forecast, by Country 2020 & 2033
- Table 13: United States Egg Transport Box Revenue (billion) Forecast, by Application 2020 & 2033
- Table 14: United States Egg Transport Box Volume (K) Forecast, by Application 2020 & 2033
- Table 15: Canada Egg Transport Box Revenue (billion) Forecast, by Application 2020 & 2033
- Table 16: Canada Egg Transport Box Volume (K) Forecast, by Application 2020 & 2033
- Table 17: Mexico Egg Transport Box Revenue (billion) Forecast, by Application 2020 & 2033
- Table 18: Mexico Egg Transport Box Volume (K) Forecast, by Application 2020 & 2033
- Table 19: Global Egg Transport Box Revenue billion Forecast, by Application 2020 & 2033
- Table 20: Global Egg Transport Box Volume K Forecast, by Application 2020 & 2033
- Table 21: Global Egg Transport Box Revenue billion Forecast, by Types 2020 & 2033
- Table 22: Global Egg Transport Box Volume K Forecast, by Types 2020 & 2033
- Table 23: Global Egg Transport Box Revenue billion Forecast, by Country 2020 & 2033
- Table 24: Global Egg Transport Box Volume K Forecast, by Country 2020 & 2033
- Table 25: Brazil Egg Transport Box Revenue (billion) Forecast, by Application 2020 & 2033
- Table 26: Brazil Egg Transport Box Volume (K) Forecast, by Application 2020 & 2033
- Table 27: Argentina Egg Transport Box Revenue (billion) Forecast, by Application 2020 & 2033
- Table 28: Argentina Egg Transport Box Volume (K) Forecast, by Application 2020 & 2033
- Table 29: Rest of South America Egg Transport Box Revenue (billion) Forecast, by Application 2020 & 2033
- Table 30: Rest of South America Egg Transport Box Volume (K) Forecast, by Application 2020 & 2033
- Table 31: Global Egg Transport Box Revenue billion Forecast, by Application 2020 & 2033
- Table 32: Global Egg Transport Box Volume K Forecast, by Application 2020 & 2033
- Table 33: Global Egg Transport Box Revenue billion Forecast, by Types 2020 & 2033
- Table 34: Global Egg Transport Box Volume K Forecast, by Types 2020 & 2033
- Table 35: Global Egg Transport Box Revenue billion Forecast, by Country 2020 & 2033
- Table 36: Global Egg Transport Box Volume K Forecast, by Country 2020 & 2033
- Table 37: United Kingdom Egg Transport Box Revenue (billion) Forecast, by Application 2020 & 2033
- Table 38: United Kingdom Egg Transport Box Volume (K) Forecast, by Application 2020 & 2033
- Table 39: Germany Egg Transport Box Revenue (billion) Forecast, by Application 2020 & 2033
- Table 40: Germany Egg Transport Box Volume (K) Forecast, by Application 2020 & 2033
- Table 41: France Egg Transport Box Revenue (billion) Forecast, by Application 2020 & 2033
- Table 42: France Egg Transport Box Volume (K) Forecast, by Application 2020 & 2033
- Table 43: Italy Egg Transport Box Revenue (billion) Forecast, by Application 2020 & 2033
- Table 44: Italy Egg Transport Box Volume (K) Forecast, by Application 2020 & 2033
- Table 45: Spain Egg Transport Box Revenue (billion) Forecast, by Application 2020 & 2033
- Table 46: Spain Egg Transport Box Volume (K) Forecast, by Application 2020 & 2033
- Table 47: Russia Egg Transport Box Revenue (billion) Forecast, by Application 2020 & 2033
- Table 48: Russia Egg Transport Box Volume (K) Forecast, by Application 2020 & 2033
- Table 49: Benelux Egg Transport Box Revenue (billion) Forecast, by Application 2020 & 2033
- Table 50: Benelux Egg Transport Box Volume (K) Forecast, by Application 2020 & 2033
- Table 51: Nordics Egg Transport Box Revenue (billion) Forecast, by Application 2020 & 2033
- Table 52: Nordics Egg Transport Box Volume (K) Forecast, by Application 2020 & 2033
- Table 53: Rest of Europe Egg Transport Box Revenue (billion) Forecast, by Application 2020 & 2033
- Table 54: Rest of Europe Egg Transport Box Volume (K) Forecast, by Application 2020 & 2033
- Table 55: Global Egg Transport Box Revenue billion Forecast, by Application 2020 & 2033
- Table 56: Global Egg Transport Box Volume K Forecast, by Application 2020 & 2033
- Table 57: Global Egg Transport Box Revenue billion Forecast, by Types 2020 & 2033
- Table 58: Global Egg Transport Box Volume K Forecast, by Types 2020 & 2033
- Table 59: Global Egg Transport Box Revenue billion Forecast, by Country 2020 & 2033
- Table 60: Global Egg Transport Box Volume K Forecast, by Country 2020 & 2033
- Table 61: Turkey Egg Transport Box Revenue (billion) Forecast, by Application 2020 & 2033
- Table 62: Turkey Egg Transport Box Volume (K) Forecast, by Application 2020 & 2033
- Table 63: Israel Egg Transport Box Revenue (billion) Forecast, by Application 2020 & 2033
- Table 64: Israel Egg Transport Box Volume (K) Forecast, by Application 2020 & 2033
- Table 65: GCC Egg Transport Box Revenue (billion) Forecast, by Application 2020 & 2033
- Table 66: GCC Egg Transport Box Volume (K) Forecast, by Application 2020 & 2033
- Table 67: North Africa Egg Transport Box Revenue (billion) Forecast, by Application 2020 & 2033
- Table 68: North Africa Egg Transport Box Volume (K) Forecast, by Application 2020 & 2033
- Table 69: South Africa Egg Transport Box Revenue (billion) Forecast, by Application 2020 & 2033
- Table 70: South Africa Egg Transport Box Volume (K) Forecast, by Application 2020 & 2033
- Table 71: Rest of Middle East & Africa Egg Transport Box Revenue (billion) Forecast, by Application 2020 & 2033
- Table 72: Rest of Middle East & Africa Egg Transport Box Volume (K) Forecast, by Application 2020 & 2033
- Table 73: Global Egg Transport Box Revenue billion Forecast, by Application 2020 & 2033
- Table 74: Global Egg Transport Box Volume K Forecast, by Application 2020 & 2033
- Table 75: Global Egg Transport Box Revenue billion Forecast, by Types 2020 & 2033
- Table 76: Global Egg Transport Box Volume K Forecast, by Types 2020 & 2033
- Table 77: Global Egg Transport Box Revenue billion Forecast, by Country 2020 & 2033
- Table 78: Global Egg Transport Box Volume K Forecast, by Country 2020 & 2033
- Table 79: China Egg Transport Box Revenue (billion) Forecast, by Application 2020 & 2033
- Table 80: China Egg Transport Box Volume (K) Forecast, by Application 2020 & 2033
- Table 81: India Egg Transport Box Revenue (billion) Forecast, by Application 2020 & 2033
- Table 82: India Egg Transport Box Volume (K) Forecast, by Application 2020 & 2033
- Table 83: Japan Egg Transport Box Revenue (billion) Forecast, by Application 2020 & 2033
- Table 84: Japan Egg Transport Box Volume (K) Forecast, by Application 2020 & 2033
- Table 85: South Korea Egg Transport Box Revenue (billion) Forecast, by Application 2020 & 2033
- Table 86: South Korea Egg Transport Box Volume (K) Forecast, by Application 2020 & 2033
- Table 87: ASEAN Egg Transport Box Revenue (billion) Forecast, by Application 2020 & 2033
- Table 88: ASEAN Egg Transport Box Volume (K) Forecast, by Application 2020 & 2033
- Table 89: Oceania Egg Transport Box Revenue (billion) Forecast, by Application 2020 & 2033
- Table 90: Oceania Egg Transport Box Volume (K) Forecast, by Application 2020 & 2033
- Table 91: Rest of Asia Pacific Egg Transport Box Revenue (billion) Forecast, by Application 2020 & 2033
- Table 92: Rest of Asia Pacific Egg Transport Box Volume (K) Forecast, by Application 2020 & 2033
Frequently Asked Questions
1. What is the projected Compound Annual Growth Rate (CAGR) of the Egg Transport Box?
The projected CAGR is approximately 6.3%.
2. Which companies are prominent players in the Egg Transport Box?
Key companies in the market include BEST, HatchTech B.V., Phoenix Breeding Equipment, Carfed, Hartmann, Huhtamaki, CKF, HOLLANDIA, Pactiv Evergreen, PulPac, Cellulose de la Loire, GI-OVO, Smurfit Kappa.
3. What are the main segments of the Egg Transport Box?
The market segments include Application, Types.
4. Can you provide details about the market size?
The market size is estimated to be USD 7.75 billion as of 2022.
5. What are some drivers contributing to market growth?
N/A
6. What are the notable trends driving market growth?
N/A
7. Are there any restraints impacting market growth?
N/A
8. Can you provide examples of recent developments in the market?
N/A
9. What pricing options are available for accessing the report?
Pricing options include single-user, multi-user, and enterprise licenses priced at USD 3950.00, USD 5925.00, and USD 7900.00 respectively.
10. Is the market size provided in terms of value or volume?
The market size is provided in terms of value, measured in billion and volume, measured in K.
11. Are there any specific market keywords associated with the report?
Yes, the market keyword associated with the report is "Egg Transport Box," which aids in identifying and referencing the specific market segment covered.
12. How do I determine which pricing option suits my needs best?
The pricing options vary based on user requirements and access needs. Individual users may opt for single-user licenses, while businesses requiring broader access may choose multi-user or enterprise licenses for cost-effective access to the report.
13. Are there any additional resources or data provided in the Egg Transport Box report?
While the report offers comprehensive insights, it's advisable to review the specific contents or supplementary materials provided to ascertain if additional resources or data are available.
14. How can I stay updated on further developments or reports in the Egg Transport Box?
To stay informed about further developments, trends, and reports in the Egg Transport Box, consider subscribing to industry newsletters, following relevant companies and organizations, or regularly checking reputable industry news sources and publications.
Methodology
Step 1 - Identification of Relevant Samples Size from Population Database


Step 2 - Approaches for Defining Global Market Size (Value, Volume* & Price*)

Note*: In applicable scenarios
Step 3 - Data Sources
Primary Research
- Web Analytics
- Survey Reports
- Research Institute
- Latest Research Reports
- Opinion Leaders
Secondary Research
- Annual Reports
- White Paper
- Latest Press Release
- Industry Association
- Paid Database
- Investor Presentations

Step 4 - Data Triangulation
Involves using different sources of information in order to increase the validity of a study
These sources are likely to be stakeholders in a program - participants, other researchers, program staff, other community members, and so on.
Then we put all data in single framework & apply various statistical tools to find out the dynamic on the market.
During the analysis stage, feedback from the stakeholder groups would be compared to determine areas of agreement as well as areas of divergence