

Key Insights
The global gas generator market is poised for substantial expansion, driven by escalating electricity demands and the imperative for reliable power in regions with inconsistent grid access. This market is projected to grow at a Compound Annual Growth Rate (CAGR) of 4.1%. The market size is estimated at $28.5 billion in the base year of 2025. Key growth catalysts include industrial expansion, increasing urbanization, and the rising need for backup power in commercial and residential applications. Furthermore, stricter emission standards are steering demand towards cleaner alternatives like natural gas, positioning it favorably against diesel generators. Industrial end-users constitute the largest market segment, followed by commercial and residential sectors. The 75-375 kVA power rating segment dominates, catering to prevalent application requirements. North America and Europe currently lead the market, with the Asia-Pacific region anticipated to exhibit robust growth due to rapid economic development and infrastructure investments in key economies such as China and India. Potential challenges include volatile natural gas prices and stringent environmental regulations. Leading manufacturers, including Cummins, Caterpillar, Generac, and Kohler, are focusing on technological advancements, emphasizing fuel efficiency and emission reduction to secure market positions.
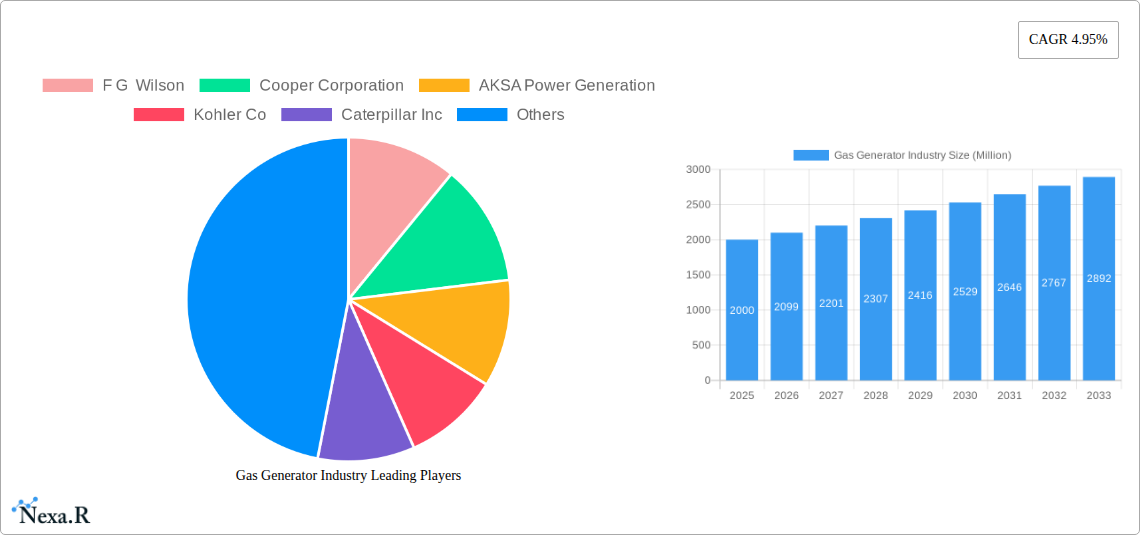
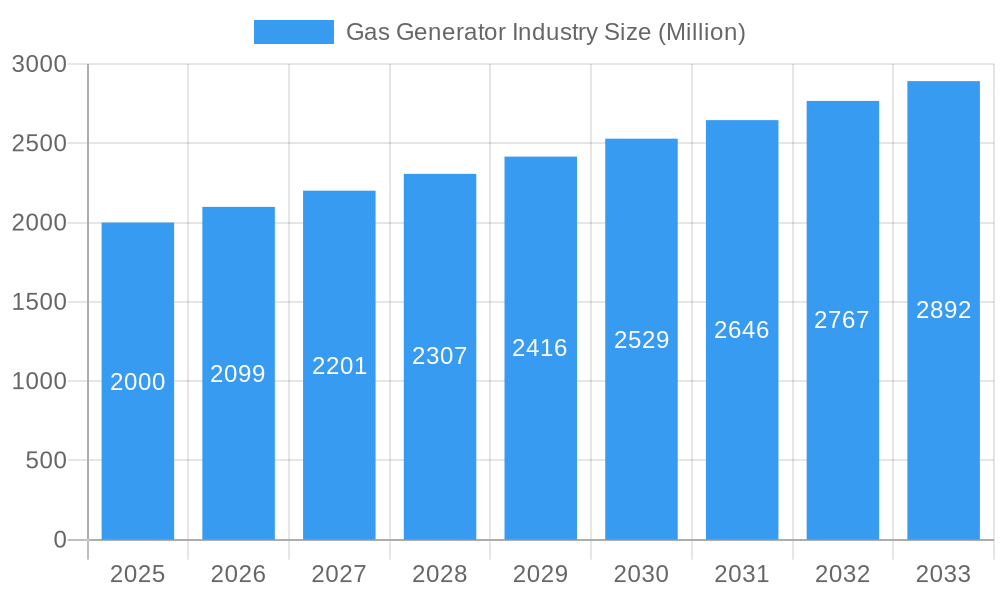
Gas Generator Industry Market Size (In Billion)
The competitive environment features both established industry leaders and emerging companies striving for market leadership. Strategic initiatives such as mergers, acquisitions, strategic alliances, and innovative product development are prevalent. The forecast period, from 2025 to 2033, indicates sustained market growth, with the industrial sector expected to continue as a primary revenue contributor. Despite existing challenges, the long-term market outlook remains optimistic, driven by the increasing global demand for dependable and eco-friendlier power generation solutions. Market participants must remain agile to navigate evolving regulatory frameworks and shifting consumer preferences to maintain a competitive advantage. The persistent demand for energy security, particularly in developing economies, will fuel the market's sustained upward trajectory.
Gas Generator Industry Company Market Share
Gas Generator Industry Market Report: 2019-2033
This comprehensive report provides a detailed analysis of the global gas generator industry, covering market dynamics, growth trends, regional performance, product landscape, and key players. The report utilizes data from 2019-2024 (historical period), estimates for 2025 (base and estimated year), and projects the market outlook through 2033 (forecast period). It segments the market by end-user (Industrial, Commercial, Residential) and power rating (Less than 75 kVA, 75-375 kVA, Above 375 kVA), offering granular insights for industry professionals. The market size is presented in million units.
Gas Generator Industry Market Dynamics & Structure
The gas generator market is characterized by moderate concentration, with several major players commanding significant market share. Technological innovation, driven by the need for increased efficiency and reduced emissions, is a key market driver. Stringent environmental regulations worldwide are shaping product development and adoption patterns. Competitive pressure from renewable energy sources, particularly solar and wind power, presents a significant challenge. The market also witnesses consistent M&A activity, with larger companies consolidating their position through acquisitions of smaller players. End-user demographics are shifting, with increasing demand from emerging economies and a growing focus on industrial applications.
- Market Concentration: Moderately concentrated, with top 5 players holding approximately xx% market share in 2024.
- Technological Innovation: Focus on efficiency improvements, emission reduction technologies, and digitalization.
- Regulatory Framework: Stringent emission standards and safety regulations vary across regions.
- Competitive Substitutes: Renewable energy sources (solar, wind), grid-tied power systems.
- End-User Demographics: Shifting towards larger industrial and commercial sectors in developing economies.
- M&A Trends: Consolidation through acquisitions of smaller, specialized companies; xx M&A deals observed from 2019-2024.
Gas Generator Industry Growth Trends & Insights
The global gas generator market experienced steady growth from 2019 to 2024, driven by increasing energy demand, infrastructure development in emerging markets, and the need for reliable backup power. Adoption rates have been particularly high in regions with unstable electricity grids. Technological advancements, such as the incorporation of smart features and improved fuel efficiency, have further boosted market growth. However, the fluctuating prices of natural gas and the rise of renewable energy have impacted the market's trajectory. We project a compound annual growth rate (CAGR) of xx% from 2025 to 2033, with market penetration expected to reach xx% by 2033. Consumer behavior is shifting towards environmentally friendly solutions and digitally enabled remote monitoring capabilities. This is prompting manufacturers to develop sustainable and smart gas generators. The market is also witnessing increasing adoption of gas generators in distributed generation systems, offering decentralized and efficient power solutions.
Dominant Regions, Countries, or Segments in Gas Generator Industry
The North American market currently holds the largest market share, driven by robust industrial activity and a strong emphasis on backup power solutions. Asia-Pacific is expected to demonstrate significant growth during the forecast period, fueled by rapid industrialization and urbanization. Within segments, the industrial sector continues to dominate, followed by the commercial sector. In terms of power rating, the 75-375 kVA segment displays the highest growth potential.
- Key Drivers for North America: Robust industrial sector, stringent regulatory framework, high adoption of standby power systems.
- Key Drivers for Asia-Pacific: Rapid industrialization, urbanization, expanding infrastructure projects.
- Dominant End-User Segment: Industrial (xx% market share in 2024) due to high energy demand.
- Dominant Power Rating Segment: 75-375 kVA (xx% market share in 2024) due to its versatility.
Gas Generator Industry Product Landscape
Gas generator technology is continuously evolving, incorporating advanced features like improved fuel efficiency, reduced emissions, and smart monitoring systems. These advancements cater to the increasing demand for reliable, environmentally friendly, and cost-effective power solutions. Manufacturers are focusing on developing compact, user-friendly designs and integrating digital technologies for remote monitoring and maintenance. Unique selling propositions include enhanced performance, durability, and lower lifecycle costs. The industry is also investing in fuel flexibility to offer solutions compatible with various gas types.
Key Drivers, Barriers & Challenges in Gas Generator Industry
Key Drivers: Increasing energy demand, infrastructure development in emerging economies, need for reliable backup power, stringent environmental regulations driving adoption of cleaner technologies.
Key Challenges: Fluctuating natural gas prices, competition from renewable energy sources, stringent emission regulations, and supply chain disruptions (estimated xx% impact on production in 2024).
Emerging Opportunities in Gas Generator Industry
Emerging opportunities include expansion into untapped markets (e.g., remote areas with limited grid access), development of hybrid systems integrating renewable energy sources, and focus on developing efficient, low-emission gas generators utilizing advanced combustion technologies and alternative fuels. The growth of data centers also presents a major opportunity, demanding reliable backup power.
Growth Accelerators in the Gas Generator Industry
The long-term growth of the gas generator industry will be fueled by technological advancements, strategic partnerships between manufacturers and energy providers, and expansion into new geographic markets. Furthermore, the integration of smart technologies, improved fuel efficiency, and the increasing adoption of natural gas as a cleaner fuel source will continue to drive market expansion.
Key Players Shaping the Gas Generator Industry Market
- F G Wilson
- Cooper Corporation
- AKSA Power Generation
- Kohler Co
- Caterpillar Inc
- Cummins Inc
- General Electric Company
- Generac Holdings Inc
- MTU America Inc
- Mitsubishi Heavy Industries Ltd
Notable Milestones in Gas Generator Industry Sector
- February 2023: Cummins Inc. announced new 175kW and 200kW natural gas generator sets, highlighting commitment to sustainable technologies.
- July 2022: Sterling Generators partnered with Moteurs Baudouin, expanding its product portfolio and enhancing efficiency.
- January 2022: Caterpillar Inc. unveiled the Cat G3516 Fast Reaction generator set, expanding its natural gas power solutions.
In-Depth Gas Generator Industry Market Outlook
The gas generator market is poised for continued growth, driven by technological innovations focused on sustainability and efficiency. Strategic partnerships and expansion into new markets, particularly in developing economies, will play a crucial role in shaping the future market landscape. The integration of digital technologies will enable better monitoring, predictive maintenance, and optimized performance, further enhancing the appeal of gas generator solutions. The industry's focus on reducing environmental impact presents both challenges and significant opportunities for growth.
Gas Generator Industry Segmentation
-
1. Power Rating
- 1.1. Less than 75 kVA
- 1.2. 75-375 kVA
- 1.3. Above 375 kVA
-
2. End-User
- 2.1. Industrial
- 2.2. Commercial
- 2.3. Residential
Gas Generator Industry Segmentation By Geography
-
1. North America
- 1.1. United States
- 1.2. Canada
- 1.3. Rest of North America
-
2. Europe
- 2.1. Germany
- 2.2. France
- 2.3. United Kingdom
- 2.4. Rest of Europe
-
3. Asia Pacific
- 3.1. China
- 3.2. India
- 3.3. Japan
- 3.4. South Korea
- 3.5. Rest of Asia Pacific
-
4. South America
- 4.1. Brazil
- 4.2. Argentina
- 4.3. Rest of South America
-
5. Middle East and Africa
- 5.1. Saudi Arabia
- 5.2. United Arab Emirates
- 5.3. South Africa
- 5.4. Rest of Middle East and Africa

Gas Generator Industry Regional Market Share
Geographic Coverage of Gas Generator Industry
Gas Generator Industry REPORT HIGHLIGHTS
| Aspects | Details |
|---|---|
| Study Period | 2020-2034 |
| Base Year | 2025 |
| Estimated Year | 2026 |
| Forecast Period | 2026-2034 |
| Historical Period | 2020-2025 |
| Growth Rate | CAGR of 4.1% from 2020-2034 |
| Segmentation |
|
Table of Contents
- 1. Introduction
- 1.1. Research Scope
- 1.2. Market Segmentation
- 1.3. Research Methodology
- 1.4. Definitions and Assumptions
- 2. Executive Summary
- 2.1. Introduction
- 3. Market Dynamics
- 3.1. Introduction
- 3.2. Market Drivers
- 3.2.1. Increasing Awareness Regarding Natural Gas as a Clean and Reliable Fuel4.; Increasing Concerns Over Diesel Maintenance and Refueling Issues
- 3.3. Market Restrains
- 3.3.1 Lack of Gas Grid Connectivity Via Pipeline
- 3.3.2 Resulting in Hindered Fuel Supply
- 3.4. Market Trends
- 3.4.1. Below 75 kVA Capacity Rating to Dominate the Market
- 4. Market Factor Analysis
- 4.1. Porters Five Forces
- 4.2. Supply/Value Chain
- 4.3. PESTEL analysis
- 4.4. Market Entropy
- 4.5. Patent/Trademark Analysis
- 5. Global Gas Generator Industry Analysis, Insights and Forecast, 2020-2032
- 5.1. Market Analysis, Insights and Forecast - by Power Rating
- 5.1.1. Less than 75 kVA
- 5.1.2. 75-375 kVA
- 5.1.3. Above 375 kVA
- 5.2. Market Analysis, Insights and Forecast - by End-User
- 5.2.1. Industrial
- 5.2.2. Commercial
- 5.2.3. Residential
- 5.3. Market Analysis, Insights and Forecast - by Region
- 5.3.1. North America
- 5.3.2. Europe
- 5.3.3. Asia Pacific
- 5.3.4. South America
- 5.3.5. Middle East and Africa
- 5.1. Market Analysis, Insights and Forecast - by Power Rating
- 6. North America Gas Generator Industry Analysis, Insights and Forecast, 2020-2032
- 6.1. Market Analysis, Insights and Forecast - by Power Rating
- 6.1.1. Less than 75 kVA
- 6.1.2. 75-375 kVA
- 6.1.3. Above 375 kVA
- 6.2. Market Analysis, Insights and Forecast - by End-User
- 6.2.1. Industrial
- 6.2.2. Commercial
- 6.2.3. Residential
- 6.1. Market Analysis, Insights and Forecast - by Power Rating
- 7. Europe Gas Generator Industry Analysis, Insights and Forecast, 2020-2032
- 7.1. Market Analysis, Insights and Forecast - by Power Rating
- 7.1.1. Less than 75 kVA
- 7.1.2. 75-375 kVA
- 7.1.3. Above 375 kVA
- 7.2. Market Analysis, Insights and Forecast - by End-User
- 7.2.1. Industrial
- 7.2.2. Commercial
- 7.2.3. Residential
- 7.1. Market Analysis, Insights and Forecast - by Power Rating
- 8. Asia Pacific Gas Generator Industry Analysis, Insights and Forecast, 2020-2032
- 8.1. Market Analysis, Insights and Forecast - by Power Rating
- 8.1.1. Less than 75 kVA
- 8.1.2. 75-375 kVA
- 8.1.3. Above 375 kVA
- 8.2. Market Analysis, Insights and Forecast - by End-User
- 8.2.1. Industrial
- 8.2.2. Commercial
- 8.2.3. Residential
- 8.1. Market Analysis, Insights and Forecast - by Power Rating
- 9. South America Gas Generator Industry Analysis, Insights and Forecast, 2020-2032
- 9.1. Market Analysis, Insights and Forecast - by Power Rating
- 9.1.1. Less than 75 kVA
- 9.1.2. 75-375 kVA
- 9.1.3. Above 375 kVA
- 9.2. Market Analysis, Insights and Forecast - by End-User
- 9.2.1. Industrial
- 9.2.2. Commercial
- 9.2.3. Residential
- 9.1. Market Analysis, Insights and Forecast - by Power Rating
- 10. Middle East and Africa Gas Generator Industry Analysis, Insights and Forecast, 2020-2032
- 10.1. Market Analysis, Insights and Forecast - by Power Rating
- 10.1.1. Less than 75 kVA
- 10.1.2. 75-375 kVA
- 10.1.3. Above 375 kVA
- 10.2. Market Analysis, Insights and Forecast - by End-User
- 10.2.1. Industrial
- 10.2.2. Commercial
- 10.2.3. Residential
- 10.1. Market Analysis, Insights and Forecast - by Power Rating
- 11. Competitive Analysis
- 11.1. Global Market Share Analysis 2025
- 11.2. Company Profiles
- 11.2.1 F G Wilson
- 11.2.1.1. Overview
- 11.2.1.2. Products
- 11.2.1.3. SWOT Analysis
- 11.2.1.4. Recent Developments
- 11.2.1.5. Financials (Based on Availability)
- 11.2.2 Cooper Corporation
- 11.2.2.1. Overview
- 11.2.2.2. Products
- 11.2.2.3. SWOT Analysis
- 11.2.2.4. Recent Developments
- 11.2.2.5. Financials (Based on Availability)
- 11.2.3 AKSA Power Generation
- 11.2.3.1. Overview
- 11.2.3.2. Products
- 11.2.3.3. SWOT Analysis
- 11.2.3.4. Recent Developments
- 11.2.3.5. Financials (Based on Availability)
- 11.2.4 Kohler Co
- 11.2.4.1. Overview
- 11.2.4.2. Products
- 11.2.4.3. SWOT Analysis
- 11.2.4.4. Recent Developments
- 11.2.4.5. Financials (Based on Availability)
- 11.2.5 Caterpillar Inc
- 11.2.5.1. Overview
- 11.2.5.2. Products
- 11.2.5.3. SWOT Analysis
- 11.2.5.4. Recent Developments
- 11.2.5.5. Financials (Based on Availability)
- 11.2.6 Cummins Inc
- 11.2.6.1. Overview
- 11.2.6.2. Products
- 11.2.6.3. SWOT Analysis
- 11.2.6.4. Recent Developments
- 11.2.6.5. Financials (Based on Availability)
- 11.2.7 General Electric Company
- 11.2.7.1. Overview
- 11.2.7.2. Products
- 11.2.7.3. SWOT Analysis
- 11.2.7.4. Recent Developments
- 11.2.7.5. Financials (Based on Availability)
- 11.2.8 Generac Holdings Inc
- 11.2.8.1. Overview
- 11.2.8.2. Products
- 11.2.8.3. SWOT Analysis
- 11.2.8.4. Recent Developments
- 11.2.8.5. Financials (Based on Availability)
- 11.2.9 MTU America Inc *List Not Exhaustive
- 11.2.9.1. Overview
- 11.2.9.2. Products
- 11.2.9.3. SWOT Analysis
- 11.2.9.4. Recent Developments
- 11.2.9.5. Financials (Based on Availability)
- 11.2.10 Mitsubishi Heavy Industries Ltd
- 11.2.10.1. Overview
- 11.2.10.2. Products
- 11.2.10.3. SWOT Analysis
- 11.2.10.4. Recent Developments
- 11.2.10.5. Financials (Based on Availability)
- 11.2.1 F G Wilson
List of Figures
- Figure 1: Global Gas Generator Industry Revenue Breakdown (billion, %) by Region 2025 & 2033
- Figure 2: Global Gas Generator Industry Volume Breakdown (K Unit, %) by Region 2025 & 2033
- Figure 3: North America Gas Generator Industry Revenue (billion), by Power Rating 2025 & 2033
- Figure 4: North America Gas Generator Industry Volume (K Unit), by Power Rating 2025 & 2033
- Figure 5: North America Gas Generator Industry Revenue Share (%), by Power Rating 2025 & 2033
- Figure 6: North America Gas Generator Industry Volume Share (%), by Power Rating 2025 & 2033
- Figure 7: North America Gas Generator Industry Revenue (billion), by End-User 2025 & 2033
- Figure 8: North America Gas Generator Industry Volume (K Unit), by End-User 2025 & 2033
- Figure 9: North America Gas Generator Industry Revenue Share (%), by End-User 2025 & 2033
- Figure 10: North America Gas Generator Industry Volume Share (%), by End-User 2025 & 2033
- Figure 11: North America Gas Generator Industry Revenue (billion), by Country 2025 & 2033
- Figure 12: North America Gas Generator Industry Volume (K Unit), by Country 2025 & 2033
- Figure 13: North America Gas Generator Industry Revenue Share (%), by Country 2025 & 2033
- Figure 14: North America Gas Generator Industry Volume Share (%), by Country 2025 & 2033
- Figure 15: Europe Gas Generator Industry Revenue (billion), by Power Rating 2025 & 2033
- Figure 16: Europe Gas Generator Industry Volume (K Unit), by Power Rating 2025 & 2033
- Figure 17: Europe Gas Generator Industry Revenue Share (%), by Power Rating 2025 & 2033
- Figure 18: Europe Gas Generator Industry Volume Share (%), by Power Rating 2025 & 2033
- Figure 19: Europe Gas Generator Industry Revenue (billion), by End-User 2025 & 2033
- Figure 20: Europe Gas Generator Industry Volume (K Unit), by End-User 2025 & 2033
- Figure 21: Europe Gas Generator Industry Revenue Share (%), by End-User 2025 & 2033
- Figure 22: Europe Gas Generator Industry Volume Share (%), by End-User 2025 & 2033
- Figure 23: Europe Gas Generator Industry Revenue (billion), by Country 2025 & 2033
- Figure 24: Europe Gas Generator Industry Volume (K Unit), by Country 2025 & 2033
- Figure 25: Europe Gas Generator Industry Revenue Share (%), by Country 2025 & 2033
- Figure 26: Europe Gas Generator Industry Volume Share (%), by Country 2025 & 2033
- Figure 27: Asia Pacific Gas Generator Industry Revenue (billion), by Power Rating 2025 & 2033
- Figure 28: Asia Pacific Gas Generator Industry Volume (K Unit), by Power Rating 2025 & 2033
- Figure 29: Asia Pacific Gas Generator Industry Revenue Share (%), by Power Rating 2025 & 2033
- Figure 30: Asia Pacific Gas Generator Industry Volume Share (%), by Power Rating 2025 & 2033
- Figure 31: Asia Pacific Gas Generator Industry Revenue (billion), by End-User 2025 & 2033
- Figure 32: Asia Pacific Gas Generator Industry Volume (K Unit), by End-User 2025 & 2033
- Figure 33: Asia Pacific Gas Generator Industry Revenue Share (%), by End-User 2025 & 2033
- Figure 34: Asia Pacific Gas Generator Industry Volume Share (%), by End-User 2025 & 2033
- Figure 35: Asia Pacific Gas Generator Industry Revenue (billion), by Country 2025 & 2033
- Figure 36: Asia Pacific Gas Generator Industry Volume (K Unit), by Country 2025 & 2033
- Figure 37: Asia Pacific Gas Generator Industry Revenue Share (%), by Country 2025 & 2033
- Figure 38: Asia Pacific Gas Generator Industry Volume Share (%), by Country 2025 & 2033
- Figure 39: South America Gas Generator Industry Revenue (billion), by Power Rating 2025 & 2033
- Figure 40: South America Gas Generator Industry Volume (K Unit), by Power Rating 2025 & 2033
- Figure 41: South America Gas Generator Industry Revenue Share (%), by Power Rating 2025 & 2033
- Figure 42: South America Gas Generator Industry Volume Share (%), by Power Rating 2025 & 2033
- Figure 43: South America Gas Generator Industry Revenue (billion), by End-User 2025 & 2033
- Figure 44: South America Gas Generator Industry Volume (K Unit), by End-User 2025 & 2033
- Figure 45: South America Gas Generator Industry Revenue Share (%), by End-User 2025 & 2033
- Figure 46: South America Gas Generator Industry Volume Share (%), by End-User 2025 & 2033
- Figure 47: South America Gas Generator Industry Revenue (billion), by Country 2025 & 2033
- Figure 48: South America Gas Generator Industry Volume (K Unit), by Country 2025 & 2033
- Figure 49: South America Gas Generator Industry Revenue Share (%), by Country 2025 & 2033
- Figure 50: South America Gas Generator Industry Volume Share (%), by Country 2025 & 2033
- Figure 51: Middle East and Africa Gas Generator Industry Revenue (billion), by Power Rating 2025 & 2033
- Figure 52: Middle East and Africa Gas Generator Industry Volume (K Unit), by Power Rating 2025 & 2033
- Figure 53: Middle East and Africa Gas Generator Industry Revenue Share (%), by Power Rating 2025 & 2033
- Figure 54: Middle East and Africa Gas Generator Industry Volume Share (%), by Power Rating 2025 & 2033
- Figure 55: Middle East and Africa Gas Generator Industry Revenue (billion), by End-User 2025 & 2033
- Figure 56: Middle East and Africa Gas Generator Industry Volume (K Unit), by End-User 2025 & 2033
- Figure 57: Middle East and Africa Gas Generator Industry Revenue Share (%), by End-User 2025 & 2033
- Figure 58: Middle East and Africa Gas Generator Industry Volume Share (%), by End-User 2025 & 2033
- Figure 59: Middle East and Africa Gas Generator Industry Revenue (billion), by Country 2025 & 2033
- Figure 60: Middle East and Africa Gas Generator Industry Volume (K Unit), by Country 2025 & 2033
- Figure 61: Middle East and Africa Gas Generator Industry Revenue Share (%), by Country 2025 & 2033
- Figure 62: Middle East and Africa Gas Generator Industry Volume Share (%), by Country 2025 & 2033
List of Tables
- Table 1: Global Gas Generator Industry Revenue billion Forecast, by Power Rating 2020 & 2033
- Table 2: Global Gas Generator Industry Volume K Unit Forecast, by Power Rating 2020 & 2033
- Table 3: Global Gas Generator Industry Revenue billion Forecast, by End-User 2020 & 2033
- Table 4: Global Gas Generator Industry Volume K Unit Forecast, by End-User 2020 & 2033
- Table 5: Global Gas Generator Industry Revenue billion Forecast, by Region 2020 & 2033
- Table 6: Global Gas Generator Industry Volume K Unit Forecast, by Region 2020 & 2033
- Table 7: Global Gas Generator Industry Revenue billion Forecast, by Power Rating 2020 & 2033
- Table 8: Global Gas Generator Industry Volume K Unit Forecast, by Power Rating 2020 & 2033
- Table 9: Global Gas Generator Industry Revenue billion Forecast, by End-User 2020 & 2033
- Table 10: Global Gas Generator Industry Volume K Unit Forecast, by End-User 2020 & 2033
- Table 11: Global Gas Generator Industry Revenue billion Forecast, by Country 2020 & 2033
- Table 12: Global Gas Generator Industry Volume K Unit Forecast, by Country 2020 & 2033
- Table 13: United States Gas Generator Industry Revenue (billion) Forecast, by Application 2020 & 2033
- Table 14: United States Gas Generator Industry Volume (K Unit) Forecast, by Application 2020 & 2033
- Table 15: Canada Gas Generator Industry Revenue (billion) Forecast, by Application 2020 & 2033
- Table 16: Canada Gas Generator Industry Volume (K Unit) Forecast, by Application 2020 & 2033
- Table 17: Rest of North America Gas Generator Industry Revenue (billion) Forecast, by Application 2020 & 2033
- Table 18: Rest of North America Gas Generator Industry Volume (K Unit) Forecast, by Application 2020 & 2033
- Table 19: Global Gas Generator Industry Revenue billion Forecast, by Power Rating 2020 & 2033
- Table 20: Global Gas Generator Industry Volume K Unit Forecast, by Power Rating 2020 & 2033
- Table 21: Global Gas Generator Industry Revenue billion Forecast, by End-User 2020 & 2033
- Table 22: Global Gas Generator Industry Volume K Unit Forecast, by End-User 2020 & 2033
- Table 23: Global Gas Generator Industry Revenue billion Forecast, by Country 2020 & 2033
- Table 24: Global Gas Generator Industry Volume K Unit Forecast, by Country 2020 & 2033
- Table 25: Germany Gas Generator Industry Revenue (billion) Forecast, by Application 2020 & 2033
- Table 26: Germany Gas Generator Industry Volume (K Unit) Forecast, by Application 2020 & 2033
- Table 27: France Gas Generator Industry Revenue (billion) Forecast, by Application 2020 & 2033
- Table 28: France Gas Generator Industry Volume (K Unit) Forecast, by Application 2020 & 2033
- Table 29: United Kingdom Gas Generator Industry Revenue (billion) Forecast, by Application 2020 & 2033
- Table 30: United Kingdom Gas Generator Industry Volume (K Unit) Forecast, by Application 2020 & 2033
- Table 31: Rest of Europe Gas Generator Industry Revenue (billion) Forecast, by Application 2020 & 2033
- Table 32: Rest of Europe Gas Generator Industry Volume (K Unit) Forecast, by Application 2020 & 2033
- Table 33: Global Gas Generator Industry Revenue billion Forecast, by Power Rating 2020 & 2033
- Table 34: Global Gas Generator Industry Volume K Unit Forecast, by Power Rating 2020 & 2033
- Table 35: Global Gas Generator Industry Revenue billion Forecast, by End-User 2020 & 2033
- Table 36: Global Gas Generator Industry Volume K Unit Forecast, by End-User 2020 & 2033
- Table 37: Global Gas Generator Industry Revenue billion Forecast, by Country 2020 & 2033
- Table 38: Global Gas Generator Industry Volume K Unit Forecast, by Country 2020 & 2033
- Table 39: China Gas Generator Industry Revenue (billion) Forecast, by Application 2020 & 2033
- Table 40: China Gas Generator Industry Volume (K Unit) Forecast, by Application 2020 & 2033
- Table 41: India Gas Generator Industry Revenue (billion) Forecast, by Application 2020 & 2033
- Table 42: India Gas Generator Industry Volume (K Unit) Forecast, by Application 2020 & 2033
- Table 43: Japan Gas Generator Industry Revenue (billion) Forecast, by Application 2020 & 2033
- Table 44: Japan Gas Generator Industry Volume (K Unit) Forecast, by Application 2020 & 2033
- Table 45: South Korea Gas Generator Industry Revenue (billion) Forecast, by Application 2020 & 2033
- Table 46: South Korea Gas Generator Industry Volume (K Unit) Forecast, by Application 2020 & 2033
- Table 47: Rest of Asia Pacific Gas Generator Industry Revenue (billion) Forecast, by Application 2020 & 2033
- Table 48: Rest of Asia Pacific Gas Generator Industry Volume (K Unit) Forecast, by Application 2020 & 2033
- Table 49: Global Gas Generator Industry Revenue billion Forecast, by Power Rating 2020 & 2033
- Table 50: Global Gas Generator Industry Volume K Unit Forecast, by Power Rating 2020 & 2033
- Table 51: Global Gas Generator Industry Revenue billion Forecast, by End-User 2020 & 2033
- Table 52: Global Gas Generator Industry Volume K Unit Forecast, by End-User 2020 & 2033
- Table 53: Global Gas Generator Industry Revenue billion Forecast, by Country 2020 & 2033
- Table 54: Global Gas Generator Industry Volume K Unit Forecast, by Country 2020 & 2033
- Table 55: Brazil Gas Generator Industry Revenue (billion) Forecast, by Application 2020 & 2033
- Table 56: Brazil Gas Generator Industry Volume (K Unit) Forecast, by Application 2020 & 2033
- Table 57: Argentina Gas Generator Industry Revenue (billion) Forecast, by Application 2020 & 2033
- Table 58: Argentina Gas Generator Industry Volume (K Unit) Forecast, by Application 2020 & 2033
- Table 59: Rest of South America Gas Generator Industry Revenue (billion) Forecast, by Application 2020 & 2033
- Table 60: Rest of South America Gas Generator Industry Volume (K Unit) Forecast, by Application 2020 & 2033
- Table 61: Global Gas Generator Industry Revenue billion Forecast, by Power Rating 2020 & 2033
- Table 62: Global Gas Generator Industry Volume K Unit Forecast, by Power Rating 2020 & 2033
- Table 63: Global Gas Generator Industry Revenue billion Forecast, by End-User 2020 & 2033
- Table 64: Global Gas Generator Industry Volume K Unit Forecast, by End-User 2020 & 2033
- Table 65: Global Gas Generator Industry Revenue billion Forecast, by Country 2020 & 2033
- Table 66: Global Gas Generator Industry Volume K Unit Forecast, by Country 2020 & 2033
- Table 67: Saudi Arabia Gas Generator Industry Revenue (billion) Forecast, by Application 2020 & 2033
- Table 68: Saudi Arabia Gas Generator Industry Volume (K Unit) Forecast, by Application 2020 & 2033
- Table 69: United Arab Emirates Gas Generator Industry Revenue (billion) Forecast, by Application 2020 & 2033
- Table 70: United Arab Emirates Gas Generator Industry Volume (K Unit) Forecast, by Application 2020 & 2033
- Table 71: South Africa Gas Generator Industry Revenue (billion) Forecast, by Application 2020 & 2033
- Table 72: South Africa Gas Generator Industry Volume (K Unit) Forecast, by Application 2020 & 2033
- Table 73: Rest of Middle East and Africa Gas Generator Industry Revenue (billion) Forecast, by Application 2020 & 2033
- Table 74: Rest of Middle East and Africa Gas Generator Industry Volume (K Unit) Forecast, by Application 2020 & 2033
Frequently Asked Questions
1. What is the projected Compound Annual Growth Rate (CAGR) of the Gas Generator Industry?
The projected CAGR is approximately 4.1%.
2. Which companies are prominent players in the Gas Generator Industry?
Key companies in the market include F G Wilson, Cooper Corporation, AKSA Power Generation, Kohler Co, Caterpillar Inc, Cummins Inc, General Electric Company, Generac Holdings Inc, MTU America Inc *List Not Exhaustive, Mitsubishi Heavy Industries Ltd.
3. What are the main segments of the Gas Generator Industry?
The market segments include Power Rating, End-User.
4. Can you provide details about the market size?
The market size is estimated to be USD 28.5 billion as of 2022.
5. What are some drivers contributing to market growth?
Increasing Awareness Regarding Natural Gas as a Clean and Reliable Fuel4.; Increasing Concerns Over Diesel Maintenance and Refueling Issues.
6. What are the notable trends driving market growth?
Below 75 kVA Capacity Rating to Dominate the Market.
7. Are there any restraints impacting market growth?
Lack of Gas Grid Connectivity Via Pipeline. Resulting in Hindered Fuel Supply.
8. Can you provide examples of recent developments in the market?
February 2023: Cummins Inc. announced adding 175kW and 200kW natural gas standby generator sets for North American customers. These two new generator sets are a part of Cummins's continual investment in new and sustainable technologies as part of Destination Zero, the company's strategy to reach zero emissions across its products. The new 175kW and 200kW natural gas generator sets offer customers industry-leading power density and are engineered to provide exceptional performance and consistent reliability to meet customers' power requirements.
9. What pricing options are available for accessing the report?
Pricing options include single-user, multi-user, and enterprise licenses priced at USD 4750, USD 5250, and USD 8750 respectively.
10. Is the market size provided in terms of value or volume?
The market size is provided in terms of value, measured in billion and volume, measured in K Unit.
11. Are there any specific market keywords associated with the report?
Yes, the market keyword associated with the report is "Gas Generator Industry," which aids in identifying and referencing the specific market segment covered.
12. How do I determine which pricing option suits my needs best?
The pricing options vary based on user requirements and access needs. Individual users may opt for single-user licenses, while businesses requiring broader access may choose multi-user or enterprise licenses for cost-effective access to the report.
13. Are there any additional resources or data provided in the Gas Generator Industry report?
While the report offers comprehensive insights, it's advisable to review the specific contents or supplementary materials provided to ascertain if additional resources or data are available.
14. How can I stay updated on further developments or reports in the Gas Generator Industry?
To stay informed about further developments, trends, and reports in the Gas Generator Industry, consider subscribing to industry newsletters, following relevant companies and organizations, or regularly checking reputable industry news sources and publications.
Methodology
Step 1 - Identification of Relevant Samples Size from Population Database


Step 2 - Approaches for Defining Global Market Size (Value, Volume* & Price*)

Note*: In applicable scenarios
Step 3 - Data Sources
Primary Research
- Web Analytics
- Survey Reports
- Research Institute
- Latest Research Reports
- Opinion Leaders
Secondary Research
- Annual Reports
- White Paper
- Latest Press Release
- Industry Association
- Paid Database
- Investor Presentations

Step 4 - Data Triangulation
Involves using different sources of information in order to increase the validity of a study
These sources are likely to be stakeholders in a program - participants, other researchers, program staff, other community members, and so on.
Then we put all data in single framework & apply various statistical tools to find out the dynamic on the market.
During the analysis stage, feedback from the stakeholder groups would be compared to determine areas of agreement as well as areas of divergence