

Key Insights
The global industrial paper bag market is poised for significant expansion, driven by escalating demand from the food & beverage, chemical, and construction industries. Key growth catalysts include the inherent sustainability of paper packaging over plastic, a rising consumer preference for eco-friendly alternatives, and supportive government policies targeting plastic waste reduction. Innovations in manufacturing technology are enhancing paper bag strength, durability, and printability, making them an attractive and economical packaging choice for businesses. Despite potential raw material price volatility, the market is projected to achieve a robust 4.7% Compound Annual Growth Rate (CAGR), reaching an estimated $6.16 billion by 2025. Emerging economies, fueled by industrialization and urbanization, are expected to be major drivers of this growth, with a particular emphasis on cost-effective and sustainable packaging solutions.
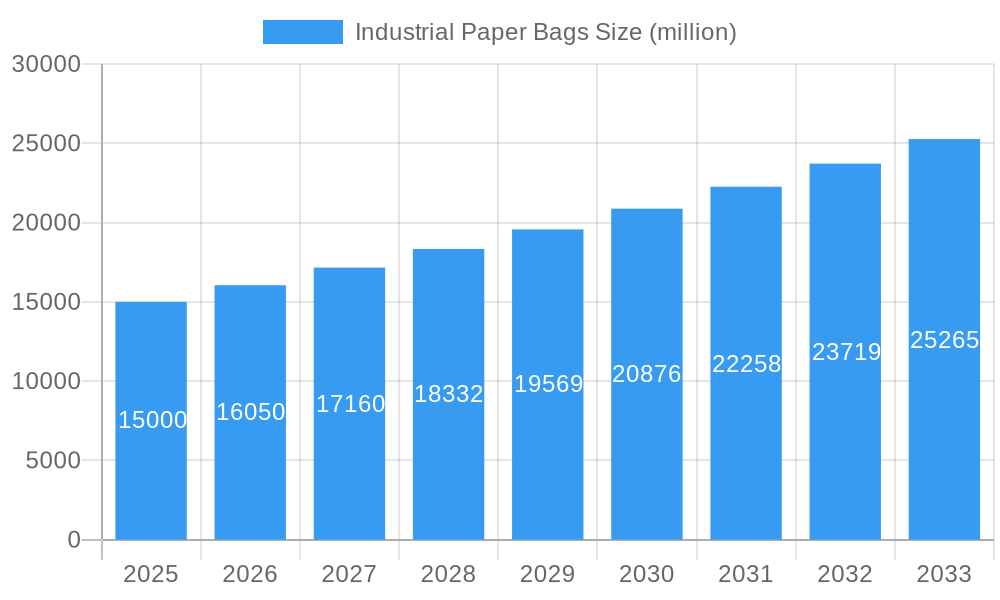
Industrial Paper Bags Market Size (In Billion)
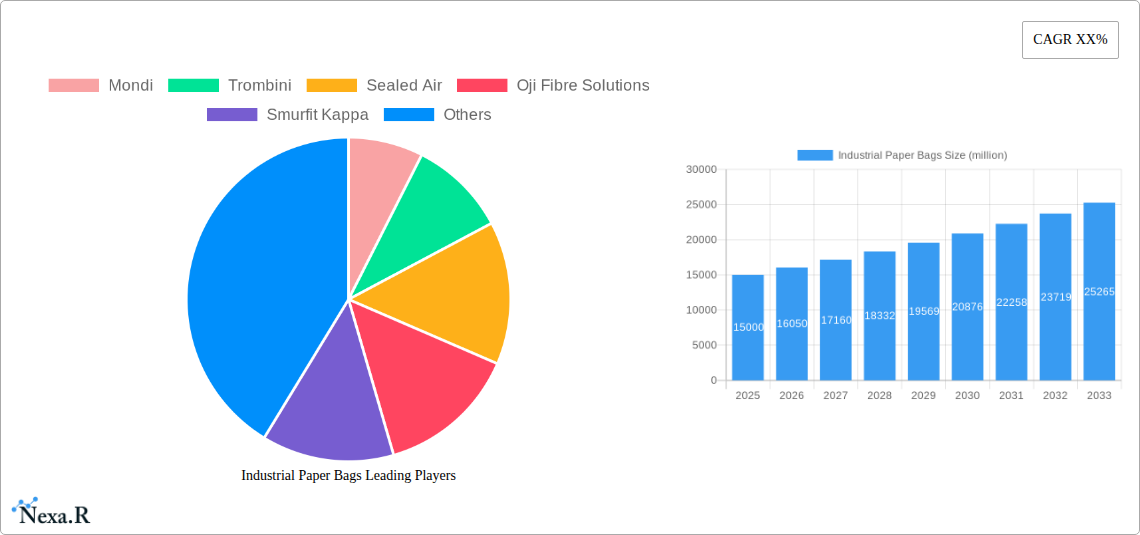
The market features a dynamic competitive environment with both global leaders and regional enterprises. Prominent players such as Mondi, Smurfit Kappa, and Sealed Air are consolidating their market positions through extensive distribution networks and advanced technological investments. Concurrently, agile smaller firms are carving out success in specialized segments by providing bespoke packaging solutions. Market segmentation by bag type, size, and application enables strategic specialization and diversified revenue generation. Future growth trajectories will be shaped by the expanding e-commerce sector, which demands advanced packaging for secure and efficient logistics, and continuous advancements in sustainable paper production methods. The overall market outlook is highly positive, indicating sustained growth for industrial paper bags.
Industrial Paper Bags Company Market Share
Industrial Paper Bags Market Report: 2019-2033
This comprehensive report provides an in-depth analysis of the global industrial paper bags market, offering invaluable insights for industry professionals, investors, and strategic decision-makers. Covering the period from 2019 to 2033, with a focus on 2025, this report unveils the market dynamics, growth trends, key players, and future outlook for this vital packaging segment. The report segments the market by parent and child market to provide a comprehensive view. The total market size in 2025 is estimated at xx million units.
Industrial Paper Bags Market Dynamics & Structure
The industrial paper bags market is characterized by moderate concentration, with key players like Mondi, Smurfit Kappa, and Oji Fibre Solutions holding significant market share. Technological innovation, driven by increasing demand for sustainable and efficient packaging solutions, is a major driver. Stringent environmental regulations are shaping the market, pushing manufacturers towards eco-friendly materials and production processes. The market faces competition from alternative packaging materials like plastic bags and flexible packaging, although the increasing preference for sustainable options is offsetting this threat. M&A activity remains moderate, with xx deals recorded between 2019 and 2024, primarily focused on expanding geographical reach and product portfolios. End-user demographics are diverse, spanning various industries, including cement, chemicals, food, and agriculture.
- Market Concentration: Moderately concentrated, with top 5 players holding approximately xx% market share in 2025.
- Technological Innovation: Focus on lightweighting, improved barrier properties, and sustainable materials (recycled content, bio-based alternatives).
- Regulatory Framework: Increasing emphasis on recyclability and reduced environmental impact.
- Competitive Substitutes: Plastic bags, flexible packaging, and other types of industrial sacks.
- M&A Activity: xx deals recorded between 2019 and 2024, primarily focused on expansion and diversification.
- End-User Demographics: Diverse, including cement, chemicals, food, agriculture, and construction.
Industrial Paper Bags Growth Trends & Insights
The global industrial paper bags market experienced a CAGR of xx% during the historical period (2019-2024), driven by growth across multiple end-use sectors. This growth is projected to continue at a CAGR of xx% during the forecast period (2025-2033), reaching xx million units by 2033. The increasing adoption of paper bags in emerging economies, coupled with the growing demand for sustainable packaging alternatives, is a key factor influencing this growth. Technological advancements in material science and printing technologies are contributing to enhanced product performance and customization options. Consumer behavior shifts toward eco-friendly products are also driving market expansion. Market penetration is highest in developed regions, but significant growth potential exists in developing countries.
Dominant Regions, Countries, or Segments in Industrial Paper Bags
Asia Pacific is the leading region for industrial paper bags, accounting for approximately xx% of the global market share in 2025, driven by strong economic growth, increasing industrialization, and rising construction activity. China and India are the key contributors within this region. The high demand for cement and other construction materials fuels the demand for robust and cost-effective packaging solutions, driving the growth of industrial paper bags. Favorable government policies promoting sustainable packaging contribute to the region's market dominance. Europe and North America also show significant market share.
- Key Drivers in Asia Pacific:
- Rapid industrialization and urbanization.
- Growing construction sector.
- Increasing demand for sustainable packaging.
- Supportive government policies.
- Dominance Factors: High consumption of cement and other bulk materials; cost-effectiveness of paper bags; growing awareness of environmental concerns.
Industrial Paper Bags Product Landscape
Industrial paper bags are manufactured from various paper grades, offering varying levels of strength, barrier properties, and printability. Innovations focus on lightweighting to reduce transportation costs and environmental impact while maintaining product protection. Advancements in printing technologies enable high-quality branding and product information. Unique selling propositions include customizable designs, eco-friendly materials, and cost-effectiveness. These bags find applications across diverse industries, catering to varied packaging needs.
Key Drivers, Barriers & Challenges in Industrial Paper Bags
Key Drivers: Growing demand from the cement and construction industries; increasing focus on sustainability; advancements in paper bag manufacturing technologies; favorable government regulations promoting sustainable packaging; rising disposable income in emerging markets.
Key Barriers and Challenges: Competition from alternative packaging materials (plastic bags, flexible packaging); fluctuations in raw material prices; stringent environmental regulations; supply chain disruptions (especially raw materials); potential for increased transportation costs due to rising fuel prices. The impact of these challenges could reduce the projected growth by approximately xx% if not effectively mitigated.
Emerging Opportunities in Industrial Paper Bags
Untapped markets in developing economies, particularly in Africa and Latin America, offer significant growth potential. Innovations in biodegradable and compostable materials present significant opportunities. The rising demand for customized packaging solutions provides opportunities for personalized designs and branding. The increasing use of e-commerce and the need for secure packaging for online delivery create a new segment for the paper bag market.
Growth Accelerators in the Industrial Paper Bags Industry
Technological advancements in paper production and printing technologies will continue to drive market growth, enabling the creation of more durable, sustainable, and cost-effective bags. Strategic partnerships between packaging companies and end-users will foster innovation and market expansion. Expanding into new geographic markets and exploring innovative applications in various industries will also accelerate growth.
Key Players Shaping the Industrial Paper Bags Market
- Mondi
- Trombini
- Sealed Air
- Oji Fibre Solutions
- Smurfit Kappa
- Gateway Packaging
- Langston Companies
- El Dorado Packaging
- NNZ
- NCC (National Company for Cement)
- Shuaiba Industrial Company (K.P.S.C)
Notable Milestones in Industrial Paper Bags Sector
- 2021: Mondi launched a new range of recyclable paper bags for the food industry.
- 2022: Smurfit Kappa invested in a new paper bag manufacturing facility in India.
- 2023: Increased focus on sustainable packaging solutions by major players across the industry. (Specific examples would be added here with verifiable sources)
In-Depth Industrial Paper Bags Market Outlook
The industrial paper bags market is poised for sustained growth over the forecast period. Technological advancements, particularly in sustainable materials and efficient manufacturing processes, will be key drivers. Strategic partnerships and expansion into new markets will further propel growth. The increasing preference for eco-friendly packaging solutions presents significant opportunities for market players to capitalize on. The market is projected to reach xx million units by 2033, indicating significant potential for future growth and investment.
Industrial Paper Bags Segmentation
-
1. Application
- 1.1. Cement
- 1.2. Food Industry
- 1.3. Agricultural Industry
- 1.4. Chemicals Industry
- 1.5. Others
-
2. Types
- 2.1. Paper Only
- 2.2. Paper-Plastic Mix
- 2.3. Others
Industrial Paper Bags Segmentation By Geography
-
1. North America
- 1.1. United States
- 1.2. Canada
- 1.3. Mexico
-
2. South America
- 2.1. Brazil
- 2.2. Argentina
- 2.3. Rest of South America
-
3. Europe
- 3.1. United Kingdom
- 3.2. Germany
- 3.3. France
- 3.4. Italy
- 3.5. Spain
- 3.6. Russia
- 3.7. Benelux
- 3.8. Nordics
- 3.9. Rest of Europe
-
4. Middle East & Africa
- 4.1. Turkey
- 4.2. Israel
- 4.3. GCC
- 4.4. North Africa
- 4.5. South Africa
- 4.6. Rest of Middle East & Africa
-
5. Asia Pacific
- 5.1. China
- 5.2. India
- 5.3. Japan
- 5.4. South Korea
- 5.5. ASEAN
- 5.6. Oceania
- 5.7. Rest of Asia Pacific
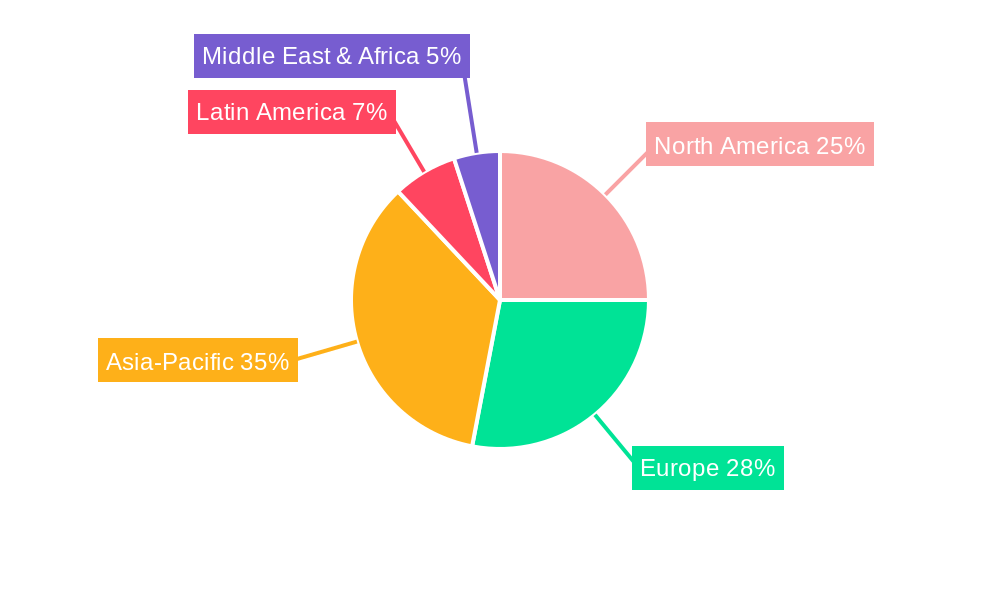
Industrial Paper Bags Regional Market Share
Geographic Coverage of Industrial Paper Bags
Industrial Paper Bags REPORT HIGHLIGHTS
| Aspects | Details |
|---|---|
| Study Period | 2020-2034 |
| Base Year | 2025 |
| Estimated Year | 2026 |
| Forecast Period | 2026-2034 |
| Historical Period | 2020-2025 |
| Growth Rate | CAGR of 4.7% from 2020-2034 |
| Segmentation |
|
Table of Contents
- 1. Introduction
- 1.1. Research Scope
- 1.2. Market Segmentation
- 1.3. Research Methodology
- 1.4. Definitions and Assumptions
- 2. Executive Summary
- 2.1. Introduction
- 3. Market Dynamics
- 3.1. Introduction
- 3.2. Market Drivers
- 3.3. Market Restrains
- 3.4. Market Trends
- 4. Market Factor Analysis
- 4.1. Porters Five Forces
- 4.2. Supply/Value Chain
- 4.3. PESTEL analysis
- 4.4. Market Entropy
- 4.5. Patent/Trademark Analysis
- 5. Global Industrial Paper Bags Analysis, Insights and Forecast, 2020-2032
- 5.1. Market Analysis, Insights and Forecast - by Application
- 5.1.1. Cement
- 5.1.2. Food Industry
- 5.1.3. Agricultural Industry
- 5.1.4. Chemicals Industry
- 5.1.5. Others
- 5.2. Market Analysis, Insights and Forecast - by Types
- 5.2.1. Paper Only
- 5.2.2. Paper-Plastic Mix
- 5.2.3. Others
- 5.3. Market Analysis, Insights and Forecast - by Region
- 5.3.1. North America
- 5.3.2. South America
- 5.3.3. Europe
- 5.3.4. Middle East & Africa
- 5.3.5. Asia Pacific
- 5.1. Market Analysis, Insights and Forecast - by Application
- 6. North America Industrial Paper Bags Analysis, Insights and Forecast, 2020-2032
- 6.1. Market Analysis, Insights and Forecast - by Application
- 6.1.1. Cement
- 6.1.2. Food Industry
- 6.1.3. Agricultural Industry
- 6.1.4. Chemicals Industry
- 6.1.5. Others
- 6.2. Market Analysis, Insights and Forecast - by Types
- 6.2.1. Paper Only
- 6.2.2. Paper-Plastic Mix
- 6.2.3. Others
- 6.1. Market Analysis, Insights and Forecast - by Application
- 7. South America Industrial Paper Bags Analysis, Insights and Forecast, 2020-2032
- 7.1. Market Analysis, Insights and Forecast - by Application
- 7.1.1. Cement
- 7.1.2. Food Industry
- 7.1.3. Agricultural Industry
- 7.1.4. Chemicals Industry
- 7.1.5. Others
- 7.2. Market Analysis, Insights and Forecast - by Types
- 7.2.1. Paper Only
- 7.2.2. Paper-Plastic Mix
- 7.2.3. Others
- 7.1. Market Analysis, Insights and Forecast - by Application
- 8. Europe Industrial Paper Bags Analysis, Insights and Forecast, 2020-2032
- 8.1. Market Analysis, Insights and Forecast - by Application
- 8.1.1. Cement
- 8.1.2. Food Industry
- 8.1.3. Agricultural Industry
- 8.1.4. Chemicals Industry
- 8.1.5. Others
- 8.2. Market Analysis, Insights and Forecast - by Types
- 8.2.1. Paper Only
- 8.2.2. Paper-Plastic Mix
- 8.2.3. Others
- 8.1. Market Analysis, Insights and Forecast - by Application
- 9. Middle East & Africa Industrial Paper Bags Analysis, Insights and Forecast, 2020-2032
- 9.1. Market Analysis, Insights and Forecast - by Application
- 9.1.1. Cement
- 9.1.2. Food Industry
- 9.1.3. Agricultural Industry
- 9.1.4. Chemicals Industry
- 9.1.5. Others
- 9.2. Market Analysis, Insights and Forecast - by Types
- 9.2.1. Paper Only
- 9.2.2. Paper-Plastic Mix
- 9.2.3. Others
- 9.1. Market Analysis, Insights and Forecast - by Application
- 10. Asia Pacific Industrial Paper Bags Analysis, Insights and Forecast, 2020-2032
- 10.1. Market Analysis, Insights and Forecast - by Application
- 10.1.1. Cement
- 10.1.2. Food Industry
- 10.1.3. Agricultural Industry
- 10.1.4. Chemicals Industry
- 10.1.5. Others
- 10.2. Market Analysis, Insights and Forecast - by Types
- 10.2.1. Paper Only
- 10.2.2. Paper-Plastic Mix
- 10.2.3. Others
- 10.1. Market Analysis, Insights and Forecast - by Application
- 11. Competitive Analysis
- 11.1. Global Market Share Analysis 2025
- 11.2. Company Profiles
- 11.2.1 Mondi
- 11.2.1.1. Overview
- 11.2.1.2. Products
- 11.2.1.3. SWOT Analysis
- 11.2.1.4. Recent Developments
- 11.2.1.5. Financials (Based on Availability)
- 11.2.2 Trombini
- 11.2.2.1. Overview
- 11.2.2.2. Products
- 11.2.2.3. SWOT Analysis
- 11.2.2.4. Recent Developments
- 11.2.2.5. Financials (Based on Availability)
- 11.2.3 Sealed Air
- 11.2.3.1. Overview
- 11.2.3.2. Products
- 11.2.3.3. SWOT Analysis
- 11.2.3.4. Recent Developments
- 11.2.3.5. Financials (Based on Availability)
- 11.2.4 Oji Fibre Solutions
- 11.2.4.1. Overview
- 11.2.4.2. Products
- 11.2.4.3. SWOT Analysis
- 11.2.4.4. Recent Developments
- 11.2.4.5. Financials (Based on Availability)
- 11.2.5 Smurfit Kappa
- 11.2.5.1. Overview
- 11.2.5.2. Products
- 11.2.5.3. SWOT Analysis
- 11.2.5.4. Recent Developments
- 11.2.5.5. Financials (Based on Availability)
- 11.2.6 Gateway Packaging
- 11.2.6.1. Overview
- 11.2.6.2. Products
- 11.2.6.3. SWOT Analysis
- 11.2.6.4. Recent Developments
- 11.2.6.5. Financials (Based on Availability)
- 11.2.7 Langston Companies
- 11.2.7.1. Overview
- 11.2.7.2. Products
- 11.2.7.3. SWOT Analysis
- 11.2.7.4. Recent Developments
- 11.2.7.5. Financials (Based on Availability)
- 11.2.8 El Dorado Packaging
- 11.2.8.1. Overview
- 11.2.8.2. Products
- 11.2.8.3. SWOT Analysis
- 11.2.8.4. Recent Developments
- 11.2.8.5. Financials (Based on Availability)
- 11.2.9 NNZ
- 11.2.9.1. Overview
- 11.2.9.2. Products
- 11.2.9.3. SWOT Analysis
- 11.2.9.4. Recent Developments
- 11.2.9.5. Financials (Based on Availability)
- 11.2.10 NCC (National Company for Cement)
- 11.2.10.1. Overview
- 11.2.10.2. Products
- 11.2.10.3. SWOT Analysis
- 11.2.10.4. Recent Developments
- 11.2.10.5. Financials (Based on Availability)
- 11.2.11 Shuaiba Industrial Company (K.P.S.C)
- 11.2.11.1. Overview
- 11.2.11.2. Products
- 11.2.11.3. SWOT Analysis
- 11.2.11.4. Recent Developments
- 11.2.11.5. Financials (Based on Availability)
- 11.2.1 Mondi
List of Figures
- Figure 1: Global Industrial Paper Bags Revenue Breakdown (billion, %) by Region 2025 & 2033
- Figure 2: Global Industrial Paper Bags Volume Breakdown (K, %) by Region 2025 & 2033
- Figure 3: North America Industrial Paper Bags Revenue (billion), by Application 2025 & 2033
- Figure 4: North America Industrial Paper Bags Volume (K), by Application 2025 & 2033
- Figure 5: North America Industrial Paper Bags Revenue Share (%), by Application 2025 & 2033
- Figure 6: North America Industrial Paper Bags Volume Share (%), by Application 2025 & 2033
- Figure 7: North America Industrial Paper Bags Revenue (billion), by Types 2025 & 2033
- Figure 8: North America Industrial Paper Bags Volume (K), by Types 2025 & 2033
- Figure 9: North America Industrial Paper Bags Revenue Share (%), by Types 2025 & 2033
- Figure 10: North America Industrial Paper Bags Volume Share (%), by Types 2025 & 2033
- Figure 11: North America Industrial Paper Bags Revenue (billion), by Country 2025 & 2033
- Figure 12: North America Industrial Paper Bags Volume (K), by Country 2025 & 2033
- Figure 13: North America Industrial Paper Bags Revenue Share (%), by Country 2025 & 2033
- Figure 14: North America Industrial Paper Bags Volume Share (%), by Country 2025 & 2033
- Figure 15: South America Industrial Paper Bags Revenue (billion), by Application 2025 & 2033
- Figure 16: South America Industrial Paper Bags Volume (K), by Application 2025 & 2033
- Figure 17: South America Industrial Paper Bags Revenue Share (%), by Application 2025 & 2033
- Figure 18: South America Industrial Paper Bags Volume Share (%), by Application 2025 & 2033
- Figure 19: South America Industrial Paper Bags Revenue (billion), by Types 2025 & 2033
- Figure 20: South America Industrial Paper Bags Volume (K), by Types 2025 & 2033
- Figure 21: South America Industrial Paper Bags Revenue Share (%), by Types 2025 & 2033
- Figure 22: South America Industrial Paper Bags Volume Share (%), by Types 2025 & 2033
- Figure 23: South America Industrial Paper Bags Revenue (billion), by Country 2025 & 2033
- Figure 24: South America Industrial Paper Bags Volume (K), by Country 2025 & 2033
- Figure 25: South America Industrial Paper Bags Revenue Share (%), by Country 2025 & 2033
- Figure 26: South America Industrial Paper Bags Volume Share (%), by Country 2025 & 2033
- Figure 27: Europe Industrial Paper Bags Revenue (billion), by Application 2025 & 2033
- Figure 28: Europe Industrial Paper Bags Volume (K), by Application 2025 & 2033
- Figure 29: Europe Industrial Paper Bags Revenue Share (%), by Application 2025 & 2033
- Figure 30: Europe Industrial Paper Bags Volume Share (%), by Application 2025 & 2033
- Figure 31: Europe Industrial Paper Bags Revenue (billion), by Types 2025 & 2033
- Figure 32: Europe Industrial Paper Bags Volume (K), by Types 2025 & 2033
- Figure 33: Europe Industrial Paper Bags Revenue Share (%), by Types 2025 & 2033
- Figure 34: Europe Industrial Paper Bags Volume Share (%), by Types 2025 & 2033
- Figure 35: Europe Industrial Paper Bags Revenue (billion), by Country 2025 & 2033
- Figure 36: Europe Industrial Paper Bags Volume (K), by Country 2025 & 2033
- Figure 37: Europe Industrial Paper Bags Revenue Share (%), by Country 2025 & 2033
- Figure 38: Europe Industrial Paper Bags Volume Share (%), by Country 2025 & 2033
- Figure 39: Middle East & Africa Industrial Paper Bags Revenue (billion), by Application 2025 & 2033
- Figure 40: Middle East & Africa Industrial Paper Bags Volume (K), by Application 2025 & 2033
- Figure 41: Middle East & Africa Industrial Paper Bags Revenue Share (%), by Application 2025 & 2033
- Figure 42: Middle East & Africa Industrial Paper Bags Volume Share (%), by Application 2025 & 2033
- Figure 43: Middle East & Africa Industrial Paper Bags Revenue (billion), by Types 2025 & 2033
- Figure 44: Middle East & Africa Industrial Paper Bags Volume (K), by Types 2025 & 2033
- Figure 45: Middle East & Africa Industrial Paper Bags Revenue Share (%), by Types 2025 & 2033
- Figure 46: Middle East & Africa Industrial Paper Bags Volume Share (%), by Types 2025 & 2033
- Figure 47: Middle East & Africa Industrial Paper Bags Revenue (billion), by Country 2025 & 2033
- Figure 48: Middle East & Africa Industrial Paper Bags Volume (K), by Country 2025 & 2033
- Figure 49: Middle East & Africa Industrial Paper Bags Revenue Share (%), by Country 2025 & 2033
- Figure 50: Middle East & Africa Industrial Paper Bags Volume Share (%), by Country 2025 & 2033
- Figure 51: Asia Pacific Industrial Paper Bags Revenue (billion), by Application 2025 & 2033
- Figure 52: Asia Pacific Industrial Paper Bags Volume (K), by Application 2025 & 2033
- Figure 53: Asia Pacific Industrial Paper Bags Revenue Share (%), by Application 2025 & 2033
- Figure 54: Asia Pacific Industrial Paper Bags Volume Share (%), by Application 2025 & 2033
- Figure 55: Asia Pacific Industrial Paper Bags Revenue (billion), by Types 2025 & 2033
- Figure 56: Asia Pacific Industrial Paper Bags Volume (K), by Types 2025 & 2033
- Figure 57: Asia Pacific Industrial Paper Bags Revenue Share (%), by Types 2025 & 2033
- Figure 58: Asia Pacific Industrial Paper Bags Volume Share (%), by Types 2025 & 2033
- Figure 59: Asia Pacific Industrial Paper Bags Revenue (billion), by Country 2025 & 2033
- Figure 60: Asia Pacific Industrial Paper Bags Volume (K), by Country 2025 & 2033
- Figure 61: Asia Pacific Industrial Paper Bags Revenue Share (%), by Country 2025 & 2033
- Figure 62: Asia Pacific Industrial Paper Bags Volume Share (%), by Country 2025 & 2033
List of Tables
- Table 1: Global Industrial Paper Bags Revenue billion Forecast, by Application 2020 & 2033
- Table 2: Global Industrial Paper Bags Volume K Forecast, by Application 2020 & 2033
- Table 3: Global Industrial Paper Bags Revenue billion Forecast, by Types 2020 & 2033
- Table 4: Global Industrial Paper Bags Volume K Forecast, by Types 2020 & 2033
- Table 5: Global Industrial Paper Bags Revenue billion Forecast, by Region 2020 & 2033
- Table 6: Global Industrial Paper Bags Volume K Forecast, by Region 2020 & 2033
- Table 7: Global Industrial Paper Bags Revenue billion Forecast, by Application 2020 & 2033
- Table 8: Global Industrial Paper Bags Volume K Forecast, by Application 2020 & 2033
- Table 9: Global Industrial Paper Bags Revenue billion Forecast, by Types 2020 & 2033
- Table 10: Global Industrial Paper Bags Volume K Forecast, by Types 2020 & 2033
- Table 11: Global Industrial Paper Bags Revenue billion Forecast, by Country 2020 & 2033
- Table 12: Global Industrial Paper Bags Volume K Forecast, by Country 2020 & 2033
- Table 13: United States Industrial Paper Bags Revenue (billion) Forecast, by Application 2020 & 2033
- Table 14: United States Industrial Paper Bags Volume (K) Forecast, by Application 2020 & 2033
- Table 15: Canada Industrial Paper Bags Revenue (billion) Forecast, by Application 2020 & 2033
- Table 16: Canada Industrial Paper Bags Volume (K) Forecast, by Application 2020 & 2033
- Table 17: Mexico Industrial Paper Bags Revenue (billion) Forecast, by Application 2020 & 2033
- Table 18: Mexico Industrial Paper Bags Volume (K) Forecast, by Application 2020 & 2033
- Table 19: Global Industrial Paper Bags Revenue billion Forecast, by Application 2020 & 2033
- Table 20: Global Industrial Paper Bags Volume K Forecast, by Application 2020 & 2033
- Table 21: Global Industrial Paper Bags Revenue billion Forecast, by Types 2020 & 2033
- Table 22: Global Industrial Paper Bags Volume K Forecast, by Types 2020 & 2033
- Table 23: Global Industrial Paper Bags Revenue billion Forecast, by Country 2020 & 2033
- Table 24: Global Industrial Paper Bags Volume K Forecast, by Country 2020 & 2033
- Table 25: Brazil Industrial Paper Bags Revenue (billion) Forecast, by Application 2020 & 2033
- Table 26: Brazil Industrial Paper Bags Volume (K) Forecast, by Application 2020 & 2033
- Table 27: Argentina Industrial Paper Bags Revenue (billion) Forecast, by Application 2020 & 2033
- Table 28: Argentina Industrial Paper Bags Volume (K) Forecast, by Application 2020 & 2033
- Table 29: Rest of South America Industrial Paper Bags Revenue (billion) Forecast, by Application 2020 & 2033
- Table 30: Rest of South America Industrial Paper Bags Volume (K) Forecast, by Application 2020 & 2033
- Table 31: Global Industrial Paper Bags Revenue billion Forecast, by Application 2020 & 2033
- Table 32: Global Industrial Paper Bags Volume K Forecast, by Application 2020 & 2033
- Table 33: Global Industrial Paper Bags Revenue billion Forecast, by Types 2020 & 2033
- Table 34: Global Industrial Paper Bags Volume K Forecast, by Types 2020 & 2033
- Table 35: Global Industrial Paper Bags Revenue billion Forecast, by Country 2020 & 2033
- Table 36: Global Industrial Paper Bags Volume K Forecast, by Country 2020 & 2033
- Table 37: United Kingdom Industrial Paper Bags Revenue (billion) Forecast, by Application 2020 & 2033
- Table 38: United Kingdom Industrial Paper Bags Volume (K) Forecast, by Application 2020 & 2033
- Table 39: Germany Industrial Paper Bags Revenue (billion) Forecast, by Application 2020 & 2033
- Table 40: Germany Industrial Paper Bags Volume (K) Forecast, by Application 2020 & 2033
- Table 41: France Industrial Paper Bags Revenue (billion) Forecast, by Application 2020 & 2033
- Table 42: France Industrial Paper Bags Volume (K) Forecast, by Application 2020 & 2033
- Table 43: Italy Industrial Paper Bags Revenue (billion) Forecast, by Application 2020 & 2033
- Table 44: Italy Industrial Paper Bags Volume (K) Forecast, by Application 2020 & 2033
- Table 45: Spain Industrial Paper Bags Revenue (billion) Forecast, by Application 2020 & 2033
- Table 46: Spain Industrial Paper Bags Volume (K) Forecast, by Application 2020 & 2033
- Table 47: Russia Industrial Paper Bags Revenue (billion) Forecast, by Application 2020 & 2033
- Table 48: Russia Industrial Paper Bags Volume (K) Forecast, by Application 2020 & 2033
- Table 49: Benelux Industrial Paper Bags Revenue (billion) Forecast, by Application 2020 & 2033
- Table 50: Benelux Industrial Paper Bags Volume (K) Forecast, by Application 2020 & 2033
- Table 51: Nordics Industrial Paper Bags Revenue (billion) Forecast, by Application 2020 & 2033
- Table 52: Nordics Industrial Paper Bags Volume (K) Forecast, by Application 2020 & 2033
- Table 53: Rest of Europe Industrial Paper Bags Revenue (billion) Forecast, by Application 2020 & 2033
- Table 54: Rest of Europe Industrial Paper Bags Volume (K) Forecast, by Application 2020 & 2033
- Table 55: Global Industrial Paper Bags Revenue billion Forecast, by Application 2020 & 2033
- Table 56: Global Industrial Paper Bags Volume K Forecast, by Application 2020 & 2033
- Table 57: Global Industrial Paper Bags Revenue billion Forecast, by Types 2020 & 2033
- Table 58: Global Industrial Paper Bags Volume K Forecast, by Types 2020 & 2033
- Table 59: Global Industrial Paper Bags Revenue billion Forecast, by Country 2020 & 2033
- Table 60: Global Industrial Paper Bags Volume K Forecast, by Country 2020 & 2033
- Table 61: Turkey Industrial Paper Bags Revenue (billion) Forecast, by Application 2020 & 2033
- Table 62: Turkey Industrial Paper Bags Volume (K) Forecast, by Application 2020 & 2033
- Table 63: Israel Industrial Paper Bags Revenue (billion) Forecast, by Application 2020 & 2033
- Table 64: Israel Industrial Paper Bags Volume (K) Forecast, by Application 2020 & 2033
- Table 65: GCC Industrial Paper Bags Revenue (billion) Forecast, by Application 2020 & 2033
- Table 66: GCC Industrial Paper Bags Volume (K) Forecast, by Application 2020 & 2033
- Table 67: North Africa Industrial Paper Bags Revenue (billion) Forecast, by Application 2020 & 2033
- Table 68: North Africa Industrial Paper Bags Volume (K) Forecast, by Application 2020 & 2033
- Table 69: South Africa Industrial Paper Bags Revenue (billion) Forecast, by Application 2020 & 2033
- Table 70: South Africa Industrial Paper Bags Volume (K) Forecast, by Application 2020 & 2033
- Table 71: Rest of Middle East & Africa Industrial Paper Bags Revenue (billion) Forecast, by Application 2020 & 2033
- Table 72: Rest of Middle East & Africa Industrial Paper Bags Volume (K) Forecast, by Application 2020 & 2033
- Table 73: Global Industrial Paper Bags Revenue billion Forecast, by Application 2020 & 2033
- Table 74: Global Industrial Paper Bags Volume K Forecast, by Application 2020 & 2033
- Table 75: Global Industrial Paper Bags Revenue billion Forecast, by Types 2020 & 2033
- Table 76: Global Industrial Paper Bags Volume K Forecast, by Types 2020 & 2033
- Table 77: Global Industrial Paper Bags Revenue billion Forecast, by Country 2020 & 2033
- Table 78: Global Industrial Paper Bags Volume K Forecast, by Country 2020 & 2033
- Table 79: China Industrial Paper Bags Revenue (billion) Forecast, by Application 2020 & 2033
- Table 80: China Industrial Paper Bags Volume (K) Forecast, by Application 2020 & 2033
- Table 81: India Industrial Paper Bags Revenue (billion) Forecast, by Application 2020 & 2033
- Table 82: India Industrial Paper Bags Volume (K) Forecast, by Application 2020 & 2033
- Table 83: Japan Industrial Paper Bags Revenue (billion) Forecast, by Application 2020 & 2033
- Table 84: Japan Industrial Paper Bags Volume (K) Forecast, by Application 2020 & 2033
- Table 85: South Korea Industrial Paper Bags Revenue (billion) Forecast, by Application 2020 & 2033
- Table 86: South Korea Industrial Paper Bags Volume (K) Forecast, by Application 2020 & 2033
- Table 87: ASEAN Industrial Paper Bags Revenue (billion) Forecast, by Application 2020 & 2033
- Table 88: ASEAN Industrial Paper Bags Volume (K) Forecast, by Application 2020 & 2033
- Table 89: Oceania Industrial Paper Bags Revenue (billion) Forecast, by Application 2020 & 2033
- Table 90: Oceania Industrial Paper Bags Volume (K) Forecast, by Application 2020 & 2033
- Table 91: Rest of Asia Pacific Industrial Paper Bags Revenue (billion) Forecast, by Application 2020 & 2033
- Table 92: Rest of Asia Pacific Industrial Paper Bags Volume (K) Forecast, by Application 2020 & 2033
Frequently Asked Questions
1. What is the projected Compound Annual Growth Rate (CAGR) of the Industrial Paper Bags?
The projected CAGR is approximately 4.7%.
2. Which companies are prominent players in the Industrial Paper Bags?
Key companies in the market include Mondi, Trombini, Sealed Air, Oji Fibre Solutions, Smurfit Kappa, Gateway Packaging, Langston Companies, El Dorado Packaging, NNZ, NCC (National Company for Cement), Shuaiba Industrial Company (K.P.S.C).
3. What are the main segments of the Industrial Paper Bags?
The market segments include Application, Types.
4. Can you provide details about the market size?
The market size is estimated to be USD 6.16 billion as of 2022.
5. What are some drivers contributing to market growth?
N/A
6. What are the notable trends driving market growth?
N/A
7. Are there any restraints impacting market growth?
N/A
8. Can you provide examples of recent developments in the market?
N/A
9. What pricing options are available for accessing the report?
Pricing options include single-user, multi-user, and enterprise licenses priced at USD 3350.00, USD 5025.00, and USD 6700.00 respectively.
10. Is the market size provided in terms of value or volume?
The market size is provided in terms of value, measured in billion and volume, measured in K.
11. Are there any specific market keywords associated with the report?
Yes, the market keyword associated with the report is "Industrial Paper Bags," which aids in identifying and referencing the specific market segment covered.
12. How do I determine which pricing option suits my needs best?
The pricing options vary based on user requirements and access needs. Individual users may opt for single-user licenses, while businesses requiring broader access may choose multi-user or enterprise licenses for cost-effective access to the report.
13. Are there any additional resources or data provided in the Industrial Paper Bags report?
While the report offers comprehensive insights, it's advisable to review the specific contents or supplementary materials provided to ascertain if additional resources or data are available.
14. How can I stay updated on further developments or reports in the Industrial Paper Bags?
To stay informed about further developments, trends, and reports in the Industrial Paper Bags, consider subscribing to industry newsletters, following relevant companies and organizations, or regularly checking reputable industry news sources and publications.
Methodology
Step 1 - Identification of Relevant Samples Size from Population Database


Step 2 - Approaches for Defining Global Market Size (Value, Volume* & Price*)

Note*: In applicable scenarios
Step 3 - Data Sources
Primary Research
- Web Analytics
- Survey Reports
- Research Institute
- Latest Research Reports
- Opinion Leaders
Secondary Research
- Annual Reports
- White Paper
- Latest Press Release
- Industry Association
- Paid Database
- Investor Presentations

Step 4 - Data Triangulation
Involves using different sources of information in order to increase the validity of a study
These sources are likely to be stakeholders in a program - participants, other researchers, program staff, other community members, and so on.
Then we put all data in single framework & apply various statistical tools to find out the dynamic on the market.
During the analysis stage, feedback from the stakeholder groups would be compared to determine areas of agreement as well as areas of divergence