

Key Insights
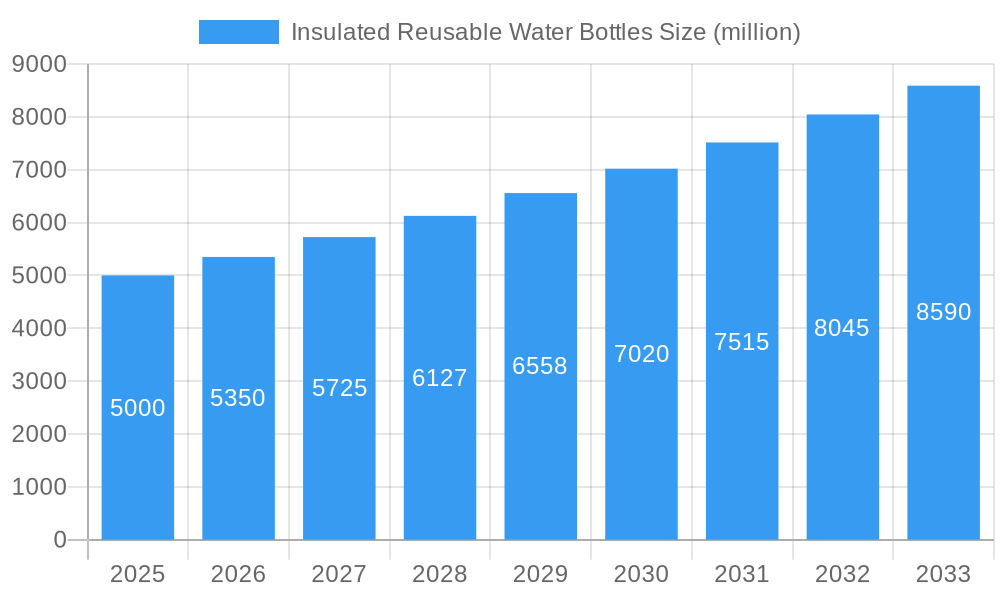
The insulated reusable water bottle market is experiencing significant expansion, propelled by growing environmental consciousness and a focus on personal hydration. The market, valued at $11.06 billion in the base year 2025, is forecasted to grow at a Compound Annual Growth Rate (CAGR) of 4.76% from 2025 to 2033, reaching an estimated value of $16.06 billion by 2033. This growth is attributed to several factors: the increasing adoption of sustainable alternatives to single-use plastics by environmentally aware consumers; a heightened emphasis on health and wellness driving demand for effective hydration solutions; the rising popularity of outdoor pursuits and fitness activities, necessitating portable and durable hydration options; and the continuous introduction of innovative designs with advanced insulation and aesthetic appeal. Leading manufacturers are capitalizing on these trends through product innovation and strategic marketing to enhance brand recognition and market reach.
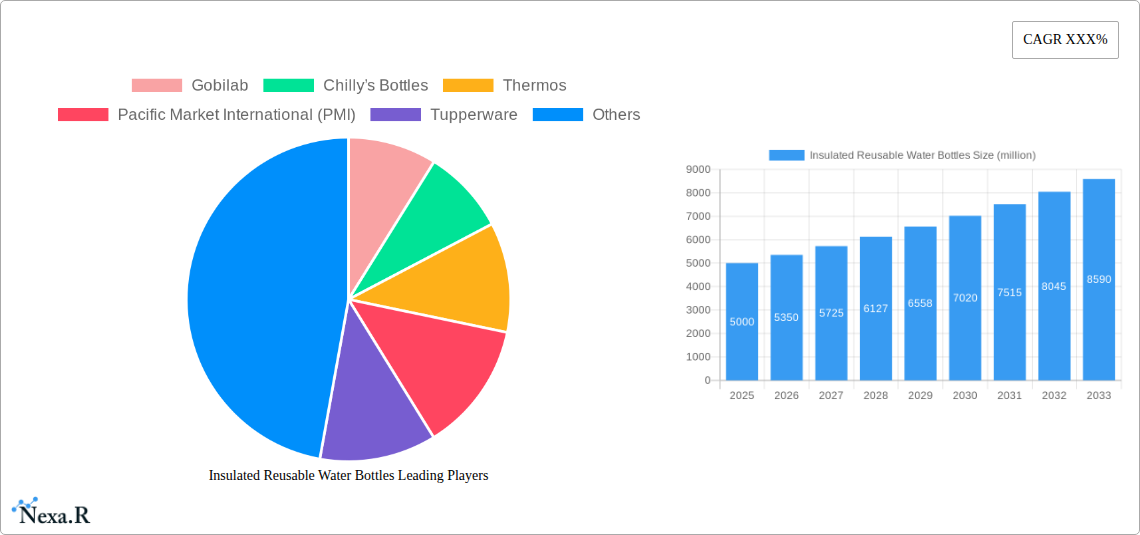
Insulated Reusable Water Bottles Market Size (In Billion)
Despite the positive outlook, market constraints exist. Price sensitivity, particularly in emerging economies, may impact widespread adoption. The highly competitive market demands constant innovation and robust marketing efforts to retain and grow market share. Additionally, considerations regarding the durability and potential material degradation of certain insulated bottle types may present challenges. Nevertheless, the persistent consumer demand for convenient, eco-friendly, and high-performance hydration solutions supports a favorable long-term market trajectory. Effective market segmentation, considering materials, price points, and design features, is vital for understanding consumer preferences and refining product development. Expanding into emerging markets with increasing consumer spending power offers substantial growth prospects for manufacturers.
Insulated Reusable Water Bottles Company Market Share
Insulated Reusable Water Bottles Market Report: 2019-2033
This comprehensive report provides an in-depth analysis of the Insulated Reusable Water Bottles market, encompassing market dynamics, growth trends, regional dominance, product landscape, challenges, opportunities, and key players. The study period covers 2019-2033, with a base year of 2025 and a forecast period of 2025-2033. The report leverages extensive primary and secondary research to deliver actionable insights for industry professionals, investors, and strategic decision-makers. The market is segmented by material (stainless steel, plastic, etc.), capacity, price range, distribution channel (online, offline), and end-user (individual consumers, corporate clients, sports enthusiasts). Parent market is considered as the broader water bottles market and child market is the segment of insulated reusable water bottles within the broader market. Market size is predicted in million units.
Insulated Reusable Water Bottles Market Dynamics & Structure
This section analyzes the competitive landscape, technological advancements, and regulatory influences shaping the Insulated Reusable Water Bottles market. The market, valued at xx million units in 2024, is experiencing moderate consolidation, with key players focusing on innovation and brand building.
- Market Concentration: The market exhibits a moderately concentrated structure, with the top 10 players holding an estimated xx% market share in 2024.
- Technological Innovation: Advancements in insulation technology (e.g., vacuum insulation, double-walled designs) are driving product differentiation and premium pricing. Innovation barriers include material sourcing and manufacturing complexities.
- Regulatory Frameworks: Regulations concerning material safety and sustainability (e.g., BPA-free certifications) are influencing product design and manufacturing processes.
- Competitive Substitutes: Traditional disposable water bottles and other hydration solutions (e.g., hydration packs) pose a competitive challenge.
- End-User Demographics: Growth is driven by health-conscious consumers, environmentally aware individuals, and athletes seeking reusable, convenient hydration solutions. The key demographic is millennials and Gen Z.
- M&A Trends: The past five years have witnessed xx M&A deals, predominantly focused on expanding product portfolios and geographical reach.
Insulated Reusable Water Bottles Growth Trends & Insights
The Insulated Reusable Water Bottles market has demonstrated robust growth over the historical period (2019-2024), with a CAGR of xx%. This growth is attributed to increasing consumer awareness of environmental sustainability and the health benefits of staying hydrated. Market penetration is estimated at xx% in 2024, indicating significant untapped potential. Technological disruptions, such as the introduction of smart water bottles with integrated sensors and tracking capabilities, are further driving market expansion. Changing consumer behavior, emphasizing convenience and portability, favors reusable options over disposable alternatives. The market size is projected to reach xx million units by 2033, exhibiting a CAGR of xx% during the forecast period (2025-2033).
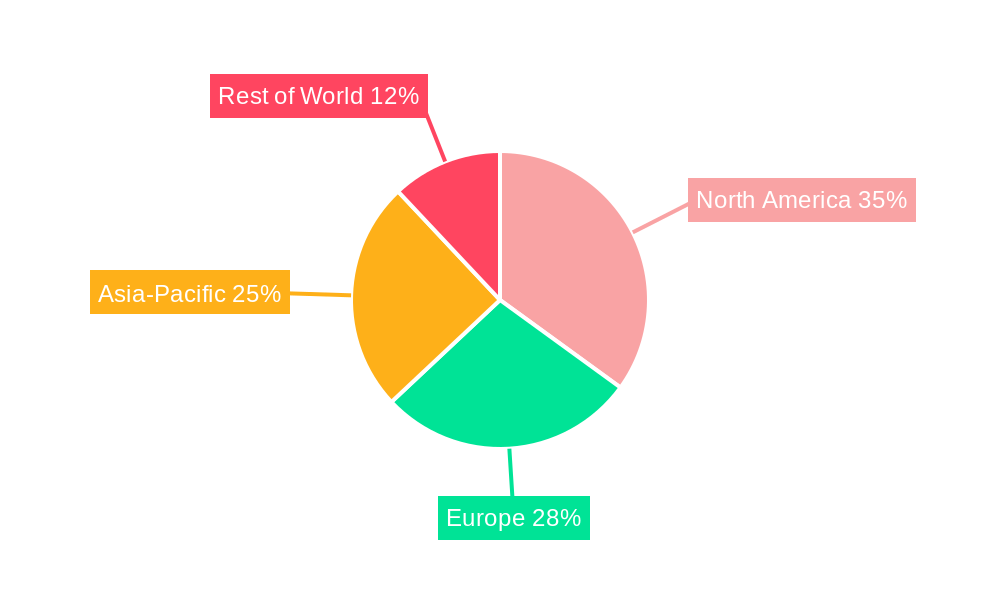
Dominant Regions, Countries, or Segments in Insulated Reusable Water Bottles
North America and Europe currently dominate the Insulated Reusable Water Bottles market, driven by high consumer disposable income, environmental consciousness, and strong brand presence. However, Asia-Pacific is exhibiting the fastest growth rate, fueled by increasing urbanization and rising health awareness.
- North America: High adoption rates, strong brand loyalty, and established distribution channels.
- Europe: Emphasis on sustainability and eco-friendly products drives market growth.
- Asia-Pacific: Rapid urbanization, rising disposable incomes, and growing environmental concerns create significant market potential.
- Key Drivers: Strong regulatory support for sustainable products in Europe and North America; increasing health consciousness and rising disposable incomes in Asia-Pacific.
Insulated Reusable Water Bottles Product Landscape
The Insulated Reusable Water Bottles market offers a diverse range of products, categorized by material (stainless steel, plastic, aluminum), capacity (ranging from small travel sizes to large-capacity options), features (insulation technology, leak-proof designs, carrying straps), and price points (budget-friendly to premium). Recent innovations include self-cleaning water bottles and bottles with integrated filters. Key selling propositions focus on durability, temperature retention, portability, and sustainability.
Key Drivers, Barriers & Challenges in Insulated Reusable Water Bottles
Key Drivers: Growing environmental awareness, health and wellness trends, increasing preference for reusable products over disposable alternatives, and technological advancements leading to enhanced product features.
Challenges: Intense competition, fluctuating raw material costs (e.g., stainless steel), potential supply chain disruptions, and consumer concerns regarding the longevity and durability of certain materials. Price sensitivity is also a significant challenge in developing economies.
Emerging Opportunities in Insulated Reusable Water Bottles
Emerging opportunities lie in exploring untapped markets in developing economies, developing innovative product features (e.g., smart bottle integration, customizable designs), and catering to specific niche segments (e.g., sports enthusiasts, outdoor adventurers). Customization options and eco-friendly materials will become crucial in attracting customers.
Growth Accelerators in the Insulated Reusable Water Bottles Industry
Strategic partnerships between brands and retailers, expanding distribution channels into emerging markets, and continuous product innovation (e.g., sustainable materials, advanced insulation technologies) will be key drivers of long-term growth. Investment in research and development to improve insulation technology and reduce manufacturing costs will also play a significant role.
Key Players Shaping the Insulated Reusable Water Bottles Market
- Gobilab
- Chilly’s Bottles
- Thermos
- Pacific Market International (PMI)
- Tupperware
- SIGG
- Klean Kanteen
- CamelBak
- Nalgene
- VitaJuwel
- Hydro Flask
- HydraPak
- Nathan Sport
- Platypus
Notable Milestones in Insulated Reusable Water Bottles Sector
- 2020: Increased focus on sustainable materials and manufacturing processes.
- 2021: Launch of several smart water bottles with integrated fitness trackers.
- 2022: Significant investments in R&D to improve insulation technology.
- 2023: Expansion of distribution networks into emerging markets.
- 2024: Several mergers and acquisitions to enhance market share.
In-Depth Insulated Reusable Water Bottles Market Outlook
The Insulated Reusable Water Bottles market is poised for continued growth, driven by ongoing consumer preference for sustainable and healthy lifestyle choices. Strategic investments in innovation, sustainable practices, and expanding distribution networks will be crucial for capturing market share and achieving long-term success. The market's potential is vast, with significant opportunities for growth in untapped markets and niche segments.
Insulated Reusable Water Bottles Segmentation
-
1. Application
- 1.1. Offline Store
- 1.2. Online Store
-
2. Type
- 2.1. Plastic Bottles
- 2.2. Glass Bottles
- 2.3. Others
Insulated Reusable Water Bottles Segmentation By Geography
-
1. North America
- 1.1. United States
- 1.2. Canada
- 1.3. Mexico
-
2. South America
- 2.1. Brazil
- 2.2. Argentina
- 2.3. Rest of South America
-
3. Europe
- 3.1. United Kingdom
- 3.2. Germany
- 3.3. France
- 3.4. Italy
- 3.5. Spain
- 3.6. Russia
- 3.7. Benelux
- 3.8. Nordics
- 3.9. Rest of Europe
-
4. Middle East & Africa
- 4.1. Turkey
- 4.2. Israel
- 4.3. GCC
- 4.4. North Africa
- 4.5. South Africa
- 4.6. Rest of Middle East & Africa
-
5. Asia Pacific
- 5.1. China
- 5.2. India
- 5.3. Japan
- 5.4. South Korea
- 5.5. ASEAN
- 5.6. Oceania
- 5.7. Rest of Asia Pacific
Insulated Reusable Water Bottles Regional Market Share
Geographic Coverage of Insulated Reusable Water Bottles
Insulated Reusable Water Bottles REPORT HIGHLIGHTS
| Aspects | Details |
|---|---|
| Study Period | 2020-2034 |
| Base Year | 2025 |
| Estimated Year | 2026 |
| Forecast Period | 2026-2034 |
| Historical Period | 2020-2025 |
| Growth Rate | CAGR of 4.76% from 2020-2034 |
| Segmentation |
|
Table of Contents
- 1. Introduction
- 1.1. Research Scope
- 1.2. Market Segmentation
- 1.3. Research Methodology
- 1.4. Definitions and Assumptions
- 2. Executive Summary
- 2.1. Introduction
- 3. Market Dynamics
- 3.1. Introduction
- 3.2. Market Drivers
- 3.3. Market Restrains
- 3.4. Market Trends
- 4. Market Factor Analysis
- 4.1. Porters Five Forces
- 4.2. Supply/Value Chain
- 4.3. PESTEL analysis
- 4.4. Market Entropy
- 4.5. Patent/Trademark Analysis
- 5. Global Insulated Reusable Water Bottles Analysis, Insights and Forecast, 2020-2032
- 5.1. Market Analysis, Insights and Forecast - by Application
- 5.1.1. Offline Store
- 5.1.2. Online Store
- 5.2. Market Analysis, Insights and Forecast - by Type
- 5.2.1. Plastic Bottles
- 5.2.2. Glass Bottles
- 5.2.3. Others
- 5.3. Market Analysis, Insights and Forecast - by Region
- 5.3.1. North America
- 5.3.2. South America
- 5.3.3. Europe
- 5.3.4. Middle East & Africa
- 5.3.5. Asia Pacific
- 5.1. Market Analysis, Insights and Forecast - by Application
- 6. North America Insulated Reusable Water Bottles Analysis, Insights and Forecast, 2020-2032
- 6.1. Market Analysis, Insights and Forecast - by Application
- 6.1.1. Offline Store
- 6.1.2. Online Store
- 6.2. Market Analysis, Insights and Forecast - by Type
- 6.2.1. Plastic Bottles
- 6.2.2. Glass Bottles
- 6.2.3. Others
- 6.1. Market Analysis, Insights and Forecast - by Application
- 7. South America Insulated Reusable Water Bottles Analysis, Insights and Forecast, 2020-2032
- 7.1. Market Analysis, Insights and Forecast - by Application
- 7.1.1. Offline Store
- 7.1.2. Online Store
- 7.2. Market Analysis, Insights and Forecast - by Type
- 7.2.1. Plastic Bottles
- 7.2.2. Glass Bottles
- 7.2.3. Others
- 7.1. Market Analysis, Insights and Forecast - by Application
- 8. Europe Insulated Reusable Water Bottles Analysis, Insights and Forecast, 2020-2032
- 8.1. Market Analysis, Insights and Forecast - by Application
- 8.1.1. Offline Store
- 8.1.2. Online Store
- 8.2. Market Analysis, Insights and Forecast - by Type
- 8.2.1. Plastic Bottles
- 8.2.2. Glass Bottles
- 8.2.3. Others
- 8.1. Market Analysis, Insights and Forecast - by Application
- 9. Middle East & Africa Insulated Reusable Water Bottles Analysis, Insights and Forecast, 2020-2032
- 9.1. Market Analysis, Insights and Forecast - by Application
- 9.1.1. Offline Store
- 9.1.2. Online Store
- 9.2. Market Analysis, Insights and Forecast - by Type
- 9.2.1. Plastic Bottles
- 9.2.2. Glass Bottles
- 9.2.3. Others
- 9.1. Market Analysis, Insights and Forecast - by Application
- 10. Asia Pacific Insulated Reusable Water Bottles Analysis, Insights and Forecast, 2020-2032
- 10.1. Market Analysis, Insights and Forecast - by Application
- 10.1.1. Offline Store
- 10.1.2. Online Store
- 10.2. Market Analysis, Insights and Forecast - by Type
- 10.2.1. Plastic Bottles
- 10.2.2. Glass Bottles
- 10.2.3. Others
- 10.1. Market Analysis, Insights and Forecast - by Application
- 11. Competitive Analysis
- 11.1. Global Market Share Analysis 2025
- 11.2. Company Profiles
- 11.2.1 Gobilab
- 11.2.1.1. Overview
- 11.2.1.2. Products
- 11.2.1.3. SWOT Analysis
- 11.2.1.4. Recent Developments
- 11.2.1.5. Financials (Based on Availability)
- 11.2.2 Chilly’s Bottles
- 11.2.2.1. Overview
- 11.2.2.2. Products
- 11.2.2.3. SWOT Analysis
- 11.2.2.4. Recent Developments
- 11.2.2.5. Financials (Based on Availability)
- 11.2.3 Thermos
- 11.2.3.1. Overview
- 11.2.3.2. Products
- 11.2.3.3. SWOT Analysis
- 11.2.3.4. Recent Developments
- 11.2.3.5. Financials (Based on Availability)
- 11.2.4 Pacific Market International (PMI)
- 11.2.4.1. Overview
- 11.2.4.2. Products
- 11.2.4.3. SWOT Analysis
- 11.2.4.4. Recent Developments
- 11.2.4.5. Financials (Based on Availability)
- 11.2.5 Tupperware
- 11.2.5.1. Overview
- 11.2.5.2. Products
- 11.2.5.3. SWOT Analysis
- 11.2.5.4. Recent Developments
- 11.2.5.5. Financials (Based on Availability)
- 11.2.6 SIGG
- 11.2.6.1. Overview
- 11.2.6.2. Products
- 11.2.6.3. SWOT Analysis
- 11.2.6.4. Recent Developments
- 11.2.6.5. Financials (Based on Availability)
- 11.2.7 Klean Kanteen
- 11.2.7.1. Overview
- 11.2.7.2. Products
- 11.2.7.3. SWOT Analysis
- 11.2.7.4. Recent Developments
- 11.2.7.5. Financials (Based on Availability)
- 11.2.8 CamelBak
- 11.2.8.1. Overview
- 11.2.8.2. Products
- 11.2.8.3. SWOT Analysis
- 11.2.8.4. Recent Developments
- 11.2.8.5. Financials (Based on Availability)
- 11.2.9 Nalgene
- 11.2.9.1. Overview
- 11.2.9.2. Products
- 11.2.9.3. SWOT Analysis
- 11.2.9.4. Recent Developments
- 11.2.9.5. Financials (Based on Availability)
- 11.2.10 VitaJuwel
- 11.2.10.1. Overview
- 11.2.10.2. Products
- 11.2.10.3. SWOT Analysis
- 11.2.10.4. Recent Developments
- 11.2.10.5. Financials (Based on Availability)
- 11.2.11 Hydro Flask
- 11.2.11.1. Overview
- 11.2.11.2. Products
- 11.2.11.3. SWOT Analysis
- 11.2.11.4. Recent Developments
- 11.2.11.5. Financials (Based on Availability)
- 11.2.12 HydraPak
- 11.2.12.1. Overview
- 11.2.12.2. Products
- 11.2.12.3. SWOT Analysis
- 11.2.12.4. Recent Developments
- 11.2.12.5. Financials (Based on Availability)
- 11.2.13 Nathan Sport
- 11.2.13.1. Overview
- 11.2.13.2. Products
- 11.2.13.3. SWOT Analysis
- 11.2.13.4. Recent Developments
- 11.2.13.5. Financials (Based on Availability)
- 11.2.14 Platypus
- 11.2.14.1. Overview
- 11.2.14.2. Products
- 11.2.14.3. SWOT Analysis
- 11.2.14.4. Recent Developments
- 11.2.14.5. Financials (Based on Availability)
- 11.2.1 Gobilab
List of Figures
- Figure 1: Global Insulated Reusable Water Bottles Revenue Breakdown (billion, %) by Region 2025 & 2033
- Figure 2: Global Insulated Reusable Water Bottles Volume Breakdown (K, %) by Region 2025 & 2033
- Figure 3: North America Insulated Reusable Water Bottles Revenue (billion), by Application 2025 & 2033
- Figure 4: North America Insulated Reusable Water Bottles Volume (K), by Application 2025 & 2033
- Figure 5: North America Insulated Reusable Water Bottles Revenue Share (%), by Application 2025 & 2033
- Figure 6: North America Insulated Reusable Water Bottles Volume Share (%), by Application 2025 & 2033
- Figure 7: North America Insulated Reusable Water Bottles Revenue (billion), by Type 2025 & 2033
- Figure 8: North America Insulated Reusable Water Bottles Volume (K), by Type 2025 & 2033
- Figure 9: North America Insulated Reusable Water Bottles Revenue Share (%), by Type 2025 & 2033
- Figure 10: North America Insulated Reusable Water Bottles Volume Share (%), by Type 2025 & 2033
- Figure 11: North America Insulated Reusable Water Bottles Revenue (billion), by Country 2025 & 2033
- Figure 12: North America Insulated Reusable Water Bottles Volume (K), by Country 2025 & 2033
- Figure 13: North America Insulated Reusable Water Bottles Revenue Share (%), by Country 2025 & 2033
- Figure 14: North America Insulated Reusable Water Bottles Volume Share (%), by Country 2025 & 2033
- Figure 15: South America Insulated Reusable Water Bottles Revenue (billion), by Application 2025 & 2033
- Figure 16: South America Insulated Reusable Water Bottles Volume (K), by Application 2025 & 2033
- Figure 17: South America Insulated Reusable Water Bottles Revenue Share (%), by Application 2025 & 2033
- Figure 18: South America Insulated Reusable Water Bottles Volume Share (%), by Application 2025 & 2033
- Figure 19: South America Insulated Reusable Water Bottles Revenue (billion), by Type 2025 & 2033
- Figure 20: South America Insulated Reusable Water Bottles Volume (K), by Type 2025 & 2033
- Figure 21: South America Insulated Reusable Water Bottles Revenue Share (%), by Type 2025 & 2033
- Figure 22: South America Insulated Reusable Water Bottles Volume Share (%), by Type 2025 & 2033
- Figure 23: South America Insulated Reusable Water Bottles Revenue (billion), by Country 2025 & 2033
- Figure 24: South America Insulated Reusable Water Bottles Volume (K), by Country 2025 & 2033
- Figure 25: South America Insulated Reusable Water Bottles Revenue Share (%), by Country 2025 & 2033
- Figure 26: South America Insulated Reusable Water Bottles Volume Share (%), by Country 2025 & 2033
- Figure 27: Europe Insulated Reusable Water Bottles Revenue (billion), by Application 2025 & 2033
- Figure 28: Europe Insulated Reusable Water Bottles Volume (K), by Application 2025 & 2033
- Figure 29: Europe Insulated Reusable Water Bottles Revenue Share (%), by Application 2025 & 2033
- Figure 30: Europe Insulated Reusable Water Bottles Volume Share (%), by Application 2025 & 2033
- Figure 31: Europe Insulated Reusable Water Bottles Revenue (billion), by Type 2025 & 2033
- Figure 32: Europe Insulated Reusable Water Bottles Volume (K), by Type 2025 & 2033
- Figure 33: Europe Insulated Reusable Water Bottles Revenue Share (%), by Type 2025 & 2033
- Figure 34: Europe Insulated Reusable Water Bottles Volume Share (%), by Type 2025 & 2033
- Figure 35: Europe Insulated Reusable Water Bottles Revenue (billion), by Country 2025 & 2033
- Figure 36: Europe Insulated Reusable Water Bottles Volume (K), by Country 2025 & 2033
- Figure 37: Europe Insulated Reusable Water Bottles Revenue Share (%), by Country 2025 & 2033
- Figure 38: Europe Insulated Reusable Water Bottles Volume Share (%), by Country 2025 & 2033
- Figure 39: Middle East & Africa Insulated Reusable Water Bottles Revenue (billion), by Application 2025 & 2033
- Figure 40: Middle East & Africa Insulated Reusable Water Bottles Volume (K), by Application 2025 & 2033
- Figure 41: Middle East & Africa Insulated Reusable Water Bottles Revenue Share (%), by Application 2025 & 2033
- Figure 42: Middle East & Africa Insulated Reusable Water Bottles Volume Share (%), by Application 2025 & 2033
- Figure 43: Middle East & Africa Insulated Reusable Water Bottles Revenue (billion), by Type 2025 & 2033
- Figure 44: Middle East & Africa Insulated Reusable Water Bottles Volume (K), by Type 2025 & 2033
- Figure 45: Middle East & Africa Insulated Reusable Water Bottles Revenue Share (%), by Type 2025 & 2033
- Figure 46: Middle East & Africa Insulated Reusable Water Bottles Volume Share (%), by Type 2025 & 2033
- Figure 47: Middle East & Africa Insulated Reusable Water Bottles Revenue (billion), by Country 2025 & 2033
- Figure 48: Middle East & Africa Insulated Reusable Water Bottles Volume (K), by Country 2025 & 2033
- Figure 49: Middle East & Africa Insulated Reusable Water Bottles Revenue Share (%), by Country 2025 & 2033
- Figure 50: Middle East & Africa Insulated Reusable Water Bottles Volume Share (%), by Country 2025 & 2033
- Figure 51: Asia Pacific Insulated Reusable Water Bottles Revenue (billion), by Application 2025 & 2033
- Figure 52: Asia Pacific Insulated Reusable Water Bottles Volume (K), by Application 2025 & 2033
- Figure 53: Asia Pacific Insulated Reusable Water Bottles Revenue Share (%), by Application 2025 & 2033
- Figure 54: Asia Pacific Insulated Reusable Water Bottles Volume Share (%), by Application 2025 & 2033
- Figure 55: Asia Pacific Insulated Reusable Water Bottles Revenue (billion), by Type 2025 & 2033
- Figure 56: Asia Pacific Insulated Reusable Water Bottles Volume (K), by Type 2025 & 2033
- Figure 57: Asia Pacific Insulated Reusable Water Bottles Revenue Share (%), by Type 2025 & 2033
- Figure 58: Asia Pacific Insulated Reusable Water Bottles Volume Share (%), by Type 2025 & 2033
- Figure 59: Asia Pacific Insulated Reusable Water Bottles Revenue (billion), by Country 2025 & 2033
- Figure 60: Asia Pacific Insulated Reusable Water Bottles Volume (K), by Country 2025 & 2033
- Figure 61: Asia Pacific Insulated Reusable Water Bottles Revenue Share (%), by Country 2025 & 2033
- Figure 62: Asia Pacific Insulated Reusable Water Bottles Volume Share (%), by Country 2025 & 2033
List of Tables
- Table 1: Global Insulated Reusable Water Bottles Revenue billion Forecast, by Application 2020 & 2033
- Table 2: Global Insulated Reusable Water Bottles Volume K Forecast, by Application 2020 & 2033
- Table 3: Global Insulated Reusable Water Bottles Revenue billion Forecast, by Type 2020 & 2033
- Table 4: Global Insulated Reusable Water Bottles Volume K Forecast, by Type 2020 & 2033
- Table 5: Global Insulated Reusable Water Bottles Revenue billion Forecast, by Region 2020 & 2033
- Table 6: Global Insulated Reusable Water Bottles Volume K Forecast, by Region 2020 & 2033
- Table 7: Global Insulated Reusable Water Bottles Revenue billion Forecast, by Application 2020 & 2033
- Table 8: Global Insulated Reusable Water Bottles Volume K Forecast, by Application 2020 & 2033
- Table 9: Global Insulated Reusable Water Bottles Revenue billion Forecast, by Type 2020 & 2033
- Table 10: Global Insulated Reusable Water Bottles Volume K Forecast, by Type 2020 & 2033
- Table 11: Global Insulated Reusable Water Bottles Revenue billion Forecast, by Country 2020 & 2033
- Table 12: Global Insulated Reusable Water Bottles Volume K Forecast, by Country 2020 & 2033
- Table 13: United States Insulated Reusable Water Bottles Revenue (billion) Forecast, by Application 2020 & 2033
- Table 14: United States Insulated Reusable Water Bottles Volume (K) Forecast, by Application 2020 & 2033
- Table 15: Canada Insulated Reusable Water Bottles Revenue (billion) Forecast, by Application 2020 & 2033
- Table 16: Canada Insulated Reusable Water Bottles Volume (K) Forecast, by Application 2020 & 2033
- Table 17: Mexico Insulated Reusable Water Bottles Revenue (billion) Forecast, by Application 2020 & 2033
- Table 18: Mexico Insulated Reusable Water Bottles Volume (K) Forecast, by Application 2020 & 2033
- Table 19: Global Insulated Reusable Water Bottles Revenue billion Forecast, by Application 2020 & 2033
- Table 20: Global Insulated Reusable Water Bottles Volume K Forecast, by Application 2020 & 2033
- Table 21: Global Insulated Reusable Water Bottles Revenue billion Forecast, by Type 2020 & 2033
- Table 22: Global Insulated Reusable Water Bottles Volume K Forecast, by Type 2020 & 2033
- Table 23: Global Insulated Reusable Water Bottles Revenue billion Forecast, by Country 2020 & 2033
- Table 24: Global Insulated Reusable Water Bottles Volume K Forecast, by Country 2020 & 2033
- Table 25: Brazil Insulated Reusable Water Bottles Revenue (billion) Forecast, by Application 2020 & 2033
- Table 26: Brazil Insulated Reusable Water Bottles Volume (K) Forecast, by Application 2020 & 2033
- Table 27: Argentina Insulated Reusable Water Bottles Revenue (billion) Forecast, by Application 2020 & 2033
- Table 28: Argentina Insulated Reusable Water Bottles Volume (K) Forecast, by Application 2020 & 2033
- Table 29: Rest of South America Insulated Reusable Water Bottles Revenue (billion) Forecast, by Application 2020 & 2033
- Table 30: Rest of South America Insulated Reusable Water Bottles Volume (K) Forecast, by Application 2020 & 2033
- Table 31: Global Insulated Reusable Water Bottles Revenue billion Forecast, by Application 2020 & 2033
- Table 32: Global Insulated Reusable Water Bottles Volume K Forecast, by Application 2020 & 2033
- Table 33: Global Insulated Reusable Water Bottles Revenue billion Forecast, by Type 2020 & 2033
- Table 34: Global Insulated Reusable Water Bottles Volume K Forecast, by Type 2020 & 2033
- Table 35: Global Insulated Reusable Water Bottles Revenue billion Forecast, by Country 2020 & 2033
- Table 36: Global Insulated Reusable Water Bottles Volume K Forecast, by Country 2020 & 2033
- Table 37: United Kingdom Insulated Reusable Water Bottles Revenue (billion) Forecast, by Application 2020 & 2033
- Table 38: United Kingdom Insulated Reusable Water Bottles Volume (K) Forecast, by Application 2020 & 2033
- Table 39: Germany Insulated Reusable Water Bottles Revenue (billion) Forecast, by Application 2020 & 2033
- Table 40: Germany Insulated Reusable Water Bottles Volume (K) Forecast, by Application 2020 & 2033
- Table 41: France Insulated Reusable Water Bottles Revenue (billion) Forecast, by Application 2020 & 2033
- Table 42: France Insulated Reusable Water Bottles Volume (K) Forecast, by Application 2020 & 2033
- Table 43: Italy Insulated Reusable Water Bottles Revenue (billion) Forecast, by Application 2020 & 2033
- Table 44: Italy Insulated Reusable Water Bottles Volume (K) Forecast, by Application 2020 & 2033
- Table 45: Spain Insulated Reusable Water Bottles Revenue (billion) Forecast, by Application 2020 & 2033
- Table 46: Spain Insulated Reusable Water Bottles Volume (K) Forecast, by Application 2020 & 2033
- Table 47: Russia Insulated Reusable Water Bottles Revenue (billion) Forecast, by Application 2020 & 2033
- Table 48: Russia Insulated Reusable Water Bottles Volume (K) Forecast, by Application 2020 & 2033
- Table 49: Benelux Insulated Reusable Water Bottles Revenue (billion) Forecast, by Application 2020 & 2033
- Table 50: Benelux Insulated Reusable Water Bottles Volume (K) Forecast, by Application 2020 & 2033
- Table 51: Nordics Insulated Reusable Water Bottles Revenue (billion) Forecast, by Application 2020 & 2033
- Table 52: Nordics Insulated Reusable Water Bottles Volume (K) Forecast, by Application 2020 & 2033
- Table 53: Rest of Europe Insulated Reusable Water Bottles Revenue (billion) Forecast, by Application 2020 & 2033
- Table 54: Rest of Europe Insulated Reusable Water Bottles Volume (K) Forecast, by Application 2020 & 2033
- Table 55: Global Insulated Reusable Water Bottles Revenue billion Forecast, by Application 2020 & 2033
- Table 56: Global Insulated Reusable Water Bottles Volume K Forecast, by Application 2020 & 2033
- Table 57: Global Insulated Reusable Water Bottles Revenue billion Forecast, by Type 2020 & 2033
- Table 58: Global Insulated Reusable Water Bottles Volume K Forecast, by Type 2020 & 2033
- Table 59: Global Insulated Reusable Water Bottles Revenue billion Forecast, by Country 2020 & 2033
- Table 60: Global Insulated Reusable Water Bottles Volume K Forecast, by Country 2020 & 2033
- Table 61: Turkey Insulated Reusable Water Bottles Revenue (billion) Forecast, by Application 2020 & 2033
- Table 62: Turkey Insulated Reusable Water Bottles Volume (K) Forecast, by Application 2020 & 2033
- Table 63: Israel Insulated Reusable Water Bottles Revenue (billion) Forecast, by Application 2020 & 2033
- Table 64: Israel Insulated Reusable Water Bottles Volume (K) Forecast, by Application 2020 & 2033
- Table 65: GCC Insulated Reusable Water Bottles Revenue (billion) Forecast, by Application 2020 & 2033
- Table 66: GCC Insulated Reusable Water Bottles Volume (K) Forecast, by Application 2020 & 2033
- Table 67: North Africa Insulated Reusable Water Bottles Revenue (billion) Forecast, by Application 2020 & 2033
- Table 68: North Africa Insulated Reusable Water Bottles Volume (K) Forecast, by Application 2020 & 2033
- Table 69: South Africa Insulated Reusable Water Bottles Revenue (billion) Forecast, by Application 2020 & 2033
- Table 70: South Africa Insulated Reusable Water Bottles Volume (K) Forecast, by Application 2020 & 2033
- Table 71: Rest of Middle East & Africa Insulated Reusable Water Bottles Revenue (billion) Forecast, by Application 2020 & 2033
- Table 72: Rest of Middle East & Africa Insulated Reusable Water Bottles Volume (K) Forecast, by Application 2020 & 2033
- Table 73: Global Insulated Reusable Water Bottles Revenue billion Forecast, by Application 2020 & 2033
- Table 74: Global Insulated Reusable Water Bottles Volume K Forecast, by Application 2020 & 2033
- Table 75: Global Insulated Reusable Water Bottles Revenue billion Forecast, by Type 2020 & 2033
- Table 76: Global Insulated Reusable Water Bottles Volume K Forecast, by Type 2020 & 2033
- Table 77: Global Insulated Reusable Water Bottles Revenue billion Forecast, by Country 2020 & 2033
- Table 78: Global Insulated Reusable Water Bottles Volume K Forecast, by Country 2020 & 2033
- Table 79: China Insulated Reusable Water Bottles Revenue (billion) Forecast, by Application 2020 & 2033
- Table 80: China Insulated Reusable Water Bottles Volume (K) Forecast, by Application 2020 & 2033
- Table 81: India Insulated Reusable Water Bottles Revenue (billion) Forecast, by Application 2020 & 2033
- Table 82: India Insulated Reusable Water Bottles Volume (K) Forecast, by Application 2020 & 2033
- Table 83: Japan Insulated Reusable Water Bottles Revenue (billion) Forecast, by Application 2020 & 2033
- Table 84: Japan Insulated Reusable Water Bottles Volume (K) Forecast, by Application 2020 & 2033
- Table 85: South Korea Insulated Reusable Water Bottles Revenue (billion) Forecast, by Application 2020 & 2033
- Table 86: South Korea Insulated Reusable Water Bottles Volume (K) Forecast, by Application 2020 & 2033
- Table 87: ASEAN Insulated Reusable Water Bottles Revenue (billion) Forecast, by Application 2020 & 2033
- Table 88: ASEAN Insulated Reusable Water Bottles Volume (K) Forecast, by Application 2020 & 2033
- Table 89: Oceania Insulated Reusable Water Bottles Revenue (billion) Forecast, by Application 2020 & 2033
- Table 90: Oceania Insulated Reusable Water Bottles Volume (K) Forecast, by Application 2020 & 2033
- Table 91: Rest of Asia Pacific Insulated Reusable Water Bottles Revenue (billion) Forecast, by Application 2020 & 2033
- Table 92: Rest of Asia Pacific Insulated Reusable Water Bottles Volume (K) Forecast, by Application 2020 & 2033
Frequently Asked Questions
1. What is the projected Compound Annual Growth Rate (CAGR) of the Insulated Reusable Water Bottles?
The projected CAGR is approximately 4.76%.
2. Which companies are prominent players in the Insulated Reusable Water Bottles?
Key companies in the market include Gobilab, Chilly’s Bottles, Thermos, Pacific Market International (PMI), Tupperware, SIGG, Klean Kanteen, CamelBak, Nalgene, VitaJuwel, Hydro Flask, HydraPak, Nathan Sport, Platypus.
3. What are the main segments of the Insulated Reusable Water Bottles?
The market segments include Application, Type.
4. Can you provide details about the market size?
The market size is estimated to be USD 11.06 billion as of 2022.
5. What are some drivers contributing to market growth?
N/A
6. What are the notable trends driving market growth?
N/A
7. Are there any restraints impacting market growth?
N/A
8. Can you provide examples of recent developments in the market?
N/A
9. What pricing options are available for accessing the report?
Pricing options include single-user, multi-user, and enterprise licenses priced at USD 3950.00, USD 5925.00, and USD 7900.00 respectively.
10. Is the market size provided in terms of value or volume?
The market size is provided in terms of value, measured in billion and volume, measured in K.
11. Are there any specific market keywords associated with the report?
Yes, the market keyword associated with the report is "Insulated Reusable Water Bottles," which aids in identifying and referencing the specific market segment covered.
12. How do I determine which pricing option suits my needs best?
The pricing options vary based on user requirements and access needs. Individual users may opt for single-user licenses, while businesses requiring broader access may choose multi-user or enterprise licenses for cost-effective access to the report.
13. Are there any additional resources or data provided in the Insulated Reusable Water Bottles report?
While the report offers comprehensive insights, it's advisable to review the specific contents or supplementary materials provided to ascertain if additional resources or data are available.
14. How can I stay updated on further developments or reports in the Insulated Reusable Water Bottles?
To stay informed about further developments, trends, and reports in the Insulated Reusable Water Bottles, consider subscribing to industry newsletters, following relevant companies and organizations, or regularly checking reputable industry news sources and publications.
Methodology
Step 1 - Identification of Relevant Samples Size from Population Database


Step 2 - Approaches for Defining Global Market Size (Value, Volume* & Price*)

Note*: In applicable scenarios
Step 3 - Data Sources
Primary Research
- Web Analytics
- Survey Reports
- Research Institute
- Latest Research Reports
- Opinion Leaders
Secondary Research
- Annual Reports
- White Paper
- Latest Press Release
- Industry Association
- Paid Database
- Investor Presentations

Step 4 - Data Triangulation
Involves using different sources of information in order to increase the validity of a study
These sources are likely to be stakeholders in a program - participants, other researchers, program staff, other community members, and so on.
Then we put all data in single framework & apply various statistical tools to find out the dynamic on the market.
During the analysis stage, feedback from the stakeholder groups would be compared to determine areas of agreement as well as areas of divergence