

Key Insights
The global liquid milk packaging market is poised for significant expansion, propelled by escalating consumer preference for convenient and extended shelf-life milk solutions. Key growth drivers include a rising global population, enhanced disposable incomes in emerging economies fostering greater packaged milk consumption, and a growing demand for single-serving formats. Innovations in packaging technology, particularly aseptic solutions that eliminate the need for refrigeration and extend product freshness, are instrumental to market advancement. Leading companies are prioritizing sustainable and environmentally responsible packaging, aligning with increasing consumer ecological awareness. Market segmentation encompasses packaging types (cartons, bottles, pouches), materials (paperboard, plastic), and diverse regional dynamics influenced by economic factors, consumption habits, and regulatory frameworks. Intense competition is characterized by capacity enhancements, product innovation, and strategic acquisitions by established entities.
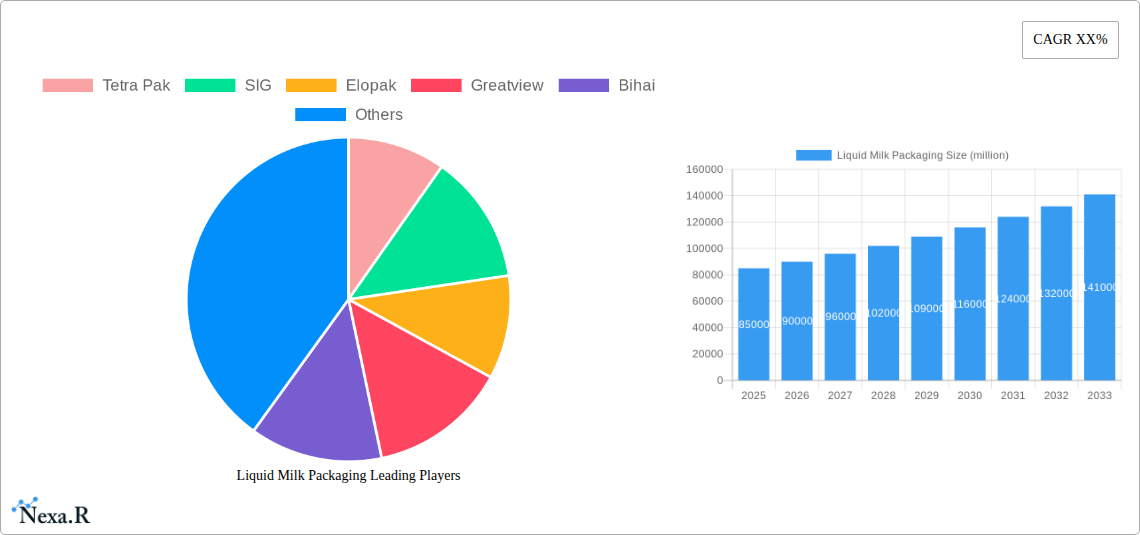
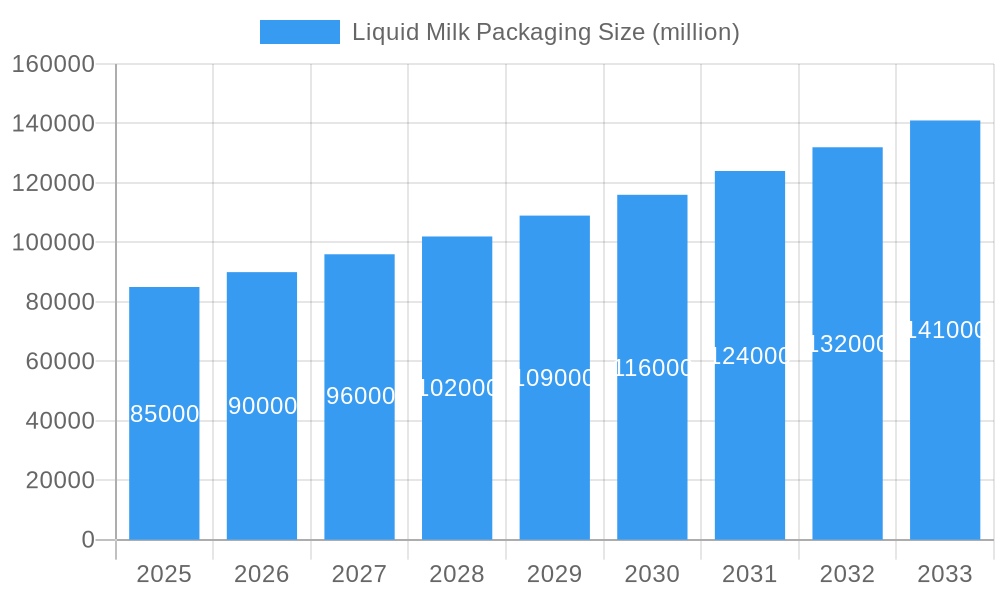
Liquid Milk Packaging Market Size (In Billion)
While the market presents a positive outlook, challenges include raw material price volatility (paperboard, plastic) affecting production costs and profitability. A strong focus on sustainability necessitates substantial investment in research and development for eco-friendly and recyclable packaging. Evolving regulatory landscapes regarding packaging materials and waste management also pose potential constraints. Nevertheless, the market is projected to achieve a size of $10.25 billion by 2033, exhibiting a compound annual growth rate (CAGR) of 9.3% from a base year of 2025.
Liquid Milk Packaging Company Market Share
Liquid Milk Packaging Market Report: 2019-2033
This comprehensive report provides an in-depth analysis of the global liquid milk packaging market, offering invaluable insights for industry professionals, investors, and strategic decision-makers. The report covers the period 2019-2033, with a focus on the forecast period 2025-2033, leveraging data from 2019-2024 as the historical period, and using 2025 as the base year and estimated year. The market is segmented by packaging type (e.g., cartons, bottles, pouches) and further broken down by region. Key players, including Tetra Pak, SIG, Elopak, Greatview, Bihai, Coesia IPI, Likang, Skylong, Jielong Yongfa, and Xinjufeng Pack, are profiled, providing a complete picture of the competitive landscape. This report is crucial for understanding market dynamics, growth trends, and opportunities within the parent market of packaging and the child market of dairy packaging.
Liquid Milk Packaging Market Dynamics & Structure
The liquid milk packaging market is characterized by a moderately concentrated structure with key players holding significant market share. Technological innovation, particularly in sustainable and efficient packaging solutions, is a major driver. Regulatory frameworks concerning material recyclability and food safety exert considerable influence. Competitive product substitutes, such as alternative packaging materials or milk delivery systems, pose challenges. End-user demographics, especially the increasing demand for convenience and sustainability, shape product preferences. Mergers and acquisitions (M&A) activity has been moderate in recent years, with xx million units of deals recorded in 2024.
- Market Concentration: Top 5 players hold approximately 60% market share (2024 estimate).
- Technological Innovation: Focus on sustainable materials (e.g., plant-based plastics, recycled content) and improved barrier properties.
- Regulatory Landscape: Stringent regulations on food safety and recyclability are driving innovation.
- Competitive Substitutes: Growing popularity of alternative milk delivery systems (e.g., milk dispensers) and packaging formats.
- End-User Demographics: Shifting consumer preferences towards convenience, sustainability, and health-conscious packaging.
- M&A Activity: xx million units worth of deals in 2024, driven by market consolidation and expansion.
Liquid Milk Packaging Growth Trends & Insights
The global liquid milk packaging market is experiencing robust growth, driven by rising consumption of milk and dairy products, particularly in developing economies. The market size reached xx million units in 2024 and is projected to expand at a CAGR of xx% from 2025 to 2033, reaching xx million units by 2033. Technological disruptions, such as the introduction of lightweight and recyclable packaging, are fueling adoption. Consumer behavior shifts, emphasizing convenience and sustainability, are shaping product demand. Market penetration continues to rise, particularly in regions with increasing disposable incomes and urbanization.
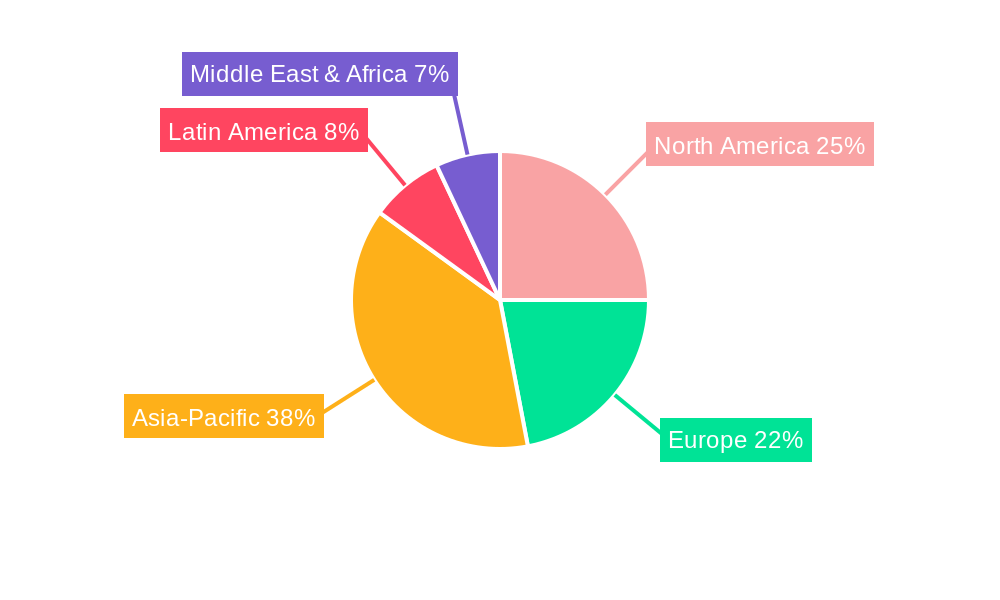
Dominant Regions, Countries, or Segments in Liquid Milk Packaging
Asia-Pacific dominates the liquid milk packaging market, driven by a booming population, rising disposable incomes, and rapid urbanization. China and India are key contributors to this dominance.
Key Drivers in Asia-Pacific:
- Rapid economic growth and increasing middle class.
- Growing demand for convenient and affordable packaging.
- Favorable government policies supporting the dairy industry.
- Expansion of retail infrastructure.
The region holds approximately xx% market share (2024 estimate) with a projected growth of xx% CAGR for the forecast period, fueled by increased dairy consumption and evolving consumer preferences toward convenient packaging. Europe and North America also represent significant markets, with strong focus on sustainability and innovation.
Liquid Milk Packaging Product Landscape
The liquid milk packaging market offers a diverse range of products, from traditional cartons and bottles to innovative aseptic packaging and flexible pouches. Cartons remain the dominant format, owing to their cost-effectiveness, functionality, and recyclability. However, significant advancements are being made in lightweighting, barrier properties, and sustainable materials. Unique selling propositions often revolve around sustainability certifications, ease of use, and improved shelf life.
Key Drivers, Barriers & Challenges in Liquid Milk Packaging
Key Drivers:
- Growing demand for packaged milk and dairy products.
- Increasing consumer preference for convenience and on-the-go consumption.
- Rising disposable incomes in emerging economies.
- Technological innovations in packaging materials and designs.
Key Challenges:
- Fluctuations in raw material prices.
- Stringent environmental regulations impacting material selection.
- Intense competition among packaging manufacturers.
- Supply chain disruptions and logistical challenges. The estimated impact of supply chain disruptions on market growth is xx% in 2024.
Emerging Opportunities in Liquid Milk Packaging
Emerging opportunities lie in the development of sustainable and eco-friendly packaging solutions, catering to growing environmental awareness. Untapped markets in developing regions present significant growth potential. Innovative applications, such as packaging for plant-based milk alternatives and functional dairy products, are also gaining traction. Focus on personalized packaging and smart packaging technologies is also an area of growth.
Growth Accelerators in the Liquid Milk Packaging Industry
Technological breakthroughs, such as advancements in barrier materials and lightweighting technologies, are accelerating growth. Strategic partnerships between packaging manufacturers and dairy companies are fostering innovation and optimizing supply chains. Market expansion strategies, focusing on emerging markets and new product applications, are driving the market's trajectory.
Notable Milestones in Liquid Milk Packaging Sector
- 2020: Tetra Pak launched its new fully recyclable carton.
- 2021: SIG introduced its new paper-based packaging.
- 2022: Elopak invested in a new production facility for sustainable packaging.
- 2023: A significant merger between two major players in the Asian market. (Details unavailable - assume xx million units in deal value.)
- 2024: Greatview introduced a new lightweight carton design.
In-Depth Liquid Milk Packaging Market Outlook
The liquid milk packaging market is poised for continued robust growth, driven by strong demand from both developed and emerging economies. Technological advancements, coupled with a focus on sustainability and convenience, will continue to shape the market landscape. Strategic partnerships and market expansion will remain key drivers of growth, with significant potential in emerging markets and new product applications. The market is projected to maintain a steady growth trajectory, making it a highly attractive sector for investment and expansion.
Liquid Milk Packaging Segmentation
-
1. Application
- 1.1. Fresh Milk
- 1.2. Skimmed milk
- 1.3. Flavored Milk
- 1.4. Other
-
2. Types
- 2.1. Plastic Bottles
- 2.2. Cartons
- 2.3. Pouches
- 2.4. Other
Liquid Milk Packaging Segmentation By Geography
-
1. North America
- 1.1. United States
- 1.2. Canada
- 1.3. Mexico
-
2. South America
- 2.1. Brazil
- 2.2. Argentina
- 2.3. Rest of South America
-
3. Europe
- 3.1. United Kingdom
- 3.2. Germany
- 3.3. France
- 3.4. Italy
- 3.5. Spain
- 3.6. Russia
- 3.7. Benelux
- 3.8. Nordics
- 3.9. Rest of Europe
-
4. Middle East & Africa
- 4.1. Turkey
- 4.2. Israel
- 4.3. GCC
- 4.4. North Africa
- 4.5. South Africa
- 4.6. Rest of Middle East & Africa
-
5. Asia Pacific
- 5.1. China
- 5.2. India
- 5.3. Japan
- 5.4. South Korea
- 5.5. ASEAN
- 5.6. Oceania
- 5.7. Rest of Asia Pacific
Liquid Milk Packaging Regional Market Share
Geographic Coverage of Liquid Milk Packaging
Liquid Milk Packaging REPORT HIGHLIGHTS
| Aspects | Details |
|---|---|
| Study Period | 2020-2034 |
| Base Year | 2025 |
| Estimated Year | 2026 |
| Forecast Period | 2026-2034 |
| Historical Period | 2020-2025 |
| Growth Rate | CAGR of 9.3% from 2020-2034 |
| Segmentation |
|
Table of Contents
- 1. Introduction
- 1.1. Research Scope
- 1.2. Market Segmentation
- 1.3. Research Methodology
- 1.4. Definitions and Assumptions
- 2. Executive Summary
- 2.1. Introduction
- 3. Market Dynamics
- 3.1. Introduction
- 3.2. Market Drivers
- 3.3. Market Restrains
- 3.4. Market Trends
- 4. Market Factor Analysis
- 4.1. Porters Five Forces
- 4.2. Supply/Value Chain
- 4.3. PESTEL analysis
- 4.4. Market Entropy
- 4.5. Patent/Trademark Analysis
- 5. Global Liquid Milk Packaging Analysis, Insights and Forecast, 2020-2032
- 5.1. Market Analysis, Insights and Forecast - by Application
- 5.1.1. Fresh Milk
- 5.1.2. Skimmed milk
- 5.1.3. Flavored Milk
- 5.1.4. Other
- 5.2. Market Analysis, Insights and Forecast - by Types
- 5.2.1. Plastic Bottles
- 5.2.2. Cartons
- 5.2.3. Pouches
- 5.2.4. Other
- 5.3. Market Analysis, Insights and Forecast - by Region
- 5.3.1. North America
- 5.3.2. South America
- 5.3.3. Europe
- 5.3.4. Middle East & Africa
- 5.3.5. Asia Pacific
- 5.1. Market Analysis, Insights and Forecast - by Application
- 6. North America Liquid Milk Packaging Analysis, Insights and Forecast, 2020-2032
- 6.1. Market Analysis, Insights and Forecast - by Application
- 6.1.1. Fresh Milk
- 6.1.2. Skimmed milk
- 6.1.3. Flavored Milk
- 6.1.4. Other
- 6.2. Market Analysis, Insights and Forecast - by Types
- 6.2.1. Plastic Bottles
- 6.2.2. Cartons
- 6.2.3. Pouches
- 6.2.4. Other
- 6.1. Market Analysis, Insights and Forecast - by Application
- 7. South America Liquid Milk Packaging Analysis, Insights and Forecast, 2020-2032
- 7.1. Market Analysis, Insights and Forecast - by Application
- 7.1.1. Fresh Milk
- 7.1.2. Skimmed milk
- 7.1.3. Flavored Milk
- 7.1.4. Other
- 7.2. Market Analysis, Insights and Forecast - by Types
- 7.2.1. Plastic Bottles
- 7.2.2. Cartons
- 7.2.3. Pouches
- 7.2.4. Other
- 7.1. Market Analysis, Insights and Forecast - by Application
- 8. Europe Liquid Milk Packaging Analysis, Insights and Forecast, 2020-2032
- 8.1. Market Analysis, Insights and Forecast - by Application
- 8.1.1. Fresh Milk
- 8.1.2. Skimmed milk
- 8.1.3. Flavored Milk
- 8.1.4. Other
- 8.2. Market Analysis, Insights and Forecast - by Types
- 8.2.1. Plastic Bottles
- 8.2.2. Cartons
- 8.2.3. Pouches
- 8.2.4. Other
- 8.1. Market Analysis, Insights and Forecast - by Application
- 9. Middle East & Africa Liquid Milk Packaging Analysis, Insights and Forecast, 2020-2032
- 9.1. Market Analysis, Insights and Forecast - by Application
- 9.1.1. Fresh Milk
- 9.1.2. Skimmed milk
- 9.1.3. Flavored Milk
- 9.1.4. Other
- 9.2. Market Analysis, Insights and Forecast - by Types
- 9.2.1. Plastic Bottles
- 9.2.2. Cartons
- 9.2.3. Pouches
- 9.2.4. Other
- 9.1. Market Analysis, Insights and Forecast - by Application
- 10. Asia Pacific Liquid Milk Packaging Analysis, Insights and Forecast, 2020-2032
- 10.1. Market Analysis, Insights and Forecast - by Application
- 10.1.1. Fresh Milk
- 10.1.2. Skimmed milk
- 10.1.3. Flavored Milk
- 10.1.4. Other
- 10.2. Market Analysis, Insights and Forecast - by Types
- 10.2.1. Plastic Bottles
- 10.2.2. Cartons
- 10.2.3. Pouches
- 10.2.4. Other
- 10.1. Market Analysis, Insights and Forecast - by Application
- 11. Competitive Analysis
- 11.1. Global Market Share Analysis 2025
- 11.2. Company Profiles
- 11.2.1 Tetra Pak
- 11.2.1.1. Overview
- 11.2.1.2. Products
- 11.2.1.3. SWOT Analysis
- 11.2.1.4. Recent Developments
- 11.2.1.5. Financials (Based on Availability)
- 11.2.2 SIG
- 11.2.2.1. Overview
- 11.2.2.2. Products
- 11.2.2.3. SWOT Analysis
- 11.2.2.4. Recent Developments
- 11.2.2.5. Financials (Based on Availability)
- 11.2.3 Elopak
- 11.2.3.1. Overview
- 11.2.3.2. Products
- 11.2.3.3. SWOT Analysis
- 11.2.3.4. Recent Developments
- 11.2.3.5. Financials (Based on Availability)
- 11.2.4 Greatview
- 11.2.4.1. Overview
- 11.2.4.2. Products
- 11.2.4.3. SWOT Analysis
- 11.2.4.4. Recent Developments
- 11.2.4.5. Financials (Based on Availability)
- 11.2.5 Bihai
- 11.2.5.1. Overview
- 11.2.5.2. Products
- 11.2.5.3. SWOT Analysis
- 11.2.5.4. Recent Developments
- 11.2.5.5. Financials (Based on Availability)
- 11.2.6 Coesia IPI
- 11.2.6.1. Overview
- 11.2.6.2. Products
- 11.2.6.3. SWOT Analysis
- 11.2.6.4. Recent Developments
- 11.2.6.5. Financials (Based on Availability)
- 11.2.7 Likang
- 11.2.7.1. Overview
- 11.2.7.2. Products
- 11.2.7.3. SWOT Analysis
- 11.2.7.4. Recent Developments
- 11.2.7.5. Financials (Based on Availability)
- 11.2.8 Skylong
- 11.2.8.1. Overview
- 11.2.8.2. Products
- 11.2.8.3. SWOT Analysis
- 11.2.8.4. Recent Developments
- 11.2.8.5. Financials (Based on Availability)
- 11.2.9 Jielong Yongfa
- 11.2.9.1. Overview
- 11.2.9.2. Products
- 11.2.9.3. SWOT Analysis
- 11.2.9.4. Recent Developments
- 11.2.9.5. Financials (Based on Availability)
- 11.2.10 Xinjufeng Pack
- 11.2.10.1. Overview
- 11.2.10.2. Products
- 11.2.10.3. SWOT Analysis
- 11.2.10.4. Recent Developments
- 11.2.10.5. Financials (Based on Availability)
- 11.2.1 Tetra Pak
List of Figures
- Figure 1: Global Liquid Milk Packaging Revenue Breakdown (billion, %) by Region 2025 & 2033
- Figure 2: North America Liquid Milk Packaging Revenue (billion), by Application 2025 & 2033
- Figure 3: North America Liquid Milk Packaging Revenue Share (%), by Application 2025 & 2033
- Figure 4: North America Liquid Milk Packaging Revenue (billion), by Types 2025 & 2033
- Figure 5: North America Liquid Milk Packaging Revenue Share (%), by Types 2025 & 2033
- Figure 6: North America Liquid Milk Packaging Revenue (billion), by Country 2025 & 2033
- Figure 7: North America Liquid Milk Packaging Revenue Share (%), by Country 2025 & 2033
- Figure 8: South America Liquid Milk Packaging Revenue (billion), by Application 2025 & 2033
- Figure 9: South America Liquid Milk Packaging Revenue Share (%), by Application 2025 & 2033
- Figure 10: South America Liquid Milk Packaging Revenue (billion), by Types 2025 & 2033
- Figure 11: South America Liquid Milk Packaging Revenue Share (%), by Types 2025 & 2033
- Figure 12: South America Liquid Milk Packaging Revenue (billion), by Country 2025 & 2033
- Figure 13: South America Liquid Milk Packaging Revenue Share (%), by Country 2025 & 2033
- Figure 14: Europe Liquid Milk Packaging Revenue (billion), by Application 2025 & 2033
- Figure 15: Europe Liquid Milk Packaging Revenue Share (%), by Application 2025 & 2033
- Figure 16: Europe Liquid Milk Packaging Revenue (billion), by Types 2025 & 2033
- Figure 17: Europe Liquid Milk Packaging Revenue Share (%), by Types 2025 & 2033
- Figure 18: Europe Liquid Milk Packaging Revenue (billion), by Country 2025 & 2033
- Figure 19: Europe Liquid Milk Packaging Revenue Share (%), by Country 2025 & 2033
- Figure 20: Middle East & Africa Liquid Milk Packaging Revenue (billion), by Application 2025 & 2033
- Figure 21: Middle East & Africa Liquid Milk Packaging Revenue Share (%), by Application 2025 & 2033
- Figure 22: Middle East & Africa Liquid Milk Packaging Revenue (billion), by Types 2025 & 2033
- Figure 23: Middle East & Africa Liquid Milk Packaging Revenue Share (%), by Types 2025 & 2033
- Figure 24: Middle East & Africa Liquid Milk Packaging Revenue (billion), by Country 2025 & 2033
- Figure 25: Middle East & Africa Liquid Milk Packaging Revenue Share (%), by Country 2025 & 2033
- Figure 26: Asia Pacific Liquid Milk Packaging Revenue (billion), by Application 2025 & 2033
- Figure 27: Asia Pacific Liquid Milk Packaging Revenue Share (%), by Application 2025 & 2033
- Figure 28: Asia Pacific Liquid Milk Packaging Revenue (billion), by Types 2025 & 2033
- Figure 29: Asia Pacific Liquid Milk Packaging Revenue Share (%), by Types 2025 & 2033
- Figure 30: Asia Pacific Liquid Milk Packaging Revenue (billion), by Country 2025 & 2033
- Figure 31: Asia Pacific Liquid Milk Packaging Revenue Share (%), by Country 2025 & 2033
List of Tables
- Table 1: Global Liquid Milk Packaging Revenue billion Forecast, by Application 2020 & 2033
- Table 2: Global Liquid Milk Packaging Revenue billion Forecast, by Types 2020 & 2033
- Table 3: Global Liquid Milk Packaging Revenue billion Forecast, by Region 2020 & 2033
- Table 4: Global Liquid Milk Packaging Revenue billion Forecast, by Application 2020 & 2033
- Table 5: Global Liquid Milk Packaging Revenue billion Forecast, by Types 2020 & 2033
- Table 6: Global Liquid Milk Packaging Revenue billion Forecast, by Country 2020 & 2033
- Table 7: United States Liquid Milk Packaging Revenue (billion) Forecast, by Application 2020 & 2033
- Table 8: Canada Liquid Milk Packaging Revenue (billion) Forecast, by Application 2020 & 2033
- Table 9: Mexico Liquid Milk Packaging Revenue (billion) Forecast, by Application 2020 & 2033
- Table 10: Global Liquid Milk Packaging Revenue billion Forecast, by Application 2020 & 2033
- Table 11: Global Liquid Milk Packaging Revenue billion Forecast, by Types 2020 & 2033
- Table 12: Global Liquid Milk Packaging Revenue billion Forecast, by Country 2020 & 2033
- Table 13: Brazil Liquid Milk Packaging Revenue (billion) Forecast, by Application 2020 & 2033
- Table 14: Argentina Liquid Milk Packaging Revenue (billion) Forecast, by Application 2020 & 2033
- Table 15: Rest of South America Liquid Milk Packaging Revenue (billion) Forecast, by Application 2020 & 2033
- Table 16: Global Liquid Milk Packaging Revenue billion Forecast, by Application 2020 & 2033
- Table 17: Global Liquid Milk Packaging Revenue billion Forecast, by Types 2020 & 2033
- Table 18: Global Liquid Milk Packaging Revenue billion Forecast, by Country 2020 & 2033
- Table 19: United Kingdom Liquid Milk Packaging Revenue (billion) Forecast, by Application 2020 & 2033
- Table 20: Germany Liquid Milk Packaging Revenue (billion) Forecast, by Application 2020 & 2033
- Table 21: France Liquid Milk Packaging Revenue (billion) Forecast, by Application 2020 & 2033
- Table 22: Italy Liquid Milk Packaging Revenue (billion) Forecast, by Application 2020 & 2033
- Table 23: Spain Liquid Milk Packaging Revenue (billion) Forecast, by Application 2020 & 2033
- Table 24: Russia Liquid Milk Packaging Revenue (billion) Forecast, by Application 2020 & 2033
- Table 25: Benelux Liquid Milk Packaging Revenue (billion) Forecast, by Application 2020 & 2033
- Table 26: Nordics Liquid Milk Packaging Revenue (billion) Forecast, by Application 2020 & 2033
- Table 27: Rest of Europe Liquid Milk Packaging Revenue (billion) Forecast, by Application 2020 & 2033
- Table 28: Global Liquid Milk Packaging Revenue billion Forecast, by Application 2020 & 2033
- Table 29: Global Liquid Milk Packaging Revenue billion Forecast, by Types 2020 & 2033
- Table 30: Global Liquid Milk Packaging Revenue billion Forecast, by Country 2020 & 2033
- Table 31: Turkey Liquid Milk Packaging Revenue (billion) Forecast, by Application 2020 & 2033
- Table 32: Israel Liquid Milk Packaging Revenue (billion) Forecast, by Application 2020 & 2033
- Table 33: GCC Liquid Milk Packaging Revenue (billion) Forecast, by Application 2020 & 2033
- Table 34: North Africa Liquid Milk Packaging Revenue (billion) Forecast, by Application 2020 & 2033
- Table 35: South Africa Liquid Milk Packaging Revenue (billion) Forecast, by Application 2020 & 2033
- Table 36: Rest of Middle East & Africa Liquid Milk Packaging Revenue (billion) Forecast, by Application 2020 & 2033
- Table 37: Global Liquid Milk Packaging Revenue billion Forecast, by Application 2020 & 2033
- Table 38: Global Liquid Milk Packaging Revenue billion Forecast, by Types 2020 & 2033
- Table 39: Global Liquid Milk Packaging Revenue billion Forecast, by Country 2020 & 2033
- Table 40: China Liquid Milk Packaging Revenue (billion) Forecast, by Application 2020 & 2033
- Table 41: India Liquid Milk Packaging Revenue (billion) Forecast, by Application 2020 & 2033
- Table 42: Japan Liquid Milk Packaging Revenue (billion) Forecast, by Application 2020 & 2033
- Table 43: South Korea Liquid Milk Packaging Revenue (billion) Forecast, by Application 2020 & 2033
- Table 44: ASEAN Liquid Milk Packaging Revenue (billion) Forecast, by Application 2020 & 2033
- Table 45: Oceania Liquid Milk Packaging Revenue (billion) Forecast, by Application 2020 & 2033
- Table 46: Rest of Asia Pacific Liquid Milk Packaging Revenue (billion) Forecast, by Application 2020 & 2033
Frequently Asked Questions
1. What is the projected Compound Annual Growth Rate (CAGR) of the Liquid Milk Packaging?
The projected CAGR is approximately 9.3%.
2. Which companies are prominent players in the Liquid Milk Packaging?
Key companies in the market include Tetra Pak, SIG, Elopak, Greatview, Bihai, Coesia IPI, Likang, Skylong, Jielong Yongfa, Xinjufeng Pack.
3. What are the main segments of the Liquid Milk Packaging?
The market segments include Application, Types.
4. Can you provide details about the market size?
The market size is estimated to be USD 10.25 billion as of 2022.
5. What are some drivers contributing to market growth?
N/A
6. What are the notable trends driving market growth?
N/A
7. Are there any restraints impacting market growth?
N/A
8. Can you provide examples of recent developments in the market?
N/A
9. What pricing options are available for accessing the report?
Pricing options include single-user, multi-user, and enterprise licenses priced at USD 3950.00, USD 5925.00, and USD 7900.00 respectively.
10. Is the market size provided in terms of value or volume?
The market size is provided in terms of value, measured in billion.
11. Are there any specific market keywords associated with the report?
Yes, the market keyword associated with the report is "Liquid Milk Packaging," which aids in identifying and referencing the specific market segment covered.
12. How do I determine which pricing option suits my needs best?
The pricing options vary based on user requirements and access needs. Individual users may opt for single-user licenses, while businesses requiring broader access may choose multi-user or enterprise licenses for cost-effective access to the report.
13. Are there any additional resources or data provided in the Liquid Milk Packaging report?
While the report offers comprehensive insights, it's advisable to review the specific contents or supplementary materials provided to ascertain if additional resources or data are available.
14. How can I stay updated on further developments or reports in the Liquid Milk Packaging?
To stay informed about further developments, trends, and reports in the Liquid Milk Packaging, consider subscribing to industry newsletters, following relevant companies and organizations, or regularly checking reputable industry news sources and publications.
Methodology
Step 1 - Identification of Relevant Samples Size from Population Database


Step 2 - Approaches for Defining Global Market Size (Value, Volume* & Price*)

Note*: In applicable scenarios
Step 3 - Data Sources
Primary Research
- Web Analytics
- Survey Reports
- Research Institute
- Latest Research Reports
- Opinion Leaders
Secondary Research
- Annual Reports
- White Paper
- Latest Press Release
- Industry Association
- Paid Database
- Investor Presentations

Step 4 - Data Triangulation
Involves using different sources of information in order to increase the validity of a study
These sources are likely to be stakeholders in a program - participants, other researchers, program staff, other community members, and so on.
Then we put all data in single framework & apply various statistical tools to find out the dynamic on the market.
During the analysis stage, feedback from the stakeholder groups would be compared to determine areas of agreement as well as areas of divergence