

Key Insights
The global moving blankets market is projected for robust expansion, driven by key industry dynamics. The market was valued at $8.6 billion in 2025 and is forecast to achieve a Compound Annual Growth Rate (CAGR) of 5.2% through 2033. This growth is primarily fueled by the expanding logistics and relocation sectors, significantly influenced by e-commerce proliferation and increasing urbanization. The demand for effective and protective packaging solutions within the moving and storage industry further propels market growth. A notable trend is the increasing adoption of reusable and eco-friendly moving blankets, reflecting heightened environmental consciousness among consumers and businesses. However, market growth is moderated by challenges such as fluctuating raw material costs and competition from alternative protective materials. The market is segmented, featuring both large-scale manufacturers and specialized regional suppliers. Leading companies are employing innovation and strategic branding to secure market positions. Geographically, North America and Europe dominate, with the Asia-Pacific region showing substantial growth potential.
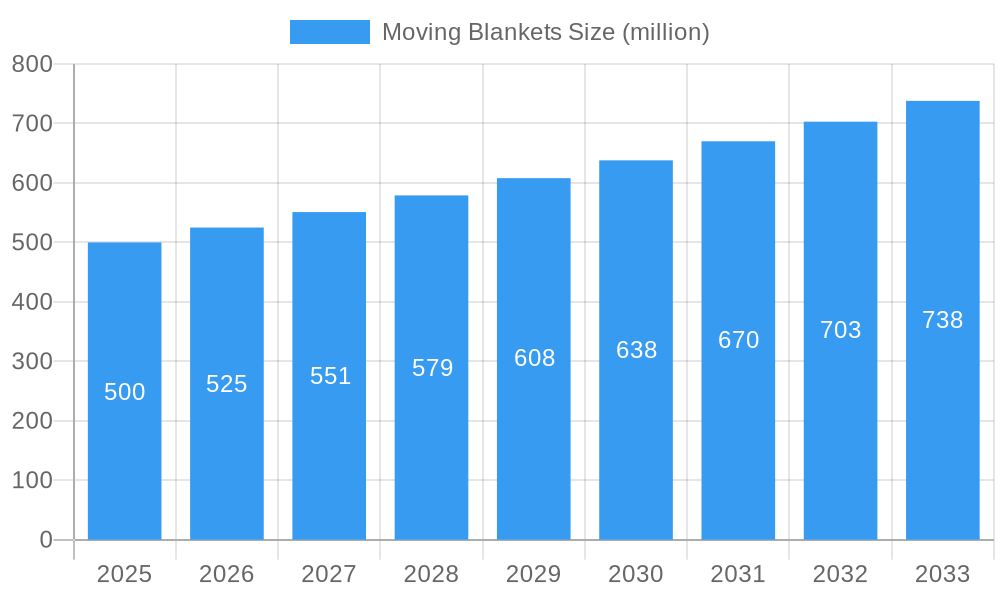
Moving Blankets Market Size (In Billion)
Looking ahead, the market is expected to reach significant new heights, driven by continued e-commerce expansion, increased international relocations, and a sustained focus on sustainable packaging. Strategic collaborations between manufacturers and moving companies are anticipated to improve market penetration. To navigate the competitive environment successfully, manufacturers must remain agile in responding to evolving consumer demands and stringent environmental regulations. Effective marketing that emphasizes the durability, reusability, and cost-efficiency of moving blankets over single-use alternatives will be critical for sustained growth. Innovation in materials and manufacturing processes aimed at cost reduction and efficiency enhancement will serve as key competitive differentiators.
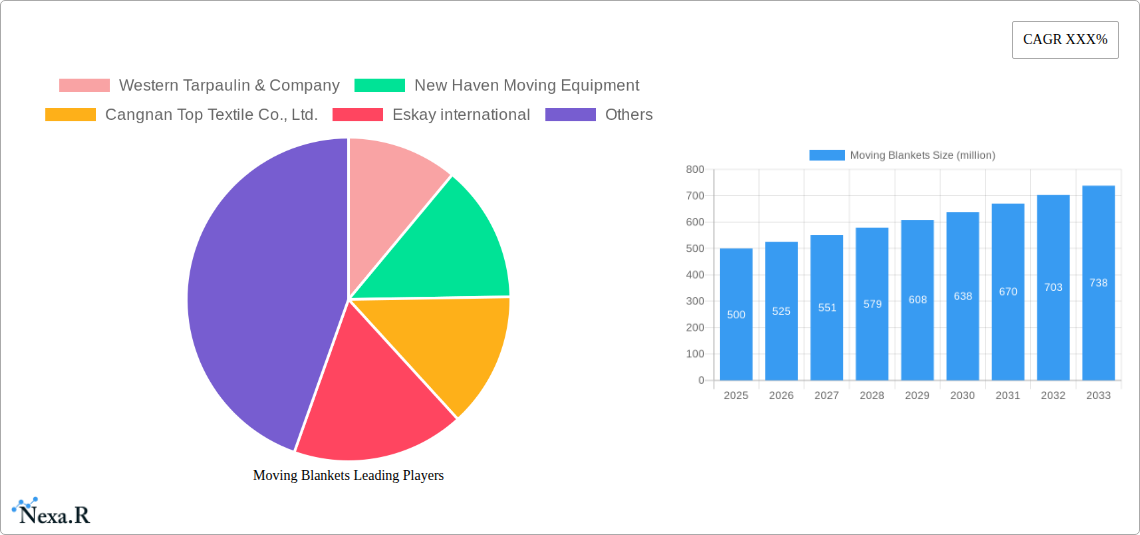
Moving Blankets Company Market Share
Moving Blankets Market Report: A Comprehensive Analysis (2019-2033)
This comprehensive report provides a detailed analysis of the global moving blankets market, encompassing market dynamics, growth trends, regional performance, competitive landscape, and future outlook. The study period covers 2019-2033, with 2025 as the base and estimated year. This report is crucial for industry professionals, investors, and businesses seeking to understand and capitalize on opportunities within this dynamic sector. The report utilizes data from various sources to paint a complete and in-depth picture of this growing market. This report is valued at xx million units.
Moving Blankets Market Dynamics & Structure
This section analyzes the structure and dynamics of the global moving blankets market, encompassing market concentration, technological advancements, regulatory landscapes, competitive substitutes, end-user demographics, and merger & acquisition (M&A) activities. The market is moderately fragmented, with several key players competing alongside numerous smaller regional players.
- Market Concentration: The global moving blankets market exhibits a moderately fragmented structure, with a Herfindahl-Hirschman Index (HHI) of xx. The top 5 players collectively hold approximately xx% of the market share in 2024.
- Technological Innovation: Innovation focuses on improved materials (e.g., stronger, lighter fabrics; enhanced water resistance), sustainable production methods, and innovative designs for easier handling and storage. However, high initial investment costs act as a barrier for smaller players.
- Regulatory Framework: Regulations concerning material safety, labeling, and transportation standards vary across regions. Compliance costs significantly impact smaller companies more.
- Competitive Substitutes: Alternatives include bubble wrap, air pillows, and custom-fitted furniture covers. These substitutes pose a moderate threat, particularly in niche segments.
- End-User Demographics: Key end-users include professional movers, residential customers, and businesses relocating offices or equipment. Growth is driven by increasing urbanization, rising disposable incomes, and the e-commerce boom (increasing home deliveries).
- M&A Trends: The past five years have witnessed xx M&A deals in the moving blankets sector, primarily focused on expanding geographical reach and product portfolios. xx% of these deals involved companies with annual revenues exceeding $xx million.
Moving Blankets Growth Trends & Insights
The global moving blankets market is experiencing substantial growth, driven by several key factors including increasing urbanization, rising disposable incomes, and a booming e-commerce sector that fuels the need for efficient and safe packaging solutions. This section analyzes the market size evolution, adoption rates, technological disruptions, and consumer behavior shifts. The market is projected to expand at a Compound Annual Growth Rate (CAGR) of xx% from 2025 to 2033, reaching xx million units by 2033. Market penetration in developed countries is high, while developing regions present significant growth opportunities. Technological advancements such as improved materials and designs are accelerating adoption rates and improving consumer satisfaction.
Dominant Regions, Countries, or Segments in Moving Blankets
North America currently holds the largest market share in the moving blankets sector, followed by Europe and Asia-Pacific. This dominance is attributed to high disposable incomes, a robust logistics industry, and a well-established moving and relocation market.
- North America: High consumer spending on home relocation and robust e-commerce sector.
- Europe: Stable economy, well-developed logistics infrastructure, and stringent regulatory compliance drive market growth.
- Asia-Pacific: Rapid urbanization, expanding middle class, and increasing cross-border e-commerce shipments fuel market expansion.
This section provides a deeper analysis of these regions, including specific market share data, growth drivers, and potential challenges. The Asia-Pacific region demonstrates the highest growth potential due to its expanding middle class and increasing urbanization.
Moving Blankets Product Landscape
The moving blankets market offers a variety of products, ranging from basic quilted blankets to specialized options with features like reinforced stitching, water resistance, and anti-static properties. Innovations include lighter, more durable materials and designs optimized for ease of use and storage. These advancements focus on improving protection, convenience, and sustainability. Unique selling propositions include superior protection against damage, improved ease of use, and eco-friendly materials.
Key Drivers, Barriers & Challenges in Moving Blankets
Key Drivers: The increasing volume of goods transported, growth in e-commerce, and urbanization are key drivers. Government regulations promoting sustainable packaging practices also contribute positively.
Key Barriers & Challenges: Fluctuations in raw material prices, competition from substitute products, and the complexity of global supply chains pose significant challenges. High initial investment for technological upgrades is a barrier to entry for smaller players. This results in supply chain disruptions and increased production costs.
Emerging Opportunities in Moving Blankets
Emerging opportunities include the expansion into untapped markets (especially in developing economies), the development of specialized moving blankets for specific goods (e.g., electronics, furniture), and the incorporation of smart technologies for enhanced tracking and protection. The focus on sustainability through recycled and biodegradable materials also presents a significant growth area.
Growth Accelerators in the Moving Blankets Industry
Technological advancements, strategic partnerships (e.g., between blanket manufacturers and logistics companies), and expansion into new geographical markets are key growth accelerators. Focus on customized solutions tailored to specific customer needs is a crucial element driving market expansion.
Key Players Shaping the Moving Blankets Market
- Western Tarpaulin & Company
- New Haven Moving Equipment
- Cangnan Top Textile Co., Ltd.
- Eskay international
Notable Milestones in Moving Blankets Sector
- 2020: Introduction of a new range of eco-friendly moving blankets by Cangnan Top Textile Co., Ltd.
- 2022: Western Tarpaulin & Company acquired a smaller competitor, expanding its market share in the US.
- 2023: Eskay International launched a new line of reusable, durable moving blankets.
- 2024: New Haven Moving Equipment invested in advanced production technology to increase efficiency.
In-Depth Moving Blankets Market Outlook
The moving blankets market is poised for sustained growth driven by ongoing urbanization, the boom in e-commerce, and a growing awareness of the need for safe and efficient packaging solutions. Strategic partnerships, investment in research & development, and expansion into new markets represent significant opportunities for businesses operating within this sector. Further focus on sustainable manufacturing and customized solutions will shape the market's future trajectory.
Moving Blankets Segmentation
-
1. Application
- 1.1. Professional Movers
- 1.2. Van Operators
- 1.3. Carpenters and Cabinet Makers
- 1.4. Others
-
2. Type
- 2.1. Cotton/Poly Blends
- 2.2. Woven Polyester
- 2.3. Non-woven Polyester
Moving Blankets Segmentation By Geography
-
1. North America
- 1.1. United States
- 1.2. Canada
- 1.3. Mexico
-
2. South America
- 2.1. Brazil
- 2.2. Argentina
- 2.3. Rest of South America
-
3. Europe
- 3.1. United Kingdom
- 3.2. Germany
- 3.3. France
- 3.4. Italy
- 3.5. Spain
- 3.6. Russia
- 3.7. Benelux
- 3.8. Nordics
- 3.9. Rest of Europe
-
4. Middle East & Africa
- 4.1. Turkey
- 4.2. Israel
- 4.3. GCC
- 4.4. North Africa
- 4.5. South Africa
- 4.6. Rest of Middle East & Africa
-
5. Asia Pacific
- 5.1. China
- 5.2. India
- 5.3. Japan
- 5.4. South Korea
- 5.5. ASEAN
- 5.6. Oceania
- 5.7. Rest of Asia Pacific

Moving Blankets Regional Market Share
Geographic Coverage of Moving Blankets
Moving Blankets REPORT HIGHLIGHTS
| Aspects | Details |
|---|---|
| Study Period | 2020-2034 |
| Base Year | 2025 |
| Estimated Year | 2026 |
| Forecast Period | 2026-2034 |
| Historical Period | 2020-2025 |
| Growth Rate | CAGR of 5.2% from 2020-2034 |
| Segmentation |
|
Table of Contents
- 1. Introduction
- 1.1. Research Scope
- 1.2. Market Segmentation
- 1.3. Research Methodology
- 1.4. Definitions and Assumptions
- 2. Executive Summary
- 2.1. Introduction
- 3. Market Dynamics
- 3.1. Introduction
- 3.2. Market Drivers
- 3.3. Market Restrains
- 3.4. Market Trends
- 4. Market Factor Analysis
- 4.1. Porters Five Forces
- 4.2. Supply/Value Chain
- 4.3. PESTEL analysis
- 4.4. Market Entropy
- 4.5. Patent/Trademark Analysis
- 5. Global Moving Blankets Analysis, Insights and Forecast, 2020-2032
- 5.1. Market Analysis, Insights and Forecast - by Application
- 5.1.1. Professional Movers
- 5.1.2. Van Operators
- 5.1.3. Carpenters and Cabinet Makers
- 5.1.4. Others
- 5.2. Market Analysis, Insights and Forecast - by Type
- 5.2.1. Cotton/Poly Blends
- 5.2.2. Woven Polyester
- 5.2.3. Non-woven Polyester
- 5.3. Market Analysis, Insights and Forecast - by Region
- 5.3.1. North America
- 5.3.2. South America
- 5.3.3. Europe
- 5.3.4. Middle East & Africa
- 5.3.5. Asia Pacific
- 5.1. Market Analysis, Insights and Forecast - by Application
- 6. North America Moving Blankets Analysis, Insights and Forecast, 2020-2032
- 6.1. Market Analysis, Insights and Forecast - by Application
- 6.1.1. Professional Movers
- 6.1.2. Van Operators
- 6.1.3. Carpenters and Cabinet Makers
- 6.1.4. Others
- 6.2. Market Analysis, Insights and Forecast - by Type
- 6.2.1. Cotton/Poly Blends
- 6.2.2. Woven Polyester
- 6.2.3. Non-woven Polyester
- 6.1. Market Analysis, Insights and Forecast - by Application
- 7. South America Moving Blankets Analysis, Insights and Forecast, 2020-2032
- 7.1. Market Analysis, Insights and Forecast - by Application
- 7.1.1. Professional Movers
- 7.1.2. Van Operators
- 7.1.3. Carpenters and Cabinet Makers
- 7.1.4. Others
- 7.2. Market Analysis, Insights and Forecast - by Type
- 7.2.1. Cotton/Poly Blends
- 7.2.2. Woven Polyester
- 7.2.3. Non-woven Polyester
- 7.1. Market Analysis, Insights and Forecast - by Application
- 8. Europe Moving Blankets Analysis, Insights and Forecast, 2020-2032
- 8.1. Market Analysis, Insights and Forecast - by Application
- 8.1.1. Professional Movers
- 8.1.2. Van Operators
- 8.1.3. Carpenters and Cabinet Makers
- 8.1.4. Others
- 8.2. Market Analysis, Insights and Forecast - by Type
- 8.2.1. Cotton/Poly Blends
- 8.2.2. Woven Polyester
- 8.2.3. Non-woven Polyester
- 8.1. Market Analysis, Insights and Forecast - by Application
- 9. Middle East & Africa Moving Blankets Analysis, Insights and Forecast, 2020-2032
- 9.1. Market Analysis, Insights and Forecast - by Application
- 9.1.1. Professional Movers
- 9.1.2. Van Operators
- 9.1.3. Carpenters and Cabinet Makers
- 9.1.4. Others
- 9.2. Market Analysis, Insights and Forecast - by Type
- 9.2.1. Cotton/Poly Blends
- 9.2.2. Woven Polyester
- 9.2.3. Non-woven Polyester
- 9.1. Market Analysis, Insights and Forecast - by Application
- 10. Asia Pacific Moving Blankets Analysis, Insights and Forecast, 2020-2032
- 10.1. Market Analysis, Insights and Forecast - by Application
- 10.1.1. Professional Movers
- 10.1.2. Van Operators
- 10.1.3. Carpenters and Cabinet Makers
- 10.1.4. Others
- 10.2. Market Analysis, Insights and Forecast - by Type
- 10.2.1. Cotton/Poly Blends
- 10.2.2. Woven Polyester
- 10.2.3. Non-woven Polyester
- 10.1. Market Analysis, Insights and Forecast - by Application
- 11. Competitive Analysis
- 11.1. Global Market Share Analysis 2025
- 11.2. Company Profiles
- 11.2.1 Western Tarpaulin & Company
- 11.2.1.1. Overview
- 11.2.1.2. Products
- 11.2.1.3. SWOT Analysis
- 11.2.1.4. Recent Developments
- 11.2.1.5. Financials (Based on Availability)
- 11.2.2 New Haven Moving Equipment
- 11.2.2.1. Overview
- 11.2.2.2. Products
- 11.2.2.3. SWOT Analysis
- 11.2.2.4. Recent Developments
- 11.2.2.5. Financials (Based on Availability)
- 11.2.3 Cangnan Top Textile Co. Ltd.
- 11.2.3.1. Overview
- 11.2.3.2. Products
- 11.2.3.3. SWOT Analysis
- 11.2.3.4. Recent Developments
- 11.2.3.5. Financials (Based on Availability)
- 11.2.4 Eskay international
- 11.2.4.1. Overview
- 11.2.4.2. Products
- 11.2.4.3. SWOT Analysis
- 11.2.4.4. Recent Developments
- 11.2.4.5. Financials (Based on Availability)
- 11.2.1 Western Tarpaulin & Company
List of Figures
- Figure 1: Global Moving Blankets Revenue Breakdown (billion, %) by Region 2025 & 2033
- Figure 2: Global Moving Blankets Volume Breakdown (K, %) by Region 2025 & 2033
- Figure 3: North America Moving Blankets Revenue (billion), by Application 2025 & 2033
- Figure 4: North America Moving Blankets Volume (K), by Application 2025 & 2033
- Figure 5: North America Moving Blankets Revenue Share (%), by Application 2025 & 2033
- Figure 6: North America Moving Blankets Volume Share (%), by Application 2025 & 2033
- Figure 7: North America Moving Blankets Revenue (billion), by Type 2025 & 2033
- Figure 8: North America Moving Blankets Volume (K), by Type 2025 & 2033
- Figure 9: North America Moving Blankets Revenue Share (%), by Type 2025 & 2033
- Figure 10: North America Moving Blankets Volume Share (%), by Type 2025 & 2033
- Figure 11: North America Moving Blankets Revenue (billion), by Country 2025 & 2033
- Figure 12: North America Moving Blankets Volume (K), by Country 2025 & 2033
- Figure 13: North America Moving Blankets Revenue Share (%), by Country 2025 & 2033
- Figure 14: North America Moving Blankets Volume Share (%), by Country 2025 & 2033
- Figure 15: South America Moving Blankets Revenue (billion), by Application 2025 & 2033
- Figure 16: South America Moving Blankets Volume (K), by Application 2025 & 2033
- Figure 17: South America Moving Blankets Revenue Share (%), by Application 2025 & 2033
- Figure 18: South America Moving Blankets Volume Share (%), by Application 2025 & 2033
- Figure 19: South America Moving Blankets Revenue (billion), by Type 2025 & 2033
- Figure 20: South America Moving Blankets Volume (K), by Type 2025 & 2033
- Figure 21: South America Moving Blankets Revenue Share (%), by Type 2025 & 2033
- Figure 22: South America Moving Blankets Volume Share (%), by Type 2025 & 2033
- Figure 23: South America Moving Blankets Revenue (billion), by Country 2025 & 2033
- Figure 24: South America Moving Blankets Volume (K), by Country 2025 & 2033
- Figure 25: South America Moving Blankets Revenue Share (%), by Country 2025 & 2033
- Figure 26: South America Moving Blankets Volume Share (%), by Country 2025 & 2033
- Figure 27: Europe Moving Blankets Revenue (billion), by Application 2025 & 2033
- Figure 28: Europe Moving Blankets Volume (K), by Application 2025 & 2033
- Figure 29: Europe Moving Blankets Revenue Share (%), by Application 2025 & 2033
- Figure 30: Europe Moving Blankets Volume Share (%), by Application 2025 & 2033
- Figure 31: Europe Moving Blankets Revenue (billion), by Type 2025 & 2033
- Figure 32: Europe Moving Blankets Volume (K), by Type 2025 & 2033
- Figure 33: Europe Moving Blankets Revenue Share (%), by Type 2025 & 2033
- Figure 34: Europe Moving Blankets Volume Share (%), by Type 2025 & 2033
- Figure 35: Europe Moving Blankets Revenue (billion), by Country 2025 & 2033
- Figure 36: Europe Moving Blankets Volume (K), by Country 2025 & 2033
- Figure 37: Europe Moving Blankets Revenue Share (%), by Country 2025 & 2033
- Figure 38: Europe Moving Blankets Volume Share (%), by Country 2025 & 2033
- Figure 39: Middle East & Africa Moving Blankets Revenue (billion), by Application 2025 & 2033
- Figure 40: Middle East & Africa Moving Blankets Volume (K), by Application 2025 & 2033
- Figure 41: Middle East & Africa Moving Blankets Revenue Share (%), by Application 2025 & 2033
- Figure 42: Middle East & Africa Moving Blankets Volume Share (%), by Application 2025 & 2033
- Figure 43: Middle East & Africa Moving Blankets Revenue (billion), by Type 2025 & 2033
- Figure 44: Middle East & Africa Moving Blankets Volume (K), by Type 2025 & 2033
- Figure 45: Middle East & Africa Moving Blankets Revenue Share (%), by Type 2025 & 2033
- Figure 46: Middle East & Africa Moving Blankets Volume Share (%), by Type 2025 & 2033
- Figure 47: Middle East & Africa Moving Blankets Revenue (billion), by Country 2025 & 2033
- Figure 48: Middle East & Africa Moving Blankets Volume (K), by Country 2025 & 2033
- Figure 49: Middle East & Africa Moving Blankets Revenue Share (%), by Country 2025 & 2033
- Figure 50: Middle East & Africa Moving Blankets Volume Share (%), by Country 2025 & 2033
- Figure 51: Asia Pacific Moving Blankets Revenue (billion), by Application 2025 & 2033
- Figure 52: Asia Pacific Moving Blankets Volume (K), by Application 2025 & 2033
- Figure 53: Asia Pacific Moving Blankets Revenue Share (%), by Application 2025 & 2033
- Figure 54: Asia Pacific Moving Blankets Volume Share (%), by Application 2025 & 2033
- Figure 55: Asia Pacific Moving Blankets Revenue (billion), by Type 2025 & 2033
- Figure 56: Asia Pacific Moving Blankets Volume (K), by Type 2025 & 2033
- Figure 57: Asia Pacific Moving Blankets Revenue Share (%), by Type 2025 & 2033
- Figure 58: Asia Pacific Moving Blankets Volume Share (%), by Type 2025 & 2033
- Figure 59: Asia Pacific Moving Blankets Revenue (billion), by Country 2025 & 2033
- Figure 60: Asia Pacific Moving Blankets Volume (K), by Country 2025 & 2033
- Figure 61: Asia Pacific Moving Blankets Revenue Share (%), by Country 2025 & 2033
- Figure 62: Asia Pacific Moving Blankets Volume Share (%), by Country 2025 & 2033
List of Tables
- Table 1: Global Moving Blankets Revenue billion Forecast, by Application 2020 & 2033
- Table 2: Global Moving Blankets Volume K Forecast, by Application 2020 & 2033
- Table 3: Global Moving Blankets Revenue billion Forecast, by Type 2020 & 2033
- Table 4: Global Moving Blankets Volume K Forecast, by Type 2020 & 2033
- Table 5: Global Moving Blankets Revenue billion Forecast, by Region 2020 & 2033
- Table 6: Global Moving Blankets Volume K Forecast, by Region 2020 & 2033
- Table 7: Global Moving Blankets Revenue billion Forecast, by Application 2020 & 2033
- Table 8: Global Moving Blankets Volume K Forecast, by Application 2020 & 2033
- Table 9: Global Moving Blankets Revenue billion Forecast, by Type 2020 & 2033
- Table 10: Global Moving Blankets Volume K Forecast, by Type 2020 & 2033
- Table 11: Global Moving Blankets Revenue billion Forecast, by Country 2020 & 2033
- Table 12: Global Moving Blankets Volume K Forecast, by Country 2020 & 2033
- Table 13: United States Moving Blankets Revenue (billion) Forecast, by Application 2020 & 2033
- Table 14: United States Moving Blankets Volume (K) Forecast, by Application 2020 & 2033
- Table 15: Canada Moving Blankets Revenue (billion) Forecast, by Application 2020 & 2033
- Table 16: Canada Moving Blankets Volume (K) Forecast, by Application 2020 & 2033
- Table 17: Mexico Moving Blankets Revenue (billion) Forecast, by Application 2020 & 2033
- Table 18: Mexico Moving Blankets Volume (K) Forecast, by Application 2020 & 2033
- Table 19: Global Moving Blankets Revenue billion Forecast, by Application 2020 & 2033
- Table 20: Global Moving Blankets Volume K Forecast, by Application 2020 & 2033
- Table 21: Global Moving Blankets Revenue billion Forecast, by Type 2020 & 2033
- Table 22: Global Moving Blankets Volume K Forecast, by Type 2020 & 2033
- Table 23: Global Moving Blankets Revenue billion Forecast, by Country 2020 & 2033
- Table 24: Global Moving Blankets Volume K Forecast, by Country 2020 & 2033
- Table 25: Brazil Moving Blankets Revenue (billion) Forecast, by Application 2020 & 2033
- Table 26: Brazil Moving Blankets Volume (K) Forecast, by Application 2020 & 2033
- Table 27: Argentina Moving Blankets Revenue (billion) Forecast, by Application 2020 & 2033
- Table 28: Argentina Moving Blankets Volume (K) Forecast, by Application 2020 & 2033
- Table 29: Rest of South America Moving Blankets Revenue (billion) Forecast, by Application 2020 & 2033
- Table 30: Rest of South America Moving Blankets Volume (K) Forecast, by Application 2020 & 2033
- Table 31: Global Moving Blankets Revenue billion Forecast, by Application 2020 & 2033
- Table 32: Global Moving Blankets Volume K Forecast, by Application 2020 & 2033
- Table 33: Global Moving Blankets Revenue billion Forecast, by Type 2020 & 2033
- Table 34: Global Moving Blankets Volume K Forecast, by Type 2020 & 2033
- Table 35: Global Moving Blankets Revenue billion Forecast, by Country 2020 & 2033
- Table 36: Global Moving Blankets Volume K Forecast, by Country 2020 & 2033
- Table 37: United Kingdom Moving Blankets Revenue (billion) Forecast, by Application 2020 & 2033
- Table 38: United Kingdom Moving Blankets Volume (K) Forecast, by Application 2020 & 2033
- Table 39: Germany Moving Blankets Revenue (billion) Forecast, by Application 2020 & 2033
- Table 40: Germany Moving Blankets Volume (K) Forecast, by Application 2020 & 2033
- Table 41: France Moving Blankets Revenue (billion) Forecast, by Application 2020 & 2033
- Table 42: France Moving Blankets Volume (K) Forecast, by Application 2020 & 2033
- Table 43: Italy Moving Blankets Revenue (billion) Forecast, by Application 2020 & 2033
- Table 44: Italy Moving Blankets Volume (K) Forecast, by Application 2020 & 2033
- Table 45: Spain Moving Blankets Revenue (billion) Forecast, by Application 2020 & 2033
- Table 46: Spain Moving Blankets Volume (K) Forecast, by Application 2020 & 2033
- Table 47: Russia Moving Blankets Revenue (billion) Forecast, by Application 2020 & 2033
- Table 48: Russia Moving Blankets Volume (K) Forecast, by Application 2020 & 2033
- Table 49: Benelux Moving Blankets Revenue (billion) Forecast, by Application 2020 & 2033
- Table 50: Benelux Moving Blankets Volume (K) Forecast, by Application 2020 & 2033
- Table 51: Nordics Moving Blankets Revenue (billion) Forecast, by Application 2020 & 2033
- Table 52: Nordics Moving Blankets Volume (K) Forecast, by Application 2020 & 2033
- Table 53: Rest of Europe Moving Blankets Revenue (billion) Forecast, by Application 2020 & 2033
- Table 54: Rest of Europe Moving Blankets Volume (K) Forecast, by Application 2020 & 2033
- Table 55: Global Moving Blankets Revenue billion Forecast, by Application 2020 & 2033
- Table 56: Global Moving Blankets Volume K Forecast, by Application 2020 & 2033
- Table 57: Global Moving Blankets Revenue billion Forecast, by Type 2020 & 2033
- Table 58: Global Moving Blankets Volume K Forecast, by Type 2020 & 2033
- Table 59: Global Moving Blankets Revenue billion Forecast, by Country 2020 & 2033
- Table 60: Global Moving Blankets Volume K Forecast, by Country 2020 & 2033
- Table 61: Turkey Moving Blankets Revenue (billion) Forecast, by Application 2020 & 2033
- Table 62: Turkey Moving Blankets Volume (K) Forecast, by Application 2020 & 2033
- Table 63: Israel Moving Blankets Revenue (billion) Forecast, by Application 2020 & 2033
- Table 64: Israel Moving Blankets Volume (K) Forecast, by Application 2020 & 2033
- Table 65: GCC Moving Blankets Revenue (billion) Forecast, by Application 2020 & 2033
- Table 66: GCC Moving Blankets Volume (K) Forecast, by Application 2020 & 2033
- Table 67: North Africa Moving Blankets Revenue (billion) Forecast, by Application 2020 & 2033
- Table 68: North Africa Moving Blankets Volume (K) Forecast, by Application 2020 & 2033
- Table 69: South Africa Moving Blankets Revenue (billion) Forecast, by Application 2020 & 2033
- Table 70: South Africa Moving Blankets Volume (K) Forecast, by Application 2020 & 2033
- Table 71: Rest of Middle East & Africa Moving Blankets Revenue (billion) Forecast, by Application 2020 & 2033
- Table 72: Rest of Middle East & Africa Moving Blankets Volume (K) Forecast, by Application 2020 & 2033
- Table 73: Global Moving Blankets Revenue billion Forecast, by Application 2020 & 2033
- Table 74: Global Moving Blankets Volume K Forecast, by Application 2020 & 2033
- Table 75: Global Moving Blankets Revenue billion Forecast, by Type 2020 & 2033
- Table 76: Global Moving Blankets Volume K Forecast, by Type 2020 & 2033
- Table 77: Global Moving Blankets Revenue billion Forecast, by Country 2020 & 2033
- Table 78: Global Moving Blankets Volume K Forecast, by Country 2020 & 2033
- Table 79: China Moving Blankets Revenue (billion) Forecast, by Application 2020 & 2033
- Table 80: China Moving Blankets Volume (K) Forecast, by Application 2020 & 2033
- Table 81: India Moving Blankets Revenue (billion) Forecast, by Application 2020 & 2033
- Table 82: India Moving Blankets Volume (K) Forecast, by Application 2020 & 2033
- Table 83: Japan Moving Blankets Revenue (billion) Forecast, by Application 2020 & 2033
- Table 84: Japan Moving Blankets Volume (K) Forecast, by Application 2020 & 2033
- Table 85: South Korea Moving Blankets Revenue (billion) Forecast, by Application 2020 & 2033
- Table 86: South Korea Moving Blankets Volume (K) Forecast, by Application 2020 & 2033
- Table 87: ASEAN Moving Blankets Revenue (billion) Forecast, by Application 2020 & 2033
- Table 88: ASEAN Moving Blankets Volume (K) Forecast, by Application 2020 & 2033
- Table 89: Oceania Moving Blankets Revenue (billion) Forecast, by Application 2020 & 2033
- Table 90: Oceania Moving Blankets Volume (K) Forecast, by Application 2020 & 2033
- Table 91: Rest of Asia Pacific Moving Blankets Revenue (billion) Forecast, by Application 2020 & 2033
- Table 92: Rest of Asia Pacific Moving Blankets Volume (K) Forecast, by Application 2020 & 2033
Frequently Asked Questions
1. What is the projected Compound Annual Growth Rate (CAGR) of the Moving Blankets?
The projected CAGR is approximately 5.2%.
2. Which companies are prominent players in the Moving Blankets?
Key companies in the market include Western Tarpaulin & Company, New Haven Moving Equipment, Cangnan Top Textile Co., Ltd., Eskay international.
3. What are the main segments of the Moving Blankets?
The market segments include Application, Type.
4. Can you provide details about the market size?
The market size is estimated to be USD 8.6 billion as of 2022.
5. What are some drivers contributing to market growth?
N/A
6. What are the notable trends driving market growth?
N/A
7. Are there any restraints impacting market growth?
N/A
8. Can you provide examples of recent developments in the market?
N/A
9. What pricing options are available for accessing the report?
Pricing options include single-user, multi-user, and enterprise licenses priced at USD 3950.00, USD 5925.00, and USD 7900.00 respectively.
10. Is the market size provided in terms of value or volume?
The market size is provided in terms of value, measured in billion and volume, measured in K.
11. Are there any specific market keywords associated with the report?
Yes, the market keyword associated with the report is "Moving Blankets," which aids in identifying and referencing the specific market segment covered.
12. How do I determine which pricing option suits my needs best?
The pricing options vary based on user requirements and access needs. Individual users may opt for single-user licenses, while businesses requiring broader access may choose multi-user or enterprise licenses for cost-effective access to the report.
13. Are there any additional resources or data provided in the Moving Blankets report?
While the report offers comprehensive insights, it's advisable to review the specific contents or supplementary materials provided to ascertain if additional resources or data are available.
14. How can I stay updated on further developments or reports in the Moving Blankets?
To stay informed about further developments, trends, and reports in the Moving Blankets, consider subscribing to industry newsletters, following relevant companies and organizations, or regularly checking reputable industry news sources and publications.
Methodology
Step 1 - Identification of Relevant Samples Size from Population Database


Step 2 - Approaches for Defining Global Market Size (Value, Volume* & Price*)

Note*: In applicable scenarios
Step 3 - Data Sources
Primary Research
- Web Analytics
- Survey Reports
- Research Institute
- Latest Research Reports
- Opinion Leaders
Secondary Research
- Annual Reports
- White Paper
- Latest Press Release
- Industry Association
- Paid Database
- Investor Presentations

Step 4 - Data Triangulation
Involves using different sources of information in order to increase the validity of a study
These sources are likely to be stakeholders in a program - participants, other researchers, program staff, other community members, and so on.
Then we put all data in single framework & apply various statistical tools to find out the dynamic on the market.
During the analysis stage, feedback from the stakeholder groups would be compared to determine areas of agreement as well as areas of divergence