

Key Insights
The global Multi-material Packaging market is projected to reach approximately 177.91 billion by 2025, with a Compound Annual Growth Rate (CAGR) of 5.32% from 2025 to 2033. This growth is driven by increasing demand for advanced packaging across key industries. The Pharmaceutical sector requires high-barrier packaging for drug efficacy, while Electric & Electronics industries need protection for sensitive components. The Food & Beverages sector utilizes these solutions to enhance freshness and reduce waste. Medical Devices, Transportation & Logistics, E-commerce, and other applications also contribute significantly to market demand, emphasizing the need for efficient and durable packaging.
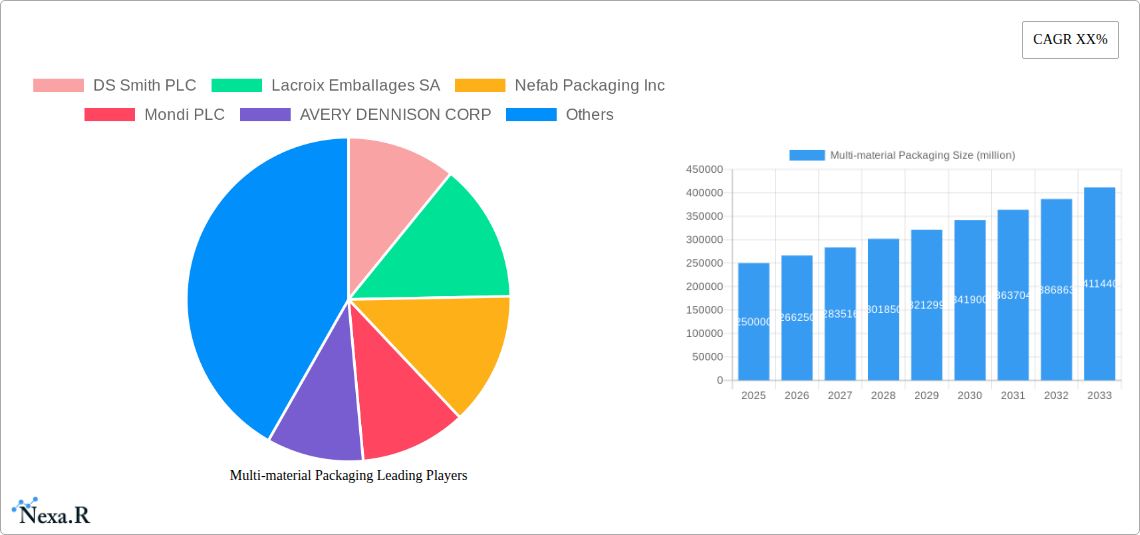
Multi-material Packaging Market Size (In Billion)
Market dynamics are influenced by the growing consumer preference for sustainable packaging, pushing for innovations with recycled content and recyclability. Advances in material science and manufacturing are enabling lighter, stronger, and more cost-effective solutions. However, challenges such as the complexity of recycling mixed materials, stringent regulations, and initial investment costs may restrain growth. Polyethylene (PE) and Polypropylene (PP) dominate the market due to their versatility, while Polyamide (PA) and EVOH are gaining traction for superior barrier properties. PET remains significant in beverage packaging. Leading companies are investing in R&D to meet evolving demands and regulations. Asia Pacific, particularly China and India, is experiencing the fastest growth, followed by North America and Europe.

Multi-material Packaging Company Market Share
This report offers an in-depth analysis of the global Multi-material Packaging market, covering market dynamics, growth trends, regional insights, product landscapes, and key players. Utilizing comprehensive market research data and industry analysis, this study provides actionable insights for stakeholders, focusing on the interplay of packaging materials and their applications across critical sectors. The base year for this analysis is 2025.
Multi-material Packaging Market Dynamics & Structure
The Multi-material Packaging market exhibits moderate concentration, with key players like DS Smith PLC, Mondi PLC, and Tri-Wall Group holding significant shares. Technological innovation is a primary driver, particularly in developing sustainable and high-performance multi-layer solutions. Regulatory frameworks, such as those promoting circular economy principles and reducing single-use plastics, are reshaping market strategies and product development. Competitive product substitutes, including monomaterial alternatives and advanced barrier coatings, constantly challenge established multi-material solutions. End-user demographics are evolving, with a growing demand for convenience, safety, and eco-friendly packaging across segments like Food and Beverages and E-commerce. Mergers and acquisitions (M&A) activity, estimated at a volume of 35 deals historically, indicates strategic consolidation and expansion efforts. For instance, the acquisition of smaller specialty packaging firms by larger entities aims to broaden technological capabilities and market reach. Innovation barriers include the complexity of recycling multi-material structures and the substantial investment required for advanced material research.
- Market Concentration: Moderate, with top 5 players holding approximately 45% market share in 2025.
- Technological Innovation: Focus on barrier properties, recyclability, and lightweighting.
- Regulatory Frameworks: Increasing pressure for sustainable solutions and waste reduction.
- Competitive Substitutes: Monomaterial packaging, biodegradable alternatives, and intelligent packaging.
- End-User Demographics: Rising demand for safety, shelf-life extension, and e-commerce suitability.
- M&A Trends: Strategic acquisitions to gain market share and technological expertise.
Multi-material Packaging Growth Trends & Insights
The global Multi-material Packaging market is projected to witness robust growth, expanding from an estimated market size of $185,670 million units in the base year 2025 to $245,980 million units by 2033, exhibiting a compound annual growth rate (CAGR) of 3.6%. This expansion is fueled by an escalating demand for packaging solutions that offer superior protection, extended shelf-life, and enhanced product appeal across diverse applications such as Pharmaceutical, Electric and Electronics, and Food and Beverages. The increasing adoption of e-commerce has significantly boosted the requirement for durable and protective multi-material packaging, enabling safe transit of goods. Technological advancements in material science, particularly in developing advanced barrier films like EVOH and high-performance polymers like Polyethylene Terephthalate (PET), are enabling the creation of lighter, stronger, and more sustainable packaging solutions. Consumer behavior shifts towards convenience and ready-to-eat meals also contribute to the demand for sophisticated multi-material packaging that maintains product freshness and integrity. The penetration rate of multi-material packaging is steadily increasing, driven by its versatility and ability to meet complex packaging requirements. Disruptions, such as the development of novel bio-based polymers and advanced recycling technologies, are poised to further reshape the market landscape. The market size for multi-material packaging is expected to grow from $170,210 million units in 2024 to $205,120 million units in 2025.
Dominant Regions, Countries, or Segments in Multi-material Packaging
The Food and Beverages segment is a dominant force within the global Multi-material Packaging market, projected to account for approximately 35% of the total market value by 2025, reaching an estimated $64,984.5 million units. This dominance is attributed to the critical need for packaging that ensures product safety, prevents spoilage, and maintains the freshness and sensory appeal of a vast array of food and beverage products. Economic policies supporting food security and trade, coupled with well-established cold chain infrastructure in regions like North America and Europe, further bolster this segment. The e-commerce boom has also propelled the demand for robust food and beverage packaging capable of withstanding transit stresses.
Among the material types, Polyethylene (PE) and Polypropylene (PP) remain foundational, consistently driving market demand due to their versatility, cost-effectiveness, and excellent barrier properties when combined in multi-layer structures. The application in Food and Beverages is particularly strong for PE and PP due to their food-grade compliance and resistance to moisture and chemicals.
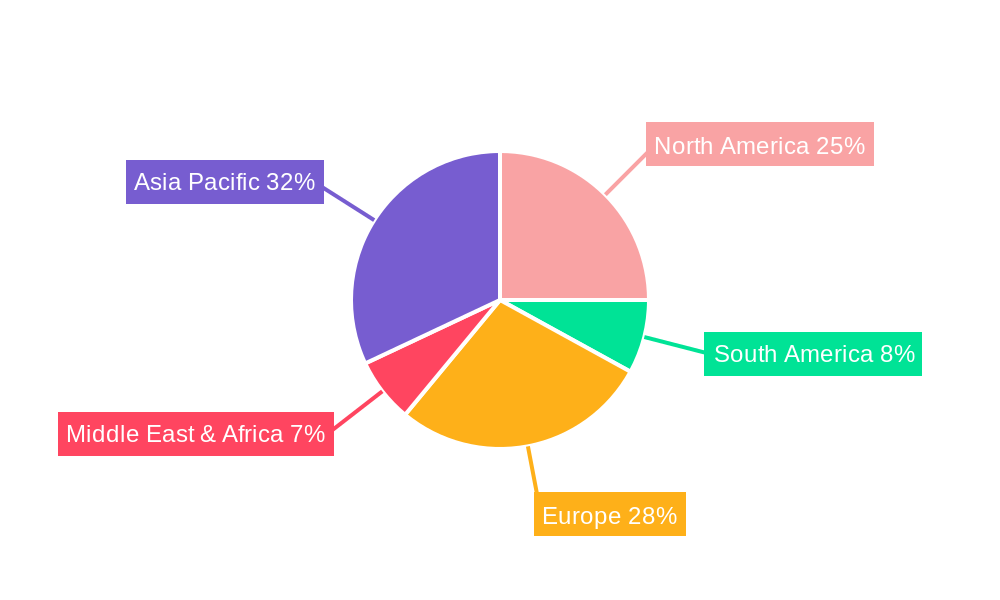
Geographically, North America and Europe are leading regions, collectively holding over 55% of the global market share in 2025. This leadership stems from a combination of high consumer spending, advanced manufacturing capabilities, stringent quality and safety regulations for food and pharmaceuticals, and a strong emphasis on sustainable packaging solutions. The presence of major food and beverage manufacturers and a sophisticated retail landscape further contribute to their dominance.
- Dominant Application: Food and Beverages (approx. 35% market share in 2025).
- Drivers: Need for extended shelf-life, product protection, and consumer appeal.
- Growth Potential: Significant due to evolving consumer diets and global food trade.
- Dominant Material Types: Polyethylene (PE) and Polypropylene (PP).
- Drivers: Versatility, cost-effectiveness, and excellent barrier properties.
- Market Share: Expected to collectively hold over 50% of the material segment in 2025.
- Dominant Regions: North America and Europe.
- Drivers: High disposable income, advanced infrastructure, strict regulations, and strong consumer demand for quality packaging.
- Market Share: Over 55% of the global market in 2025.
Multi-material Packaging Product Landscape
Multi-material packaging innovations are revolutionizing product protection and preservation. Products combining layers of Polyethylene Terephthalate (PET) for clarity and barrier properties with Polyethylene (PE) for sealability are becoming commonplace in the beverage industry. For the Pharmaceutical sector, sophisticated multi-layer films incorporating Polyamide (PA) and Ethylene Vinyl Alcohol (EVOH) offer exceptional oxygen and moisture barrier capabilities, ensuring drug efficacy and shelf-life. In Electric and Electronics, advanced composites designed for shock absorption and electrostatic discharge protection are crucial. The unique selling proposition lies in the synergy of different materials, achieving performance characteristics unattainable by single materials, leading to lighter, more durable, and more sustainable packaging solutions. Technological advancements focus on improving recyclability of these complex structures and enhancing barrier functionalities.
Key Drivers, Barriers & Challenges in Multi-material Packaging
The multi-material packaging market is propelled by several key drivers. The escalating demand for extended shelf-life and product protection across the Food and Beverages, Pharmaceutical, and Medical Devices sectors is a significant catalyst. Technological advancements in material science, enabling improved barrier properties, lighter weights, and enhanced recyclability, also play a crucial role. Furthermore, the burgeoning e-commerce sector's need for robust and safe transit packaging further fuels market growth.
However, the market faces notable barriers and challenges. The complexity of recycling multi-material structures poses a significant environmental concern and regulatory hurdle. High production costs associated with advanced materials and manufacturing processes can also restrain widespread adoption. Supply chain disruptions, fluctuating raw material prices (e.g., for Polyethylene and Polypropylene), and intense competition from monomaterial packaging solutions present ongoing challenges.
Emerging Opportunities in Multi-material Packaging
Emerging opportunities in the multi-material packaging sector lie in the development of truly circular economy-compatible solutions. Innovations in chemical recycling and advanced mechanical recycling technologies for multi-layer films are creating new avenues for sustainability. The increasing consumer preference for on-the-go consumption and personalized product offerings is driving demand for innovative, convenient, and resealable multi-material packaging formats. Furthermore, the application of smart packaging technologies, integrating sensors and indicators within multi-material structures to monitor product condition, presents a significant growth frontier, particularly in the Pharmaceutical and Medical Devices industries.
Growth Accelerators in the Multi-material Packaging Industry
Growth in the multi-material packaging industry is significantly accelerated by ongoing technological breakthroughs in material science, leading to enhanced barrier functionalities and improved recyclability. Strategic partnerships between material suppliers, packaging converters, and end-users are crucial for co-creating innovative and sustainable solutions tailored to specific application needs. Market expansion strategies, particularly targeting emerging economies with growing consumer bases and increasing demand for packaged goods, are also vital accelerators. The continuous development of high-performance materials like EVOH and specialty polyamides opens up new application possibilities, driving further adoption.
Key Players Shaping the Multi-material Packaging Market
- DS Smith PLC
- Lacroix Emballages SA
- Nefab Packaging Inc
- Mondi PLC
- AVERY DENNISON CORP
- Tri-Wall Group
Notable Milestones in Multi-material Packaging Sector
- 2020: Mondi PLC's launch of a new range of high-barrier, recyclable mono-PE pouches, demonstrating advancements in multi-material composite solutions.
- 2021: DS Smith PLC's investment in advanced recycling technologies to improve the circularity of its fiber-based packaging, indirectly influencing multi-material solutions.
- 2022: Nefab Packaging Inc.'s acquisition of a specialized protective packaging company, expanding its portfolio of engineered multi-material solutions for electronics.
- 2023: Avery Dennison Corp.'s introduction of sustainable adhesive solutions for flexible packaging, enhancing the performance and recyclability of multi-material constructions.
- 2024: Tri-Wall Group's expansion into new geographical markets, increasing the global availability of its robust corrugated multi-material packaging solutions.
In-Depth Multi-material Packaging Market Outlook
The multi-material packaging market is poised for sustained growth, driven by an unyielding demand for high-performance, safe, and increasingly sustainable packaging solutions. Future market potential will be significantly shaped by the industry's ability to innovate in areas of enhanced recyclability and the integration of bio-based materials, catering to evolving consumer preferences and stringent environmental regulations. Strategic collaborations and the adoption of advanced manufacturing techniques will be pivotal in unlocking new applications and market segments. The focus will remain on delivering tailored solutions that offer optimal product protection, extended shelf-life, and a reduced environmental footprint, ensuring the sector's continued relevance and expansion.
Multi-material Packaging Segmentation
-
1. Application
- 1.1. Pharmaceutical
- 1.2. Electric and Electronics
- 1.3. Food and Beverages
- 1.4. Medical Devices
- 1.5. Transportation and Logistics
- 1.6. E-commerce
- 1.7. Others
-
2. Types
- 2.1. Polyethylene (PE)
- 2.2. Polypropylene (PP)
- 2.3. Polyamide (PA)
- 2.4. EVOH
- 2.5. Polyethylene Terephthalate (PET)
Multi-material Packaging Segmentation By Geography
-
1. North America
- 1.1. United States
- 1.2. Canada
- 1.3. Mexico
-
2. South America
- 2.1. Brazil
- 2.2. Argentina
- 2.3. Rest of South America
-
3. Europe
- 3.1. United Kingdom
- 3.2. Germany
- 3.3. France
- 3.4. Italy
- 3.5. Spain
- 3.6. Russia
- 3.7. Benelux
- 3.8. Nordics
- 3.9. Rest of Europe
-
4. Middle East & Africa
- 4.1. Turkey
- 4.2. Israel
- 4.3. GCC
- 4.4. North Africa
- 4.5. South Africa
- 4.6. Rest of Middle East & Africa
-
5. Asia Pacific
- 5.1. China
- 5.2. India
- 5.3. Japan
- 5.4. South Korea
- 5.5. ASEAN
- 5.6. Oceania
- 5.7. Rest of Asia Pacific
Multi-material Packaging Regional Market Share
Geographic Coverage of Multi-material Packaging
Multi-material Packaging REPORT HIGHLIGHTS
| Aspects | Details |
|---|---|
| Study Period | 2020-2034 |
| Base Year | 2025 |
| Estimated Year | 2026 |
| Forecast Period | 2026-2034 |
| Historical Period | 2020-2025 |
| Growth Rate | CAGR of 5.32% from 2020-2034 |
| Segmentation |
|
Table of Contents
- 1. Introduction
- 1.1. Research Scope
- 1.2. Market Segmentation
- 1.3. Research Methodology
- 1.4. Definitions and Assumptions
- 2. Executive Summary
- 2.1. Introduction
- 3. Market Dynamics
- 3.1. Introduction
- 3.2. Market Drivers
- 3.3. Market Restrains
- 3.4. Market Trends
- 4. Market Factor Analysis
- 4.1. Porters Five Forces
- 4.2. Supply/Value Chain
- 4.3. PESTEL analysis
- 4.4. Market Entropy
- 4.5. Patent/Trademark Analysis
- 5. Global Multi-material Packaging Analysis, Insights and Forecast, 2020-2032
- 5.1. Market Analysis, Insights and Forecast - by Application
- 5.1.1. Pharmaceutical
- 5.1.2. Electric and Electronics
- 5.1.3. Food and Beverages
- 5.1.4. Medical Devices
- 5.1.5. Transportation and Logistics
- 5.1.6. E-commerce
- 5.1.7. Others
- 5.2. Market Analysis, Insights and Forecast - by Types
- 5.2.1. Polyethylene (PE)
- 5.2.2. Polypropylene (PP)
- 5.2.3. Polyamide (PA)
- 5.2.4. EVOH
- 5.2.5. Polyethylene Terephthalate (PET)
- 5.3. Market Analysis, Insights and Forecast - by Region
- 5.3.1. North America
- 5.3.2. South America
- 5.3.3. Europe
- 5.3.4. Middle East & Africa
- 5.3.5. Asia Pacific
- 5.1. Market Analysis, Insights and Forecast - by Application
- 6. North America Multi-material Packaging Analysis, Insights and Forecast, 2020-2032
- 6.1. Market Analysis, Insights and Forecast - by Application
- 6.1.1. Pharmaceutical
- 6.1.2. Electric and Electronics
- 6.1.3. Food and Beverages
- 6.1.4. Medical Devices
- 6.1.5. Transportation and Logistics
- 6.1.6. E-commerce
- 6.1.7. Others
- 6.2. Market Analysis, Insights and Forecast - by Types
- 6.2.1. Polyethylene (PE)
- 6.2.2. Polypropylene (PP)
- 6.2.3. Polyamide (PA)
- 6.2.4. EVOH
- 6.2.5. Polyethylene Terephthalate (PET)
- 6.1. Market Analysis, Insights and Forecast - by Application
- 7. South America Multi-material Packaging Analysis, Insights and Forecast, 2020-2032
- 7.1. Market Analysis, Insights and Forecast - by Application
- 7.1.1. Pharmaceutical
- 7.1.2. Electric and Electronics
- 7.1.3. Food and Beverages
- 7.1.4. Medical Devices
- 7.1.5. Transportation and Logistics
- 7.1.6. E-commerce
- 7.1.7. Others
- 7.2. Market Analysis, Insights and Forecast - by Types
- 7.2.1. Polyethylene (PE)
- 7.2.2. Polypropylene (PP)
- 7.2.3. Polyamide (PA)
- 7.2.4. EVOH
- 7.2.5. Polyethylene Terephthalate (PET)
- 7.1. Market Analysis, Insights and Forecast - by Application
- 8. Europe Multi-material Packaging Analysis, Insights and Forecast, 2020-2032
- 8.1. Market Analysis, Insights and Forecast - by Application
- 8.1.1. Pharmaceutical
- 8.1.2. Electric and Electronics
- 8.1.3. Food and Beverages
- 8.1.4. Medical Devices
- 8.1.5. Transportation and Logistics
- 8.1.6. E-commerce
- 8.1.7. Others
- 8.2. Market Analysis, Insights and Forecast - by Types
- 8.2.1. Polyethylene (PE)
- 8.2.2. Polypropylene (PP)
- 8.2.3. Polyamide (PA)
- 8.2.4. EVOH
- 8.2.5. Polyethylene Terephthalate (PET)
- 8.1. Market Analysis, Insights and Forecast - by Application
- 9. Middle East & Africa Multi-material Packaging Analysis, Insights and Forecast, 2020-2032
- 9.1. Market Analysis, Insights and Forecast - by Application
- 9.1.1. Pharmaceutical
- 9.1.2. Electric and Electronics
- 9.1.3. Food and Beverages
- 9.1.4. Medical Devices
- 9.1.5. Transportation and Logistics
- 9.1.6. E-commerce
- 9.1.7. Others
- 9.2. Market Analysis, Insights and Forecast - by Types
- 9.2.1. Polyethylene (PE)
- 9.2.2. Polypropylene (PP)
- 9.2.3. Polyamide (PA)
- 9.2.4. EVOH
- 9.2.5. Polyethylene Terephthalate (PET)
- 9.1. Market Analysis, Insights and Forecast - by Application
- 10. Asia Pacific Multi-material Packaging Analysis, Insights and Forecast, 2020-2032
- 10.1. Market Analysis, Insights and Forecast - by Application
- 10.1.1. Pharmaceutical
- 10.1.2. Electric and Electronics
- 10.1.3. Food and Beverages
- 10.1.4. Medical Devices
- 10.1.5. Transportation and Logistics
- 10.1.6. E-commerce
- 10.1.7. Others
- 10.2. Market Analysis, Insights and Forecast - by Types
- 10.2.1. Polyethylene (PE)
- 10.2.2. Polypropylene (PP)
- 10.2.3. Polyamide (PA)
- 10.2.4. EVOH
- 10.2.5. Polyethylene Terephthalate (PET)
- 10.1. Market Analysis, Insights and Forecast - by Application
- 11. Competitive Analysis
- 11.1. Global Market Share Analysis 2025
- 11.2. Company Profiles
- 11.2.1 DS Smith PLC
- 11.2.1.1. Overview
- 11.2.1.2. Products
- 11.2.1.3. SWOT Analysis
- 11.2.1.4. Recent Developments
- 11.2.1.5. Financials (Based on Availability)
- 11.2.2 Lacroix Emballages SA
- 11.2.2.1. Overview
- 11.2.2.2. Products
- 11.2.2.3. SWOT Analysis
- 11.2.2.4. Recent Developments
- 11.2.2.5. Financials (Based on Availability)
- 11.2.3 Nefab Packaging Inc
- 11.2.3.1. Overview
- 11.2.3.2. Products
- 11.2.3.3. SWOT Analysis
- 11.2.3.4. Recent Developments
- 11.2.3.5. Financials (Based on Availability)
- 11.2.4 Mondi PLC
- 11.2.4.1. Overview
- 11.2.4.2. Products
- 11.2.4.3. SWOT Analysis
- 11.2.4.4. Recent Developments
- 11.2.4.5. Financials (Based on Availability)
- 11.2.5 AVERY DENNISON CORP
- 11.2.5.1. Overview
- 11.2.5.2. Products
- 11.2.5.3. SWOT Analysis
- 11.2.5.4. Recent Developments
- 11.2.5.5. Financials (Based on Availability)
- 11.2.6 Tri-Wall Group
- 11.2.6.1. Overview
- 11.2.6.2. Products
- 11.2.6.3. SWOT Analysis
- 11.2.6.4. Recent Developments
- 11.2.6.5. Financials (Based on Availability)
- 11.2.1 DS Smith PLC
List of Figures
- Figure 1: Global Multi-material Packaging Revenue Breakdown (billion, %) by Region 2025 & 2033
- Figure 2: Global Multi-material Packaging Volume Breakdown (K, %) by Region 2025 & 2033
- Figure 3: North America Multi-material Packaging Revenue (billion), by Application 2025 & 2033
- Figure 4: North America Multi-material Packaging Volume (K), by Application 2025 & 2033
- Figure 5: North America Multi-material Packaging Revenue Share (%), by Application 2025 & 2033
- Figure 6: North America Multi-material Packaging Volume Share (%), by Application 2025 & 2033
- Figure 7: North America Multi-material Packaging Revenue (billion), by Types 2025 & 2033
- Figure 8: North America Multi-material Packaging Volume (K), by Types 2025 & 2033
- Figure 9: North America Multi-material Packaging Revenue Share (%), by Types 2025 & 2033
- Figure 10: North America Multi-material Packaging Volume Share (%), by Types 2025 & 2033
- Figure 11: North America Multi-material Packaging Revenue (billion), by Country 2025 & 2033
- Figure 12: North America Multi-material Packaging Volume (K), by Country 2025 & 2033
- Figure 13: North America Multi-material Packaging Revenue Share (%), by Country 2025 & 2033
- Figure 14: North America Multi-material Packaging Volume Share (%), by Country 2025 & 2033
- Figure 15: South America Multi-material Packaging Revenue (billion), by Application 2025 & 2033
- Figure 16: South America Multi-material Packaging Volume (K), by Application 2025 & 2033
- Figure 17: South America Multi-material Packaging Revenue Share (%), by Application 2025 & 2033
- Figure 18: South America Multi-material Packaging Volume Share (%), by Application 2025 & 2033
- Figure 19: South America Multi-material Packaging Revenue (billion), by Types 2025 & 2033
- Figure 20: South America Multi-material Packaging Volume (K), by Types 2025 & 2033
- Figure 21: South America Multi-material Packaging Revenue Share (%), by Types 2025 & 2033
- Figure 22: South America Multi-material Packaging Volume Share (%), by Types 2025 & 2033
- Figure 23: South America Multi-material Packaging Revenue (billion), by Country 2025 & 2033
- Figure 24: South America Multi-material Packaging Volume (K), by Country 2025 & 2033
- Figure 25: South America Multi-material Packaging Revenue Share (%), by Country 2025 & 2033
- Figure 26: South America Multi-material Packaging Volume Share (%), by Country 2025 & 2033
- Figure 27: Europe Multi-material Packaging Revenue (billion), by Application 2025 & 2033
- Figure 28: Europe Multi-material Packaging Volume (K), by Application 2025 & 2033
- Figure 29: Europe Multi-material Packaging Revenue Share (%), by Application 2025 & 2033
- Figure 30: Europe Multi-material Packaging Volume Share (%), by Application 2025 & 2033
- Figure 31: Europe Multi-material Packaging Revenue (billion), by Types 2025 & 2033
- Figure 32: Europe Multi-material Packaging Volume (K), by Types 2025 & 2033
- Figure 33: Europe Multi-material Packaging Revenue Share (%), by Types 2025 & 2033
- Figure 34: Europe Multi-material Packaging Volume Share (%), by Types 2025 & 2033
- Figure 35: Europe Multi-material Packaging Revenue (billion), by Country 2025 & 2033
- Figure 36: Europe Multi-material Packaging Volume (K), by Country 2025 & 2033
- Figure 37: Europe Multi-material Packaging Revenue Share (%), by Country 2025 & 2033
- Figure 38: Europe Multi-material Packaging Volume Share (%), by Country 2025 & 2033
- Figure 39: Middle East & Africa Multi-material Packaging Revenue (billion), by Application 2025 & 2033
- Figure 40: Middle East & Africa Multi-material Packaging Volume (K), by Application 2025 & 2033
- Figure 41: Middle East & Africa Multi-material Packaging Revenue Share (%), by Application 2025 & 2033
- Figure 42: Middle East & Africa Multi-material Packaging Volume Share (%), by Application 2025 & 2033
- Figure 43: Middle East & Africa Multi-material Packaging Revenue (billion), by Types 2025 & 2033
- Figure 44: Middle East & Africa Multi-material Packaging Volume (K), by Types 2025 & 2033
- Figure 45: Middle East & Africa Multi-material Packaging Revenue Share (%), by Types 2025 & 2033
- Figure 46: Middle East & Africa Multi-material Packaging Volume Share (%), by Types 2025 & 2033
- Figure 47: Middle East & Africa Multi-material Packaging Revenue (billion), by Country 2025 & 2033
- Figure 48: Middle East & Africa Multi-material Packaging Volume (K), by Country 2025 & 2033
- Figure 49: Middle East & Africa Multi-material Packaging Revenue Share (%), by Country 2025 & 2033
- Figure 50: Middle East & Africa Multi-material Packaging Volume Share (%), by Country 2025 & 2033
- Figure 51: Asia Pacific Multi-material Packaging Revenue (billion), by Application 2025 & 2033
- Figure 52: Asia Pacific Multi-material Packaging Volume (K), by Application 2025 & 2033
- Figure 53: Asia Pacific Multi-material Packaging Revenue Share (%), by Application 2025 & 2033
- Figure 54: Asia Pacific Multi-material Packaging Volume Share (%), by Application 2025 & 2033
- Figure 55: Asia Pacific Multi-material Packaging Revenue (billion), by Types 2025 & 2033
- Figure 56: Asia Pacific Multi-material Packaging Volume (K), by Types 2025 & 2033
- Figure 57: Asia Pacific Multi-material Packaging Revenue Share (%), by Types 2025 & 2033
- Figure 58: Asia Pacific Multi-material Packaging Volume Share (%), by Types 2025 & 2033
- Figure 59: Asia Pacific Multi-material Packaging Revenue (billion), by Country 2025 & 2033
- Figure 60: Asia Pacific Multi-material Packaging Volume (K), by Country 2025 & 2033
- Figure 61: Asia Pacific Multi-material Packaging Revenue Share (%), by Country 2025 & 2033
- Figure 62: Asia Pacific Multi-material Packaging Volume Share (%), by Country 2025 & 2033
List of Tables
- Table 1: Global Multi-material Packaging Revenue billion Forecast, by Application 2020 & 2033
- Table 2: Global Multi-material Packaging Volume K Forecast, by Application 2020 & 2033
- Table 3: Global Multi-material Packaging Revenue billion Forecast, by Types 2020 & 2033
- Table 4: Global Multi-material Packaging Volume K Forecast, by Types 2020 & 2033
- Table 5: Global Multi-material Packaging Revenue billion Forecast, by Region 2020 & 2033
- Table 6: Global Multi-material Packaging Volume K Forecast, by Region 2020 & 2033
- Table 7: Global Multi-material Packaging Revenue billion Forecast, by Application 2020 & 2033
- Table 8: Global Multi-material Packaging Volume K Forecast, by Application 2020 & 2033
- Table 9: Global Multi-material Packaging Revenue billion Forecast, by Types 2020 & 2033
- Table 10: Global Multi-material Packaging Volume K Forecast, by Types 2020 & 2033
- Table 11: Global Multi-material Packaging Revenue billion Forecast, by Country 2020 & 2033
- Table 12: Global Multi-material Packaging Volume K Forecast, by Country 2020 & 2033
- Table 13: United States Multi-material Packaging Revenue (billion) Forecast, by Application 2020 & 2033
- Table 14: United States Multi-material Packaging Volume (K) Forecast, by Application 2020 & 2033
- Table 15: Canada Multi-material Packaging Revenue (billion) Forecast, by Application 2020 & 2033
- Table 16: Canada Multi-material Packaging Volume (K) Forecast, by Application 2020 & 2033
- Table 17: Mexico Multi-material Packaging Revenue (billion) Forecast, by Application 2020 & 2033
- Table 18: Mexico Multi-material Packaging Volume (K) Forecast, by Application 2020 & 2033
- Table 19: Global Multi-material Packaging Revenue billion Forecast, by Application 2020 & 2033
- Table 20: Global Multi-material Packaging Volume K Forecast, by Application 2020 & 2033
- Table 21: Global Multi-material Packaging Revenue billion Forecast, by Types 2020 & 2033
- Table 22: Global Multi-material Packaging Volume K Forecast, by Types 2020 & 2033
- Table 23: Global Multi-material Packaging Revenue billion Forecast, by Country 2020 & 2033
- Table 24: Global Multi-material Packaging Volume K Forecast, by Country 2020 & 2033
- Table 25: Brazil Multi-material Packaging Revenue (billion) Forecast, by Application 2020 & 2033
- Table 26: Brazil Multi-material Packaging Volume (K) Forecast, by Application 2020 & 2033
- Table 27: Argentina Multi-material Packaging Revenue (billion) Forecast, by Application 2020 & 2033
- Table 28: Argentina Multi-material Packaging Volume (K) Forecast, by Application 2020 & 2033
- Table 29: Rest of South America Multi-material Packaging Revenue (billion) Forecast, by Application 2020 & 2033
- Table 30: Rest of South America Multi-material Packaging Volume (K) Forecast, by Application 2020 & 2033
- Table 31: Global Multi-material Packaging Revenue billion Forecast, by Application 2020 & 2033
- Table 32: Global Multi-material Packaging Volume K Forecast, by Application 2020 & 2033
- Table 33: Global Multi-material Packaging Revenue billion Forecast, by Types 2020 & 2033
- Table 34: Global Multi-material Packaging Volume K Forecast, by Types 2020 & 2033
- Table 35: Global Multi-material Packaging Revenue billion Forecast, by Country 2020 & 2033
- Table 36: Global Multi-material Packaging Volume K Forecast, by Country 2020 & 2033
- Table 37: United Kingdom Multi-material Packaging Revenue (billion) Forecast, by Application 2020 & 2033
- Table 38: United Kingdom Multi-material Packaging Volume (K) Forecast, by Application 2020 & 2033
- Table 39: Germany Multi-material Packaging Revenue (billion) Forecast, by Application 2020 & 2033
- Table 40: Germany Multi-material Packaging Volume (K) Forecast, by Application 2020 & 2033
- Table 41: France Multi-material Packaging Revenue (billion) Forecast, by Application 2020 & 2033
- Table 42: France Multi-material Packaging Volume (K) Forecast, by Application 2020 & 2033
- Table 43: Italy Multi-material Packaging Revenue (billion) Forecast, by Application 2020 & 2033
- Table 44: Italy Multi-material Packaging Volume (K) Forecast, by Application 2020 & 2033
- Table 45: Spain Multi-material Packaging Revenue (billion) Forecast, by Application 2020 & 2033
- Table 46: Spain Multi-material Packaging Volume (K) Forecast, by Application 2020 & 2033
- Table 47: Russia Multi-material Packaging Revenue (billion) Forecast, by Application 2020 & 2033
- Table 48: Russia Multi-material Packaging Volume (K) Forecast, by Application 2020 & 2033
- Table 49: Benelux Multi-material Packaging Revenue (billion) Forecast, by Application 2020 & 2033
- Table 50: Benelux Multi-material Packaging Volume (K) Forecast, by Application 2020 & 2033
- Table 51: Nordics Multi-material Packaging Revenue (billion) Forecast, by Application 2020 & 2033
- Table 52: Nordics Multi-material Packaging Volume (K) Forecast, by Application 2020 & 2033
- Table 53: Rest of Europe Multi-material Packaging Revenue (billion) Forecast, by Application 2020 & 2033
- Table 54: Rest of Europe Multi-material Packaging Volume (K) Forecast, by Application 2020 & 2033
- Table 55: Global Multi-material Packaging Revenue billion Forecast, by Application 2020 & 2033
- Table 56: Global Multi-material Packaging Volume K Forecast, by Application 2020 & 2033
- Table 57: Global Multi-material Packaging Revenue billion Forecast, by Types 2020 & 2033
- Table 58: Global Multi-material Packaging Volume K Forecast, by Types 2020 & 2033
- Table 59: Global Multi-material Packaging Revenue billion Forecast, by Country 2020 & 2033
- Table 60: Global Multi-material Packaging Volume K Forecast, by Country 2020 & 2033
- Table 61: Turkey Multi-material Packaging Revenue (billion) Forecast, by Application 2020 & 2033
- Table 62: Turkey Multi-material Packaging Volume (K) Forecast, by Application 2020 & 2033
- Table 63: Israel Multi-material Packaging Revenue (billion) Forecast, by Application 2020 & 2033
- Table 64: Israel Multi-material Packaging Volume (K) Forecast, by Application 2020 & 2033
- Table 65: GCC Multi-material Packaging Revenue (billion) Forecast, by Application 2020 & 2033
- Table 66: GCC Multi-material Packaging Volume (K) Forecast, by Application 2020 & 2033
- Table 67: North Africa Multi-material Packaging Revenue (billion) Forecast, by Application 2020 & 2033
- Table 68: North Africa Multi-material Packaging Volume (K) Forecast, by Application 2020 & 2033
- Table 69: South Africa Multi-material Packaging Revenue (billion) Forecast, by Application 2020 & 2033
- Table 70: South Africa Multi-material Packaging Volume (K) Forecast, by Application 2020 & 2033
- Table 71: Rest of Middle East & Africa Multi-material Packaging Revenue (billion) Forecast, by Application 2020 & 2033
- Table 72: Rest of Middle East & Africa Multi-material Packaging Volume (K) Forecast, by Application 2020 & 2033
- Table 73: Global Multi-material Packaging Revenue billion Forecast, by Application 2020 & 2033
- Table 74: Global Multi-material Packaging Volume K Forecast, by Application 2020 & 2033
- Table 75: Global Multi-material Packaging Revenue billion Forecast, by Types 2020 & 2033
- Table 76: Global Multi-material Packaging Volume K Forecast, by Types 2020 & 2033
- Table 77: Global Multi-material Packaging Revenue billion Forecast, by Country 2020 & 2033
- Table 78: Global Multi-material Packaging Volume K Forecast, by Country 2020 & 2033
- Table 79: China Multi-material Packaging Revenue (billion) Forecast, by Application 2020 & 2033
- Table 80: China Multi-material Packaging Volume (K) Forecast, by Application 2020 & 2033
- Table 81: India Multi-material Packaging Revenue (billion) Forecast, by Application 2020 & 2033
- Table 82: India Multi-material Packaging Volume (K) Forecast, by Application 2020 & 2033
- Table 83: Japan Multi-material Packaging Revenue (billion) Forecast, by Application 2020 & 2033
- Table 84: Japan Multi-material Packaging Volume (K) Forecast, by Application 2020 & 2033
- Table 85: South Korea Multi-material Packaging Revenue (billion) Forecast, by Application 2020 & 2033
- Table 86: South Korea Multi-material Packaging Volume (K) Forecast, by Application 2020 & 2033
- Table 87: ASEAN Multi-material Packaging Revenue (billion) Forecast, by Application 2020 & 2033
- Table 88: ASEAN Multi-material Packaging Volume (K) Forecast, by Application 2020 & 2033
- Table 89: Oceania Multi-material Packaging Revenue (billion) Forecast, by Application 2020 & 2033
- Table 90: Oceania Multi-material Packaging Volume (K) Forecast, by Application 2020 & 2033
- Table 91: Rest of Asia Pacific Multi-material Packaging Revenue (billion) Forecast, by Application 2020 & 2033
- Table 92: Rest of Asia Pacific Multi-material Packaging Volume (K) Forecast, by Application 2020 & 2033
Frequently Asked Questions
1. What is the projected Compound Annual Growth Rate (CAGR) of the Multi-material Packaging?
The projected CAGR is approximately 5.32%.
2. Which companies are prominent players in the Multi-material Packaging?
Key companies in the market include DS Smith PLC, Lacroix Emballages SA, Nefab Packaging Inc, Mondi PLC, AVERY DENNISON CORP, Tri-Wall Group.
3. What are the main segments of the Multi-material Packaging?
The market segments include Application, Types.
4. Can you provide details about the market size?
The market size is estimated to be USD 177.91 billion as of 2022.
5. What are some drivers contributing to market growth?
N/A
6. What are the notable trends driving market growth?
N/A
7. Are there any restraints impacting market growth?
N/A
8. Can you provide examples of recent developments in the market?
N/A
9. What pricing options are available for accessing the report?
Pricing options include single-user, multi-user, and enterprise licenses priced at USD 3350.00, USD 5025.00, and USD 6700.00 respectively.
10. Is the market size provided in terms of value or volume?
The market size is provided in terms of value, measured in billion and volume, measured in K.
11. Are there any specific market keywords associated with the report?
Yes, the market keyword associated with the report is "Multi-material Packaging," which aids in identifying and referencing the specific market segment covered.
12. How do I determine which pricing option suits my needs best?
The pricing options vary based on user requirements and access needs. Individual users may opt for single-user licenses, while businesses requiring broader access may choose multi-user or enterprise licenses for cost-effective access to the report.
13. Are there any additional resources or data provided in the Multi-material Packaging report?
While the report offers comprehensive insights, it's advisable to review the specific contents or supplementary materials provided to ascertain if additional resources or data are available.
14. How can I stay updated on further developments or reports in the Multi-material Packaging?
To stay informed about further developments, trends, and reports in the Multi-material Packaging, consider subscribing to industry newsletters, following relevant companies and organizations, or regularly checking reputable industry news sources and publications.
Methodology
Step 1 - Identification of Relevant Samples Size from Population Database


Step 2 - Approaches for Defining Global Market Size (Value, Volume* & Price*)

Note*: In applicable scenarios
Step 3 - Data Sources
Primary Research
- Web Analytics
- Survey Reports
- Research Institute
- Latest Research Reports
- Opinion Leaders
Secondary Research
- Annual Reports
- White Paper
- Latest Press Release
- Industry Association
- Paid Database
- Investor Presentations

Step 4 - Data Triangulation
Involves using different sources of information in order to increase the validity of a study
These sources are likely to be stakeholders in a program - participants, other researchers, program staff, other community members, and so on.
Then we put all data in single framework & apply various statistical tools to find out the dynamic on the market.
During the analysis stage, feedback from the stakeholder groups would be compared to determine areas of agreement as well as areas of divergence